The main purpose of this ongoing blog will be to track planetary extreme, or record temperatures related to climate change. Any reports I see of ETs will be listed below the main topic of the day. I’ll refer to extreme or record temperatures as ETs (not extraterrestrials).😜
Main Topic: During 2025 Earth’s Average Temperature Was Third Warmest Since 1850
Dear Diary. Last year was dominated by La Niña ENSO, so as expected it’s averages cooled slightly from record warmth that occurred in 2023 and 2024. That stated, 2025 was the warmest La Niña year on record. An El Niño might quickly develop this year, so 2026 will be flirting with record warm averages again unless there is an uptick in volcanic activity. Stay tuned.
Here is Climate Central’s summary of global warmth during 2025:
KEY FACTS
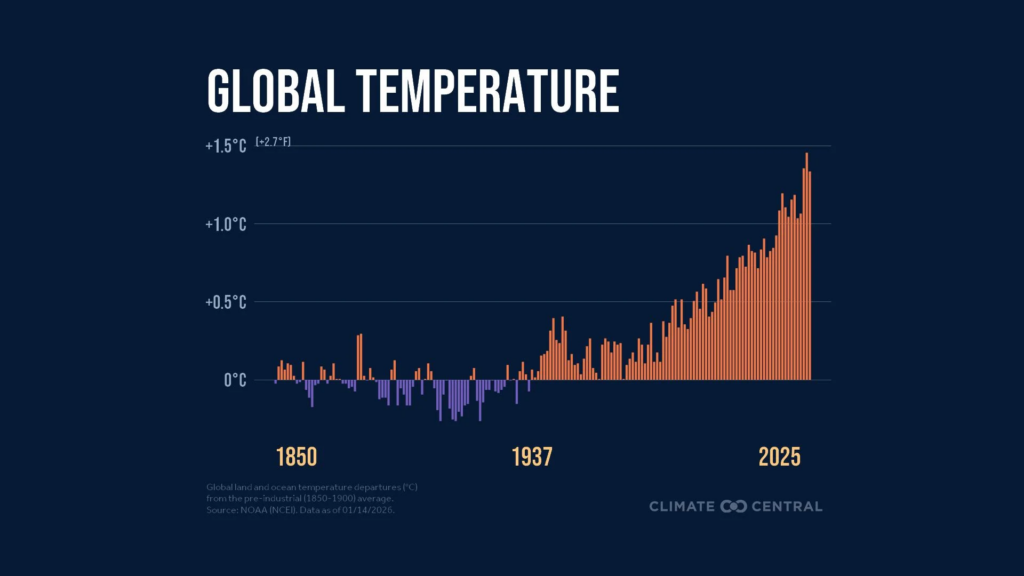
- It’s official: 2025 was Earth’s third-warmest year since records began in 1850 — extending an unprecedented global heat streak into its third year.
- Global average temperatures in 2025 were 1.3°C (2.4°F) above pre-industrial (1850-1900) levels.
- Recent records are part of a larger trend of rapid warming due to heat-trapping pollution from burning fossil fuels (coal, oil, and gas) for electricity, heating and cooling, transportation, and more.
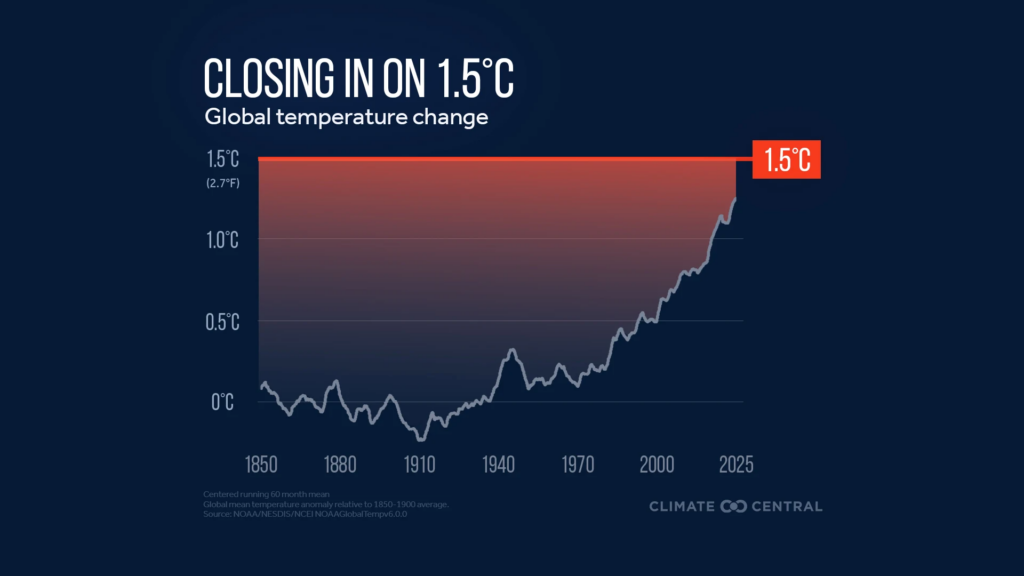
- The planet is rapidly approaching the goal to limit long-term warming to 1.5°C, above which the risks to lives, livelihoods, and ecosystems from pollution-fueled warming and extreme weather will intensify further.
- A safer future is possible, and much of the world is rapidly transitioning away from planet-warming fossil fuels and toward cleaner, and often cheaper, sources of energy.
This Climate Matters analysis is based on open-access data from the National Oceanic and Atmospheric Administration (NOAA). See Methodology for details.
Global temperatures in 2025: third-warmest year on record
Heat-trapping pollution from fossil fuels continued to drive global warming to near-record levels in 2025.
According to the latest NOAA data, 2025 was Earth’s third-warmest year since records began in 1850.
Global average temperatures in 2025 were 1.3°C (2.4°F) above pre-industrial (1850-1900) levels.
Despite the global cooling effect typical of the La Niña conditions that emerged in September, 2025 was still far hotter than almost any other year on record — extending an unprecedented global heat streak into its third year.
Studies show that this global heat streak, which began in 2023 when global temperatures surged beyond previous records, is largely due to human-caused heat-trapping pollution — which is projected to reach record levels yet again in 2025.

It’s not only about one hot year. It’s about decades of rapid warming.
The planet’s 10 warmest years on record have all occurred since 2015. This recent record heat isn’t a coincidence.
Each of these years is part of a larger trend of rapid warming since the Industrial Revolution kicked off a surge in heat-trapping pollution from burning fossil fuels (coal, oil, and gas) for electricity, heating and cooling, transportation, industry, and more.
As a result of burning fossil fuels, levels of heat-trapping CO2 in the atmosphere have surged to levels not seen in at least the last 800,000 years of Earth’s history.
More pollution traps more heat and causes more warming. The excess heat trapped by CO2 and other greenhouse gases has led to rapid warming at rates not seen in at least the last 2,000 years.
More pollution, more warming, higher risks
The effects of rapid global warming — on hurricanes, wildfires, dangerous heat, and other climate extremes — worsen with every additional bit of heat-trapping pollution.
Pollution-fueled extreme events are now a daily reality, disrupting lives and livelihoods, damaging homes and businesses, and displacing communities across the U.S. and around the world.
Nearly every country in the world signed on to the 2015 Paris Agreement to curb these escalating risks by limiting global warming to well below 2°C (3.6°F) relative to pre-industrial temperatures, with an aspirational warming limit of 1.5°C (2.7°F).
These limits refer to long-term warming averaged over at least 20 years — not to temperatures in any single year.
Exceeding 1.5°C of global warming over pre-industrial levels in a single year, which first occurred in 2024, therefore does not mean we’ve breached the Paris Agreement limits.
Nevertheless, recent record-breaking global temperatures push the planet even closer to these limits — escalating widespread risks to health and safety, economies, and ecosystems.
The latest five-year average has global temperatures at 1.25°C (2.3°F) above pre-industrial (1850-1900) levels. And based on the current rate of warming, the planet could exceed the long-term 1.5 °C limit around 2030.
Well-established science shows that warming beyond 1.5°C and 2°C will result in increasingly frequent and intense extreme weather events, and increasingly disruptive impacts on health, nature, crops, and economies around the globe.
A cooler, safer future
The latest global data underscores the urgent need to accelerate the transition away from planet-warming fossil fuels.
Most of the world is progressing rapidly in this direction. Globally, 70% of the increase in electricity demand in 2024 was met with renewable energy like wind and solar.
But in the U.S., recent progress in the clean energy transition faces significant headwinds. As of January 2026, the U.S. has rolled back landmark 2021-2022 policies to boost clean energy and climate resilience, and is withdrawing from the Paris Agreement as well as from the United Nations Framework Convention on Climate Change and the Intergovernmental Panel on Climate Change.
Without a change of course, the country and the world are likely to experience more of the extreme heat, wildfires, flash floods, and damaging hurricanes that marked 2025.
Related Resources
LOCAL STORY ANGLES
Did climate change influence unusual warmth in my area today?
Climate Central’s Climate Shift Index (CSI) provides tools, data, custom maps, and local alerts to answer this question in real time. Here are three ways to use the CSI:
- Use the tools and download free graphics. The Climate Shift Index map shows which parts of the world are experiencing climate change-driven temperatures, every day. Explore the global CSI map for today, tomorrow, and any day in the recent past.
- Access KML files to create custom CSI maps. Get access using the panel links in the map tool and review the KML reference guide.
- Get inbox alerts. Sign up here to receive custom email alerts when significant CSI levels are detected in your local area.
CONTACT EXPERTS
To request an interview with a Climate Central scientist about this analysis, please contact Abbie Veitch, aveitch@climatecentral.org.
FIND EXPERTS
Submit a request to SciLine from the American Association for the Advancement of Science or to the Climate Data Concierge from Columbia University. These free services rapidly connect journalists to relevant scientific experts.
Browse maps of climate experts and services at regional NOAA, USDA, and Department of the Interior offices.
Explore databases such as 500 Women Scientists, BIPOC Climate and Energy Justice PhDs, and Diverse Sources to find and amplify diverse expert voices.
Reach out to your State Climate Office or the nearest Land-Grant University to connect with scientists, educators, and extension staff in your local area.
METHODOLOGY
Global monthly temperature anomalies were obtained from NOAA’s National Centers for Environmental Information (NCEI) using the NOAAGlobalTemp v6.0.0 dataset. Climate Central then re-baselines global temperatures using a pre-industrial baseline of 1850-1900. Note that this is a change from earlier Climate Matters yearly reports that combined NASA and NOAA information and re-baselined to a 1881-1910 normal period. This technical change was made to improve consistency with the Paris Agreement warming limits, which refer to the 1850-1900 pre-industrial baseline.
To estimate how close the world is to consistently exceeding the 1.5°C and 2°C warming thresholds, Climate Central calculates a centered 60-month, or five-year, running average of monthly global temperature anomalies relative to the 1850-1900 pre-industrial baseline. This short-term smoothing reduces the influence of year-to-year natural variability, such as fluctuations linked to El Niño and La Niña, while preserving recent climate change warming.
Here are some “ETs” recorded from around the planet the last couple of days, their consequences, and some extreme temperature outlooks, as well as any extreme precipitation reports:
Here is More Climate News from Wednesday:
(As usual, this will be a fluid post in which more information gets added during the day as it crosses my radar, crediting all who have put it on-line. Items will be archived on this site for posterity. In most instances click on the pictures of each tweet to see each article. The most noteworthy items will be listed first.)