Tuesday February 4th… Dear Diary. The main purpose of this ongoing post will be to track United States extreme or record temperatures related to climate change. Any reports I see of ETs will be listed below the main topic of the day. I’ll refer to extreme or record temperatures as ETs (not extraterrestrials)😉
A Record Positive Arctic Oscillation…A Sign Of A Warming World?
Dear Diary. At this point in time I’m truly interested in the more subtle effects of global warming at different levels of the atmosphere, which can lead to big weather headaches on the ground. Many meteorologists are starting to take note of how deep the polar vortex is at higher latitudes this winter season. When such a cold event occurs it is usually part of a positive phase of the Arctic Oscillating, or for short positive AO. The Arctic Oscillation is the movement of air back and forth between the North Pole area and the areas farther south—like down to the middle of the U.S. Sometimes the air pressure is higher in the south so the warmer air pushes north, and keeps the really cold Arctic air in the Arctic. During a positive phase usually we see relatively mild weather across North America and Europe because the jet stream gets stronger, consolidating across higher latitudes, having a tendency to not dig further south into mid latitude areas.
Indeed this has been happening in spades looking at record warmth across the United States and Southern Europe from January into early February that I have been reporting recently.
Here is what Bob Henson noted concerning this record positive AO:
What Bob noted was a forecast for the positive AO to get to record levels as we go into mid February. Here is what we saw across the Northern Hemisphere over the weekend:

The polar vortex was locked in near the North Pole as noted by the blue colors representing below average 500 millibar heights. There were some cold perturbations dropping into mid latitudes as noted by the cold lobes on the above chart, but “ridges rule” at lower latitudes as noted by the red colors. Some record warmth was associated with the ridge in the U.S. Historic warmth occurred due to the ridge centered near Spain (Just click on the following tweet to see a translation from French to English.):
For more science on the AO please read this article:
https://climate.ncsu.edu/climate/patterns/nao
Here are some great explainer graphics excerpted from the article:


The above two graphics are for a typical positive phase of the AO.


The above two graphics are for a typical negative AO phase. (Sources: Doug Martinson, Wieslaw Maslowski, David Thompson, and John M. Wallace)
The upside to the stronger polar vortex in association with this season’s positive AO is this:
Now, what about an answer to today’s topic question? What trends do we see with the AO in a warming world? Eyeballing 500 millibar charts since the 1980s I’ve noticed that the overall trend for the polar vortex is for it to be shrinking with more positive AOs occurring than negative phases. Sure there have been plenty of negative phases occurring during recent winters, though, as happened in 2013, 2014, and 2019, bringing some record cold conditions to the United States, but overall, I’ve seen many more winters dominated by positive phases. The AO stayed in the positive phase so long during the early part of the decade of the 2000s that some climate scientists were speculating that snow would cease in the Northeast causing many ski resorts to close, which didn’t occur. Speculation, even educated speculation with science, is never that good and fraught with peril.
I’m still looking for some research indicating changes in the AO as the globe warms such as this:
Here is more science from NOAA:
https://www.pmel.noaa.gov/arctic-zone/detect/climate-ao.shtml
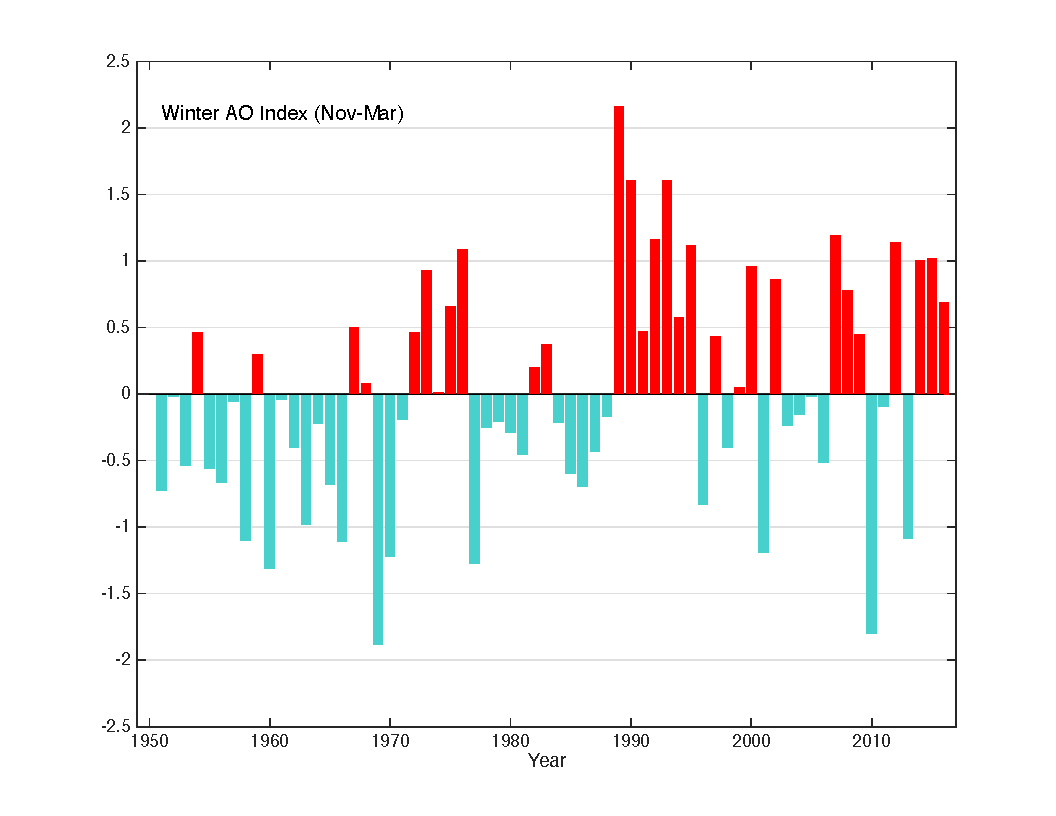
The Arctic Oscillation (AO), shown below, is an important Arctic climate index with positive and negative phases, which represents the state of atmospheric circulation over the Arctic. The positive phase (red) brings lower-than-normal pressure over the polar region, steering ocean storms northward, bringing wetter weather to Scotland and Scandinavia, and drier conditions to areas such as Spain and the Middle East. While the value of the AO index was strongly positive in the early 1990’s compared to the previous forty years, the value of the AO has been low and variable for the last nine years. The year to year persistence of positive or negative values and the rapid transition from one to the other is often referred to as “regime-like”.

The Arctic Oscillation in Winter (November to March).
Data from NCEP.
And more technical information:
https://journals.ametsoc.org/doi/full/10.1175/JCLI-D-16-0467.1
Indeed over the last ten years we have seen wild swings leading to weather chaos in North America and Europe, and that does include heavy snow and record cold during some winters. Perhaps we are starting to see more variability with the AO, but again this is mere educated speculation, which can’t be relied on as of early 2020. I’ll be posting more on the AO as we move through the rest of this winter.
Please consider donating through the Paypal widget on this site. I need everyone’s support to continue my work, especially that of processing NCEI record count data for scientific research.
Here is some more weather and climate news from Tuesday:
(As usual, this will be a fluid post in which more information gets added during the day as it crosses my radar, crediting all who have put it on-line. Items will be archived on this site for posterity.)
(If you like these posts and my work please contribute via the PayPal widget, which has recently been added to this site. Thanks in advance for any support.)
Guy Walton “The Climate Guy”