Welcome to my first blog on my new web site Guy on Climate. You will find that I am very much into scientific statistics that have been showing a warming trend on our planet for decades. We will explore together some relatable, simple math on a variety of climate subjects. There are a multitude of climate blogs out there. Hopefully, this one can add scientific and educational value to what has already been posted on the Internet. I will point out how warming trends will affect you and your progeny. Yes, everyone eventually will be paying a high price for carbon pollution, if not already.
One of my biggest achievements in life has been putting surface record statistics into the forefront for measuring how our climate is changing. The first study can be found here:
http://onlinelibrary.wiley.com/doi/10.1029/2009GL040736/full
As of this writing, including the data from December 2016, there have been a record 25 consecutive months in which there have been more record highs than lows set across our great country. Each tally is a tied surface record or one set by several degrees. A station is eligible once records have been compiled at the site for 30 years. The first study predicted that with time the number if record lows would go down in the 20th century, and that certainly has been the case in 2016. The National Center for Environmental Information site that I am compiling record counts from can be found here:
https://www.ncdc.noaa.gov/cdo-web/datatools/records
Well, why is this data important? Let me give an example. Back in November the “climate change dominoes” were all lined up for a disaster in Gatlinburg, Tennessee. Record heat over the summer combined with drought led to more dry weather and record heat during the fall over the Appalachians, which led to tender dry vegetation. Brush and forest fires had been occurring in the area for most of the fall of 2016. A strong front moving through the Southeast produced gusty winds as high as hurricane force the night of the 27th into the 28th of November producing a conflagration moving through Gatlinburg affecting hundreds of people and killing eight. The warmth of November was key to the disaster. I have been to Gatlinburg. It is one of the most beautiful areas in the Southeast. What a shame.
The following are numbers per month for the last three years:
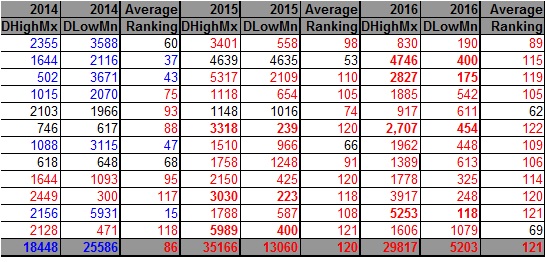
Note that as of this writing there have been 5,253 record highs and only 118 record lows set or tied for November 2016. Record data will trickle into the NCEI site a couple of months after an individual month’s end date. In other words, the final tally won’t be made for November 2016 until February 1st, 2017. In any case, November 2016 had the highest ratio of daily record highs to daily record lows of any month since January 1920 at about 45 to 1. Prior to 1922 viable record data is sparse, so I have opted not to catalogue statistics before 1920. The rankings are for the lower 48 states with the warmest ranking since 1895 being 122 and 1 being the coldest. Blue colors represent cold months and red warm. Months that had near 1 to 1 ratios are colored black representing neutral months. Months that had greater than a 10 to 1 ratio or less than a 1 to 10 ratio are in bold type. November 2016 was the granddaddy of them all.
Think about this. November 2016 had the highest ratio of 1,163 months with many records being set across the Southeast. Going back to the Meehl study of 2009, it is apparent that global warming is increasing ratios of daily highs to daily lows leading to more heat, dry weather, and yes chances for more disasters like Gatlinburg. Yes, you or your offspring will be affected or have already been affected by the heat.
An updated study from this year indicates that the ratio from year to year will average around 15 to 1 by 2100:
http://www.sci-tech-today.com/news/Study+Get+Used+to+Heat+Records/story.xhtml?story_id=112006A641KG
Per one of the authors of both the 2009 and 2016 studies, Claudia Tebaldi said “This climate is on a trajectory that goes somewhere we’ve never been. And records are a very easy measure of that.”
So far, the ratio during this decade is the highest of any since 1920:
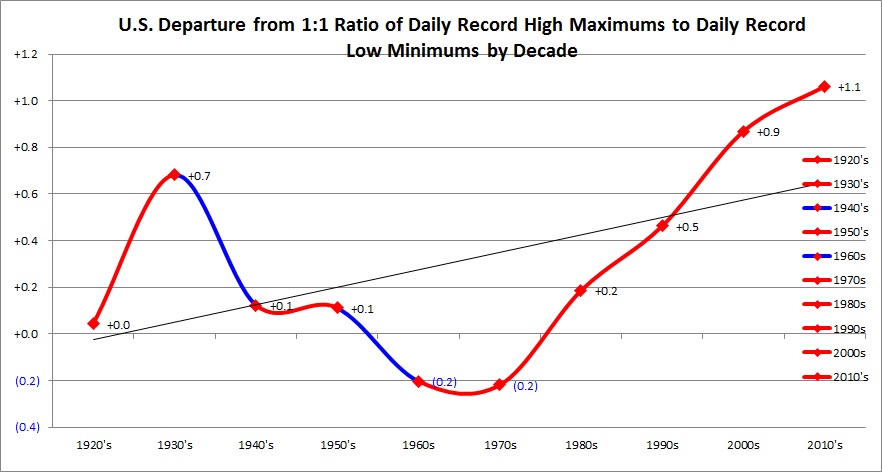
Indeed, the chances for devastating heatwaves have been going up, particularly since 1980. People may not mind in New York City if a record high of near 70 occurs in January, but they would if say it gets over 100 in July. I have also been keeping tabs of how the ratios have been playing out from month to month this decade as noted here:
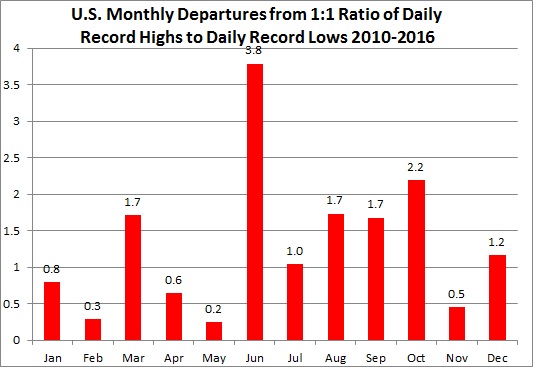
As shown, above average, record setting warmth can occur in any given month. What we are most concerned about is record, potentially killing heat during the summer months.
We will explore why it has been so hot across the U.S. the last couple of years on my next post.
The Climate Guy

thank you for talking about this in plain English
Which part of this post do you think proves human causality?
These record studies linking weather to climate merely show a warming trend. Others have ruled out natural causes pointing to human causality.