The football season has come and gone leaving me with the thrill of my Falcons getting into the Super bowl, and the agony of them blowing a twenty-five-point lead at the hand of the Patriots. In the world of climate, we have another dubious stat of 1916 daily record highs to only 18 daily record lows set in the National Center for Environmental Information site as of February 14th, with another 14 days left to finish out the month. Also, the score is 163 to 0 for monthly highs versus monthly lows in February as of Valentine’s Day. This time I am rooting for the “Cold Team” to make a big comeback against the “Hot Team”, but at February’s half time, it would appear that the game is about over. Yes, the Falcons had a 21-3 lead at the half, but unlike in football, there isn’t a team like the Patriots to even the score and then win the game for the Cold Team in the world and game of meteorology.
The NCEI site that I am keeping score from is here: https://www.ncdc.noaa.gov/cdo-web/datatools/records
I will continue to refer to an updated study indicating that the ratio of daily record highs to daily record lows from year to year will average around 15 to 1 by the year 2100 shown here:
http://www.sci-tech-today.com/news/Study+Get+Used+to+Heat+Records/story.xhtml?story_id=112006A641KG
One of the authors, Claudia Tebaldi, can be quoted: “This climate is on a trajectory that goes somewhere we’ve never been. And records are a very easy measure of that.”
On my first post, I referred to November 2016 which, as far as I can tell, had the highest ratio of daily record highs to daily record lows for any calendar month since January 1920. The numbers for NOV 2016 have stabilized at 5255 DRH’s to only 120 DRL’s for an all-time record ratio of 44-1. So far at half time the ratio is 106-1 for FEB 2017. Could we be seeing another special month, statistically? Think about this. We could see the two highest months with ratios at or above 44-1 within the span of only the last four months. February 2017 could see the highest ratio of daily record highs to lows of any month in 1,166 months! Will the Cold Team with its polar air mass linebackers and an icy quarterback score enough points to win after the second half of the game? The answer is probably not.
The following is one of the temperature outlooks posted for most of the remainder of February:

Yes, most of our meteorological models and ensembles forecast that the Hot Team will make too many touchdowns and be tough enough on defense to score safeties to prevent a big win during the month of February by the Cold Team. We will all be watching carefully from day to day to see how the statistics pan out. Those cheerleading for cold weather to make the case that climate change is not occurring have very little to yell and scream about this month in the United States. This ref isn’t going to make a bad call.😊
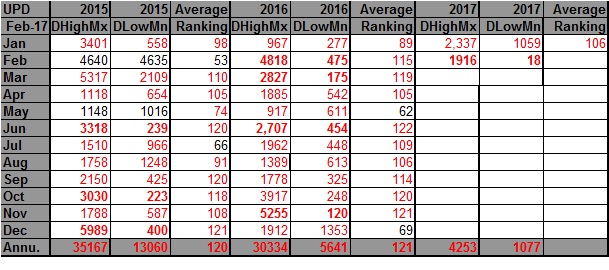
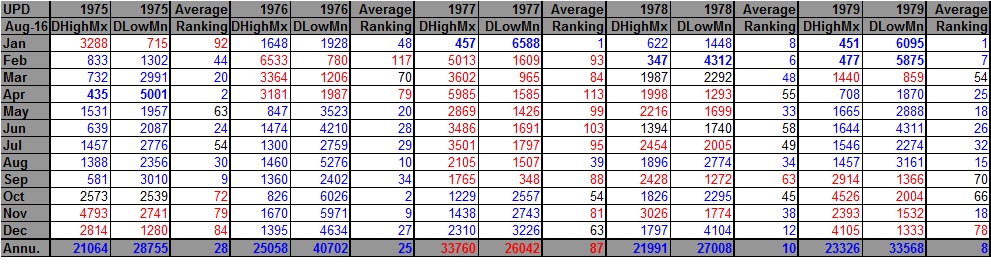
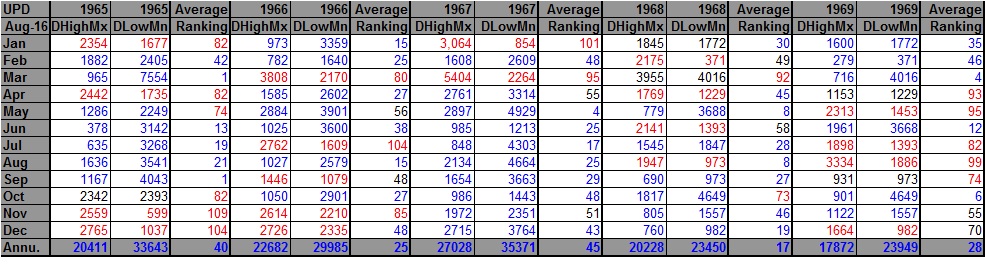
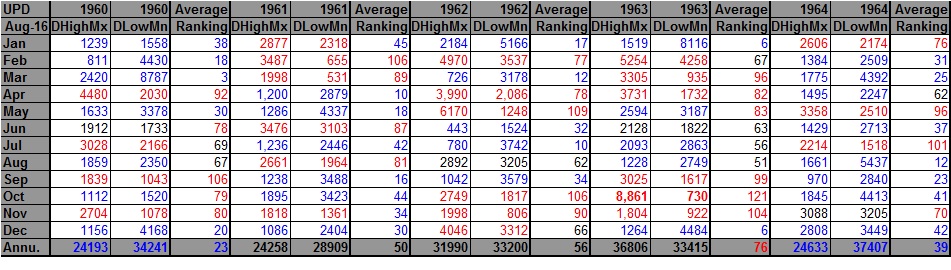
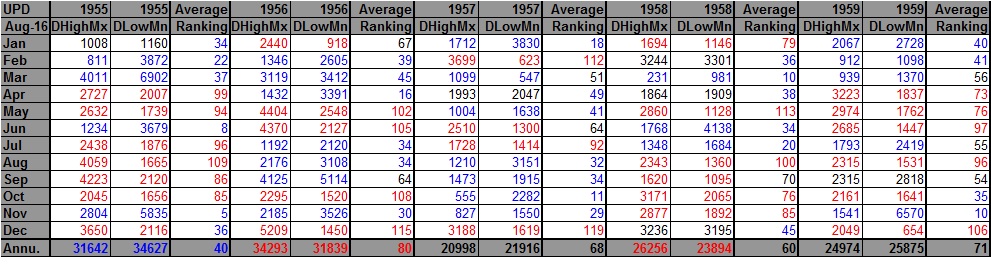
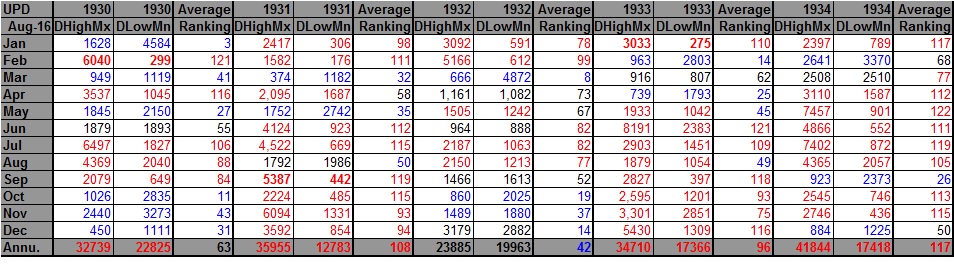
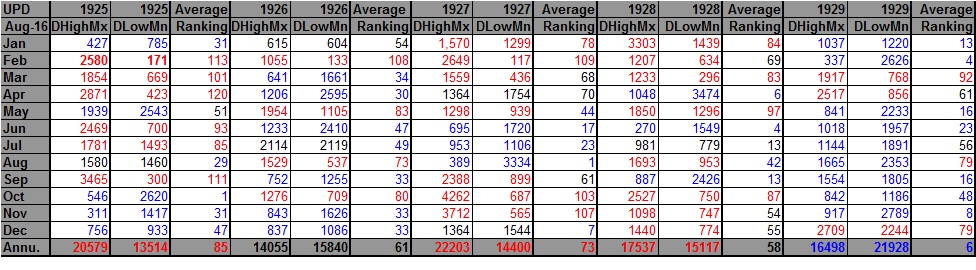
Well, here is the whole pigskin or enchilada of my record data, which I have deemed “The Records Genome”. Please don’t get too cross eyed when looking at these rather wonky charts. Prior to 1922 viable record data is sparse, so I have opted not to catalogue statistics before 1920. The rankings are for the lower 48 states average temperatures with the warmest ranking since 1895 being 122 and 1 being the coldest. Blue colors represent cold months and red warm. Months that had near 1 to 1 ratios are colored black representing neutral months. Months that had greater than a 10 to 1 ratio or less than a 1 to 10 ratio are in bold type. Again, marvel at how few daily record lows have occurred, so far, this month given the scope and magnitude of the rest of the data on these charts:


I will be back with another post by next week.
The Climate Guy