Wednesday April 25th… Dear Diary. The main purpose of this ongoing post will be to track United States extreme or record temperatures related to climate change. Any reports I see of ETs will be listed below the main topic of the day. I’ll refer to extreme or record temperatures as ETs (not extraterrestrials)😊. Here is today’s main climate change related topic:
Record High CO2 Levels
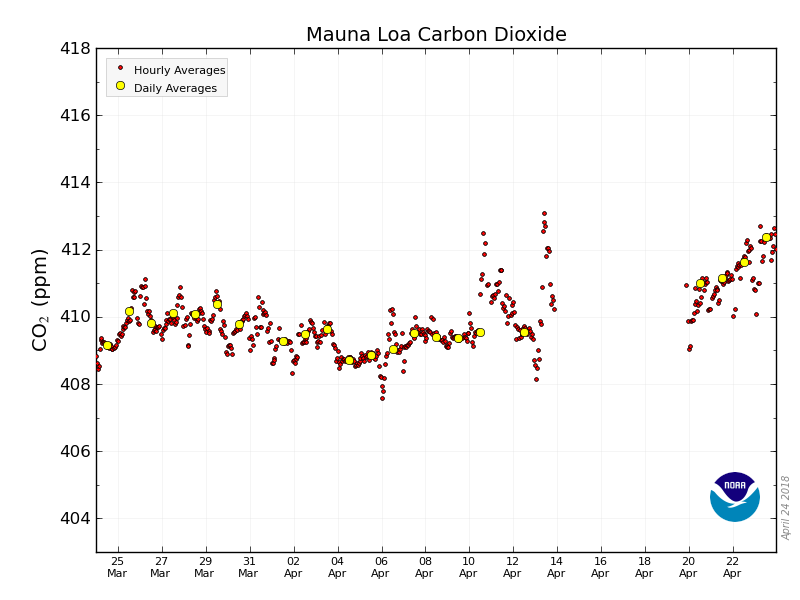
Ever since the 1950s levels of carbon in the atmosphere have been taken by members of the Keeling family at the summit of Mauna Loa in Hawaii. These measurements are a true test to see if international agreements like the Paris Accords are having much of an effect to limit carbon pollution. So far if I were the teacher giving out test grades I’d give the world an F or at most a D. As most know carbon levels naturally go down as spring foliage starts to green Northern Hemisphere land masses, so peak annual levels occur in April. Here is what we see this year:
 Eric HolthausVerified account @EricHolthaus
today set a new all-time record for CO2 the year. which means it’s also the new all-time record since civilization began.
get your shit together, humans.

 Zack LabeVerified account @ZLabe
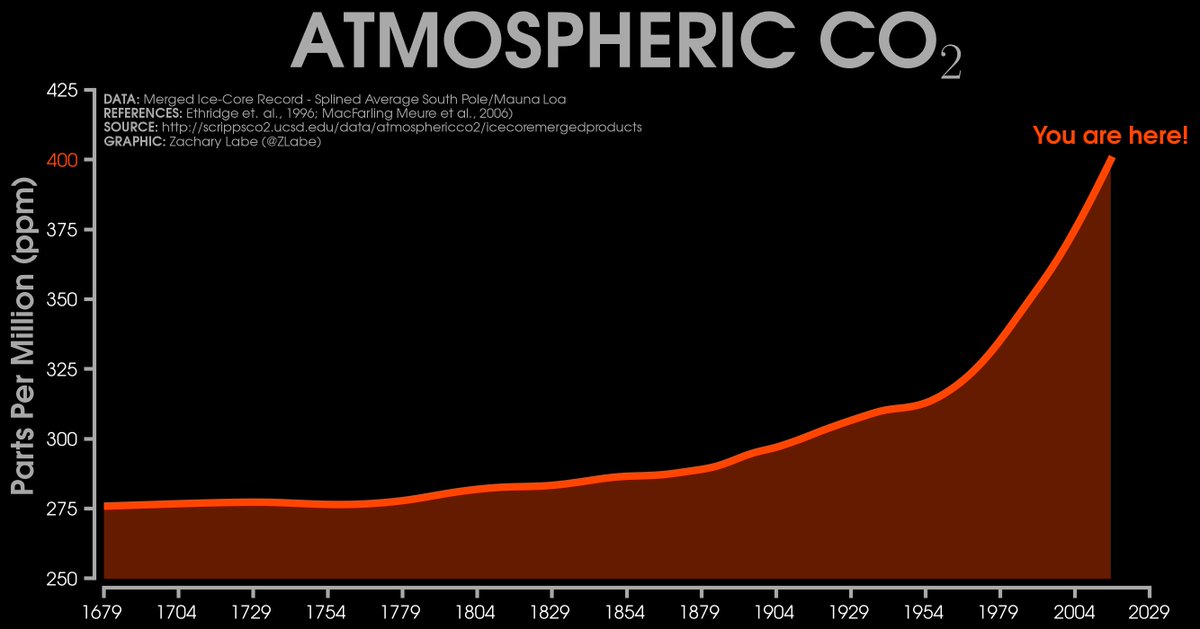
Data from merged ice-core record with Mauna Loa/South Pole observations via http://scrippsco2.ucsd.edu/data/atmospheric_co2/icecore_merged_products …

Highest-ever daily average CO2 | Maua Loa Observatory
2018
Highest CO2 levels recorded so far in 2018:
412.37 ppm on April 23, 2018 (NOAA-ESRL)
411.21 ppm on April 21, 2018 (Scripps)
2017
412.63 ppm on April 26, 2017 (NOAA-ESRL)
411.27 ppm on May 15, 2017 (NOAA-ESRL)
2016
409.44 ppm on April 9, 2016 (Scripps)
409.39 ppm on April 8, 2016 (Scripps)
2015
404.84 ppm on April 13, 2015 (Scripps)
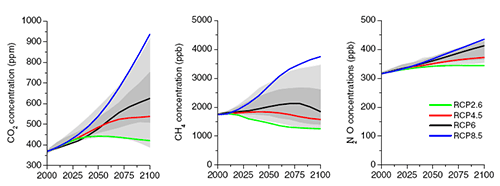
This might be some good news. The only reason I am not giving the world an F grade is because it would appear that CO2 concentrations have leveled off from last year currently, which are at around 412.5 parts per million. The bad news is that for the first time in human history we are seeing years in which CO2 concentration exceed 410 ppm. Over the last several years the level registered has risen by 2-4 ppm per year. Let’s say that levels remain rising at 3ppm per year. Doing some simple math given that the maximum ppm in 2018 will be about 412 ppm the planet should see the 450 ppm level in 2032 (in 14 years). From what I can peg we are on track to be somewhere between a worst case scenario RCP8.5 and the more moderate RCP6.0 curve. (information from: https://www.skepticalscience.com/rcp.php?t=3#trajectories)
Greenhouse Gas Concentrations
Figure 9: Trends in concentrations of greenhouse gases (van Vuuren 2011). Grey area indicates the 98th and 90th percentiles (light/dark grey) of the recent EMF-22 study (Clarke et al. 2010) Click image for larger version
“The greenhouse gas concentrations in the RCPs closely correspond to the emissions trends discussed earlier . For CO2, RCP8.5 follows the upper range in the literature (rapidly increasing concentrations). RCP6 and RCP4.5 show a stabilizing CO2 concentration (close to the median range in the literature). Finally, RCP2.6 has a peak in CO2 concentrations around 2050, followed by a modest decline to around 400 ppm CO2, by the end of the century. For CH4 and N2O, the order in which the RCPs can be placed are also a direct result of the assumed level of climate policy. The trends in CH4 concentrations are more pronounced, as a result of the relatively short lifetime of CH4. Emission reductions, as in the RCP2.6 and RCP4.5, therefore, may lead to an emission peak much earlier in the century. For N2O, in contrast, a relatively long lifetime and a modest reduction potential imply an increase in concentrations, in all RCPs. For both CH4 and N2O, the concentration levels correspond well with the range in the literature. Further information on the calculations of concentration can be found in Meinshausen et al. (2011b)” (van Vuuren et.al. 2011).
Zack Labe’s chart confirms that preindustrial levels of CO2 were at about 280 ppm. Bill McKibben thinks that atmospheric levels of CO2 should not stray to far from 350 ppm in order to maintain an environment civilization has adjusted to through the centuries. The more we stray from 350 ppm the worse consequences will be. The carbon genie can’t be put back into a bottle, only stored in carbon sinks such as forests and the oceans. I’ll report on CO2 levels again in April 2019 or if there has been a significant change.
………………………………………………………………………………………………
The United States is entering a much warmer synoptic pattern than what occurred this fairly chilly month since a ridge will pop up east of the Rockies next week:

I’m not impressed, though, at surface heat forecasts, so I doubt we see too many ET reports next week.
(If you like these posts and my work please contribute via the PayPal widget, which has recently been added to this site. Thanks in advance for any support.)
The Climate Guy
 412.37 parts per million (ppm)
