Friday December 7th… Dear Diary. The main purpose of this ongoing post will be to track United States extreme or record temperatures related to climate change. Any reports I see of ETs will be listed below the main topic of the day. I’ll refer to extreme or record temperatures as ETs (not extraterrestrials)😊.
More U.S. November Climatology/Early December Trends
The National Center for Environmental Information has completed climatology statistics for November and boreal fall 2018. As usual after each month gets processed Bob Henson writes an excellent summary, which I invite all to read:
The lower 48 states experienced a “rare” colder than average November (27th coolest out of 124 years since records have been kept in 1895). November was wet, as well, coming in at 31st wettest out of 124. What strikes me about boreal fall, overall, is that it came in ranked 2nd wettest out of 124 years. As we know climate change is beginning to produce heavier precipitation in non arid areas of the planet. This from Bob’s blog (Quoted in maroon red):

Figure 1. Statewide rankings for average precipitation for September-November 2018, as compared to each autumn since records began in 1895. Darker shades of green indicate higher rankings for moisture, with 1 denoting the driest month on record and 124 the wettest. Image credit: NOAA/NCEI.
As is often the case, hurricanes played a big role in wet conditions across the eastern U.S. Chief among them was slow-moving Florence, which dumped 10” – 20” rains over a broad part of the Carolinas in early September. Florence set all-time records for heaviest rainfall from a tropical cyclone in both North Carolina (35.93” at Elizabethtown) and South Carolina (23.63” near Loris). Hurricane Michael also passed over the Southeast in early October, though Michael’s rapid motion made it a less prodigious rain-maker than Florence.
Remarkably, Texas saw its record-wet autumn without any direct hits from Atlantic tropical cyclones. Much of the rain came from weak upper-level disturbances intersecting with surface boundaries amid a very moist atmosphere. In early October, the remnants of former Category 4 Hurricane Sergio moved from the Northeast Pacific across northern Mexico and brought heavy rain to Texas, triggering major flooding in the state’s Hill Country.

Figure 2. Precipitation in Texas between September and November 2018 smashed a 99-year-old record for the highest observed in any autumn in records going back to 1895. Image credit: Jon Erdman, weather.com, via NOAA/NCEI.
The following is my “Record Scoreboard” updated through 12/1/2018:
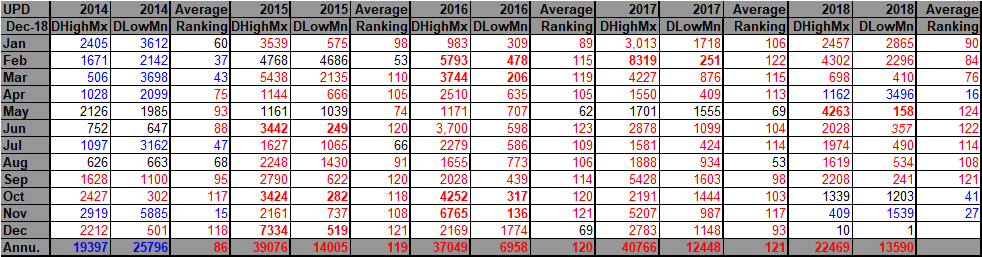
For this data set all monthly ratios of > 10 to 1 DHMX to DLMN or > 10 to 1 DLMN to DHMX are in bold type. The rankings are for the lower 48 states with the warmest ranking since 1895 of average temperatures being 124 and 1 being the coldest as of 2018. Blue colors represent cold months and red warm. Those months with counts close to a 1 to 1 ratio of highs to lows are colored black. Boldly colored months, such as May 2018, have ratios of more than 10 to 1 daily record highs to lows or lows to highs, and are either historically hot or cold. November 2018 had a well below 1 to 1 ratio of record DHMX to DLMN individual counts, so the color I used for this month was blue. NCEI has processed November data across the country, determining that the lower 48 had its 27th coldest month since 1895, also added to the chart. The number 27 falls lower than the mid range (+ or – 10 from 62) or (1-41, 52-72, 73-124 ), so is also colored blue. (There have only been 11 daily record reports for December 2018 so far.)
November 2018 is only the 2nd month since November 2014 that more daily record lows than highs were recorded…a big climate change marker. It’s interesting that both November 2014 and November 2018 had similar numbers at the start of an El Nino cycle, but this maybe a coincidence.
So what is in store for much of December? Knowing a bit more from what was discussed here: https://guyonclimate.com/2018/11/29/extreme-temperature-diary-november-29-2018-topic-jet-split-flow-a-sign-of-el-nino/ , it appears that strong southern branch (jet) storms will be slamming into California and be quite strong as they move east of the Rockies through at least 12/15 affecting most states south and east of the norther Plains. The first dubbed by the Weather Channel as Diego will produce a snowy, icy mess for the northern and western Carolinas. More systems are slated for the middle of this month as denoted by cold lobes on this 500 millibar chart:
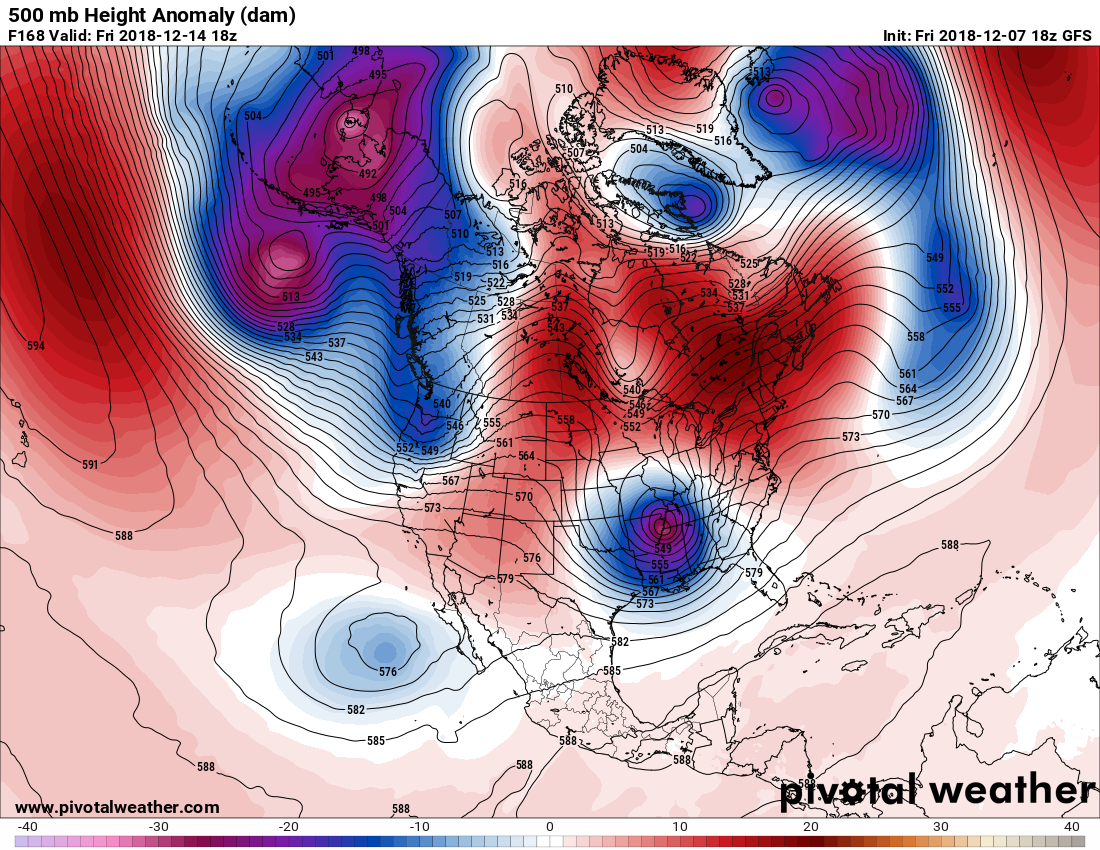
Interestingly most systems won’t produce much precipitation for California with the storm track moving into the Pacific Northwest then dipping southeast across the central and southern states such as the deep storm forecast as a closed low centered near Memphis in the chart. We will continue to see both heavy rain and snow from these systems with I’m sure some eye popping amounts. High winds will surely be a factor, as well.
Temperature wise mid December is forecast to be milder than average, mainly across the northern tier of states:
Scott Fisher Says: NOAA 6-10 Temperature Outlook pic.twitter.com/CtyI2o2nFg
— Scott Fisher (@ScottFisherFOX7) December 5, 2018
Scott Fisher Says: 8-14 Temp Outlook pic.twitter.com/8oUqL8T0Gz
— Scott Fisher (@ScottFisherFOX7) December 5, 2018
A couple of strong storms may put a cold dent in these forecasts. We will see.
…………………………………………………………………………..
Here is some other weather and climate news from Friday:
(As usual, this will be a fluid post in which more information gets added during the day as it crosses my radar, crediting all who have put it on-line. Items will be archived on this site for posterity.)
As Trump Presidency slowly spirals down the bowl – Fox News tonight is featuring an attack on #climatechange action – Of Course @climateguyw @Jackthelad1947 @greentim @GreenDivaMeg @LynnDe6 @1WarMachine2018 @2021_free @StarryEyed48 @dawnresist @melvan1104 @LBC1961 @tinyboo49 pic.twitter.com/GdB43UdRda
— Allan Margolin (@AllanMargolin) December 8, 2018
Devastating wildfires in November impacted California, where long-term dryness and above-average temperatures created conditions conducive for fire. Learn more in our U.S. #StateOfClimate report: https://t.co/pnxaMsLQfz pic.twitter.com/TqCOBnyFOO
— NOAA NCEI Climate (@NOAANCEIclimate) December 7, 2018
Alaska had its 3rd warmest year-to-date on record: https://t.co/pnxaMsLQfz #StateOfClimate pic.twitter.com/ENgDdnhZ30
— NOAA NCEI Climate (@NOAANCEIclimate) December 7, 2018
How hard is snow forecasting? Monroe NC forecast is 1" snow – Gastonia NC is 10" of snow. Cities are 40 miles apart and #CharlotteNC and its 1 million people are right in middle! #ForecastUncertainty pic.twitter.com/M9ebUhMbgm
— Bill Karins (@BillKarins) December 7, 2018
(If you like these posts and my work please contribute via the PayPal widget, which has recently been added to this site. Thanks in advance for any support.)
The Climate Guy