Thursday September 10th… Dear Diary. The main purpose of this ongoing blog will be to track United States extreme or record temperatures related to climate change. Any reports I see of ETs will be listed below the main topic of the day. I’ll refer to extreme or record temperatures as ETs (not extraterrestrials).😉
Main Topic: Early September Record Scoreboard Update And Climatological Review
Dear Diary. It seems like all of the gods are out to get us in 2020. Ever since the beginning of the year I’ve been reporting on COVID-19. The summer has brought us more woe. We have already had two deadly landfalling U.S. hurricanes in Isaias and Laura. A derecho devastated portions of the Midwest. I began naming deadly and historic heatwaves after mythological demons. Beelzebub produced many records in August and Chort was eyepopping most recently in the West, which has led to historic fires.
According to the National Center for Environmental Information summer 2020 was the 4th warmest across the lower 48 states. All of that record heat has really cone hone to roost, as stated, in the form of mire deadly storms, drought and exacerbated wildfires. Here on this site we present monthly summaries near the 7thh of each month, and each is available if you want to go back through my Extreme Temperature Diary archive.
I’m repeating my mantra from last month:
August 2020 got ranked by the National Center for Environmental Information as a well above average August, temperature wise, for the lower 48 states, coming in as 124th coolest or 3rd warmest since records began being kept in 1895:
https://www.ncdc.noaa.gov/cag/national/rankings

All of the Southwest had its hottest summer on record leading to awful September conflagrations that we now see in September. The heart of the country saw the most relatively coolest conditions.
Here are my two U.S. Daily Record Scoreboards updated through 9/8/2020 (data compiled from the following NCEI site):
https://www.ncdc.noaa.gov/cdo-web/datatools/records
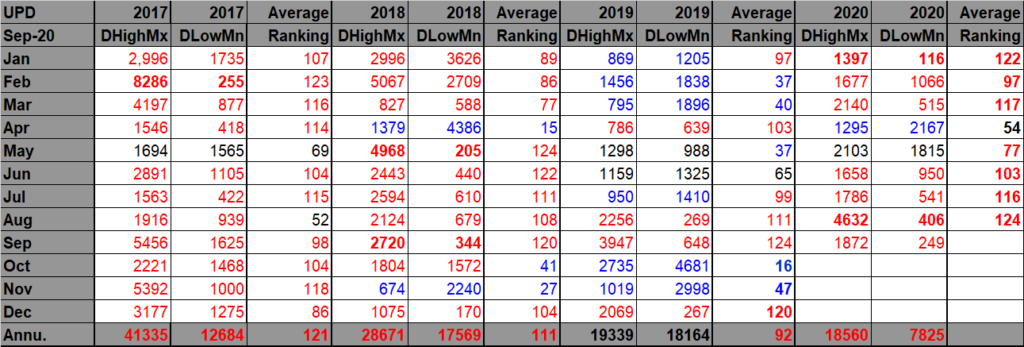
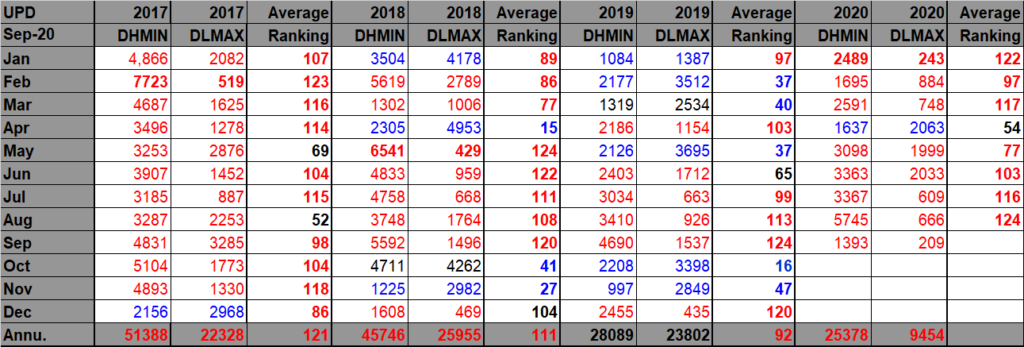
DHMX= Daily High Max Reports. DLMN= Daily Low Min Reports. DHMN= Daily High Min Reports. DLMX=Daily Low Max Reports.
For these data sets all monthly ratios of > 10 to 1 DHMX to DLMN or > 10 to 1 DLMN to DHMX are in bold type. The rankings are for the lower 48 states with the warmest ranking since 1895 of average temperatures being 125 and 1 being the coldest as of 2020. Blue colors represent cold months and red warm. Those months and years with counts close to a 1 to 1 ratio of highs to lows are colored black. Boldly colored months, such as January 2020, have ratios of more than 10 to 1 daily record highs to lows or lows to highs, and are either historically hot or cold, most of which have made news.
August 2020 had approximately a 11-1 ratio of record DHMX to DLMN individual record counts, so the color I used for this month was bold red on the top chart.
August 2020 had approximately a 9-1 ratio of record DHMN to DLMX individual record counts, so the color I used for this month was red on the bottom chart.
Due to climate change we will see less blue colors on these Record Scoreboards with time.
As stated, the ranking for August 2020 was 124, which was colored red. I color rankings +10 or -10 from the average ranking of 63 black, indicating that these are near average temperature wise.
We are seeing strong indications that September 2020 will be another above average month looking at meteorological guidance and record reports coming into the NCEI system, so far. Never forget that it was hot enough in the Southwest to produce a few all-time records in early September. The cold records presented so far in September on the record scoreboard come from the historic cold shot diving down through the Rockies, producing very early for the autumn season snow, aiding to end or lessen Heatwave Chort.
Here is much more detailed U.S. climatology as complied by NOAA:
https://www.ncei.noaa.gov/news/national-climate-202008
Assessing the U.S. Climate in August 2020
Third-warmest August, fourth-warmest summer for contiguous U.S.

Courtesy of Shutterstock.com
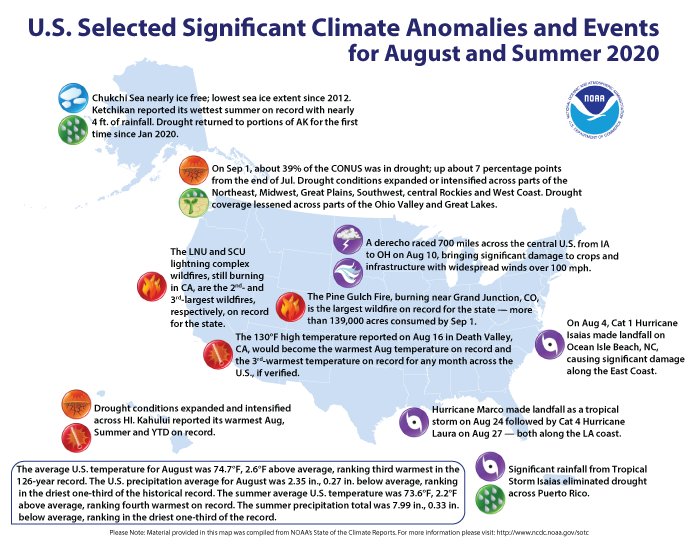
For August, the contiguous U.S. average temperature was 74.7°F, 2.6°F above the 20th-century average and ranked third-warmest August on record. During meteorological summer (June-August), the average temperature for the Lower 48 was 73.6°F, 2.2°F above average, ranking fourth warmest in the historical record. For the year to date, the contiguous U.S. temperature was 56.3°F, 2.4°F above the 20th-century average, ranking seventh warmest in the January-August record.
The August precipitation total for the contiguous U.S. was 2.35 inches, 0.27 inch below average, ranking in the driest third of the 126-year period of record. The summer precipitation total across the Lower 48 was 7.99 inches, 0.33 inch below average, ranking in the driest third of the historical record. The year-to-date precipitation total across the contiguous U.S. was 21.64 inches, 0.93 inch above the long-term average, ranking in the wettest third of the January-August record.
Hurricanes Isaias and Laura made landfall along the contiguous U.S. coastline, bringing heavy winds, rainfall, tornadoes and significant damage to infrastructure. A mid-month derecho swept across the Midwest, damaging crops and leaving many without power for days on end. Four western wildfires made history as Colorado’s largest fire and California’s second-, third- and fourth-largest fires in state history. Record heat impacted many locations across the western U.S., Southeast and Northeast.
This monthly summary from NOAA National Centers for Environmental Information is part of the suite of climate services NOAA provides to government, business, academia, and the public to support informed decision-making.
August Temperature
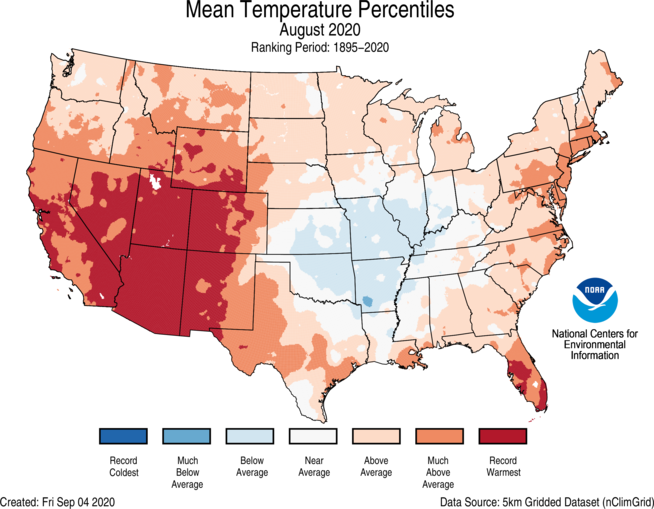
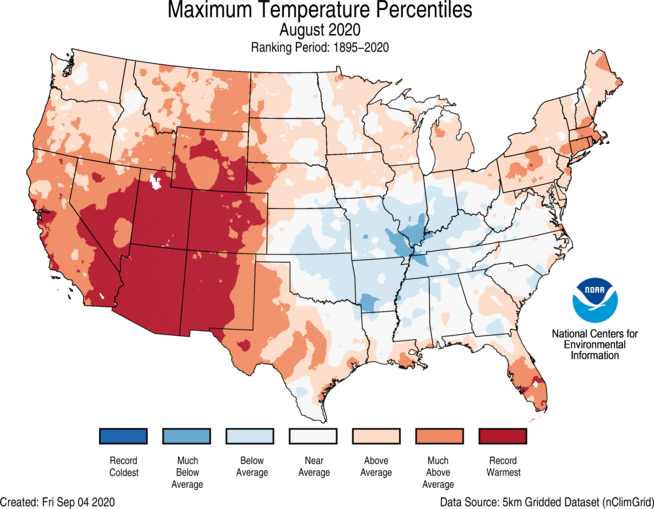
- An unusually strong ridge of high pressure during mid-August across the western contiguous U.S. drove the record heat seen across much of the Southwest.
- Above- to much-above-average August temperatures were observed across all but an area from the central Plains to the Ohio Valley with widespread record warmth across the western U.S. California, Nevada, Arizona, Utah, New Mexico and Colorado each had their warmest August on record. Arizona shattered its previous warmest August of 2011 by 2.1°F. The predominance of warmth across the West can be attributed to record and near-record warm daytime high temperatures.
- On August 16, the Furnace Creek Visitor Center in Death Valley, California, reported a high temperature of 130°F. If verified, this temperature would be the warmest August temperature on record and the third-warmest temperature on record for any month across the U.S.
- August was the hottest month on record for Phoenix, with an average temperature of 99.1°F. This broke the previous record, 98.3°F, which was set just last month.
- Below-average temperatures were observed across parts of the central Plains and middle to lower Mississippi Valley.
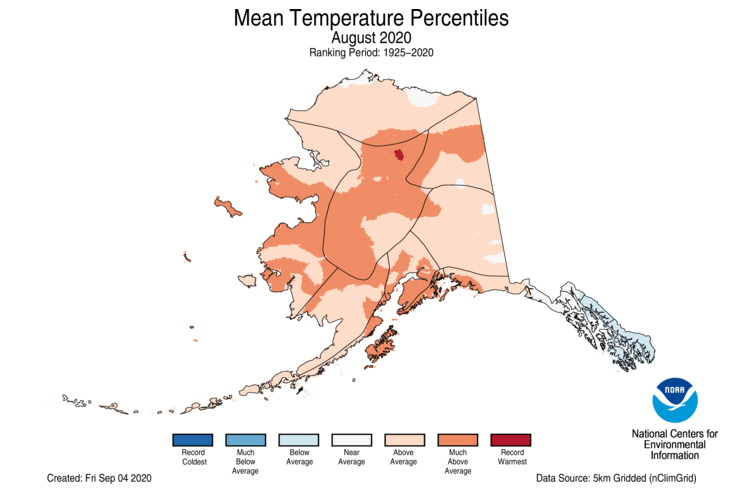
- The Alaska average August temperature was 52.1°F, 2.6°F above the long-term mean, ranking in the warmest third of the 96-year period of record for the state. Above-average temperatures were present across most of Alaska. Cooler-than-average conditions were present across much of the rain-soaked Panhandle.
- Significant sea ice melt across the Chukchi Sea occurred during August, leaving the waters 99% open. This is the lowest sea ice extent since 2012.
August Precipitation
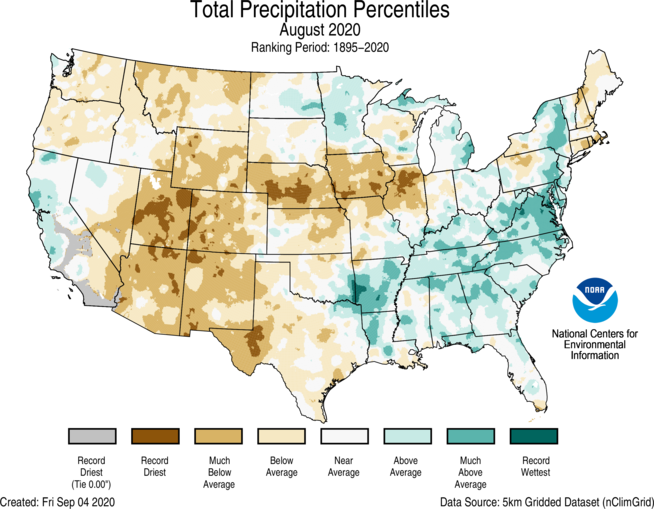
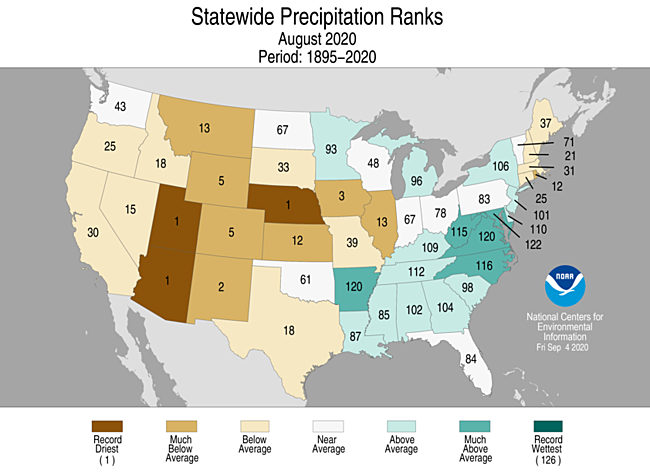
- Above-average precipitation was observed from the central Gulf Coast to the mid-Atlantic and across portions of the Great Lakes and Northeast as well as coastal California. Maryland ranked fifth wettest on record for August while Virginia ranked seventh wettest.
- Below-average precipitation stretched from the Southwest to the Midwest and from the Northwest to the western Gulf Coast. Arizona, Utah and Nebraska ranked driest on record for August while New Mexico and Iowa ranked second and third driest on record, respectively.
- Precipitation across Alaska was near-average for August. Northern and western portions of the state received below-average precipitation, while much of the eastern Interior and Panhandle received above-average precipitation.
- According to the September 1 U.S. Drought Monitor report, approximately 39% of the contiguous U.S. was in drought, up almost seven percentage points from the end of July. Drought conditions expanded or intensified across parts of the Northeast, Midwest, Great Plains, Southwest, central Rockies, West Coast and Hawaii. Drought returned to portions of Alaska for the first time since January 2020. Drought coverage lessened across parts of the Ohio Valley and Great Lakes, with drought conditions eliminated across the Commonwealth of Puerto Rico.
August Extremes
- Hurricane Isaias made landfall on August 4 at Ocean Isle Beach, North Carolina, and accelerated up the East Coast, resulting in widespread damage and power outages across New York, New Jersey and Pennsylvania.
- On August 10, a derecho, or line of severe weather, raced 700 miles across the central U.S. from Iowa to Ohio and brought significant damage to crops and infrastructure with reports of widespread winds more than 100 mph.
- In August, tropical storms Josephine and Kyle as well as hurricanes Laura and Marco became the earliest 10th through 13th named storms on record in the North Atlantic Basin, continuing the streak of record-pace named storms this season. Including tropical storms Nana and Omar, which formed on September 1, 12 of the 15 named storms to-date in 2020 occurred earlier in the calendar year than any other such named storm on record.
- On August 27, Hurricane Laura made landfall in southwest Louisiana as a Category 4 storm with 150 mph winds. This tied the 1856 Louisiana hurricane for the strongest landfalling winds on record for the state.
- The SCU and LNU Lightning Complex and the August Complex wildfires, burning in central and northern California are the second-, third- and fourth-largest fires on record in California, respectively, and currently fall shy of the record Mendocino Complex fire of 2018, in which 459,123 acres were consumed.
- The Pine Gulch wildfire, near Grand Junction, Colorado, is the largest wildfire in Colorado history with over 139,000 acres consumed and was approximately 80% contained at the end of August. The previous record was held by the 2002 Hayman Fire.
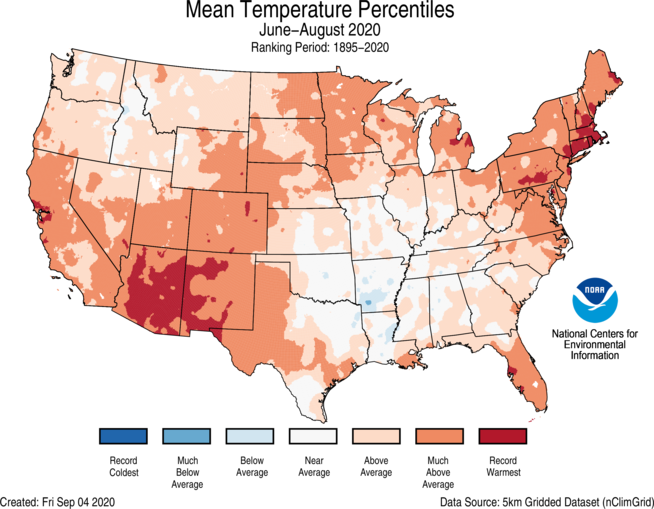
Summer (June–August) Temperature

- Above- to much-above-average summer temperatures spanned most of the Lower 48 with pockets of near-average and below-average temperatures observed in the Lower Mississippi Valley. Arizona, Connecticut, Rhode Island and Massachusetts each reported their warmest June-August on record. Eleven additional states had a top-5 warmest summer. No state ranked below average for the summer season.
- Many stations across the Southwest, Southeast, Mid-Atlantic and Northeast tied or broke their record for the warmest summer on record.
- The Alaska statewide average temperature for the summer was 52.0°F, 1.5°F above average and ranked in the warmest one-third of the 96-year record. Temperatures were warmer than average across central, western, southwestern and southcentral Alaska, while much of the North Slope and eastern Interior were near average. Below-average temperatures were present across much of the Panhandle.
- Kodiak reported its sixth-warmest summer since the 1930s, with 2015, 2016 and 2019 each warmer than what was observed in 2020.
- Seasonal wildfire activity across Alaska was below-average with the lowest acreage consumed since 2008.
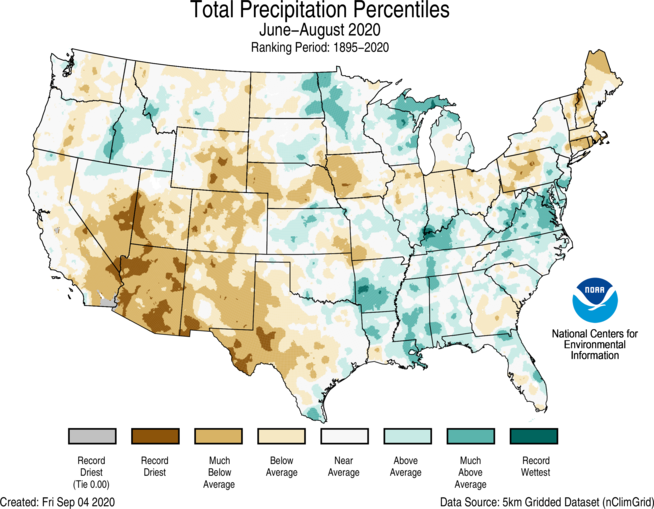
Summer (June–August) Precipitation

- Above-average precipitation was observed in parts of the Northwest, the Great Lakes and from the lower Mississippi River Valley to the Mid-Atlantic. Virginia had its 10th-wettest summer on record.
- Below-average precipitation was observed across much of the West, Rockies, Deep South and from portions of the central Plains to the Northeast. Arizona had its driest summer on record receiving about 33% of its seasonal average. This follows the previous record dry summer of 2019, which yielded approximately 41% of average precipitation. New Mexico, Colorado, California and Rhode Island each had a top 10 driest summer.
- In Alaska, Ketchikan reported its wettest summer on record with nearly four feet of rainfall. Juneau set a record for the most number of summer days with measurable rainfall — 68. The former record of 67 days was reported in 2006. In contrast, Kotzebue, had its second-driest August since 1943 and subsequently, the lowest summer rainfall observed since 1977.
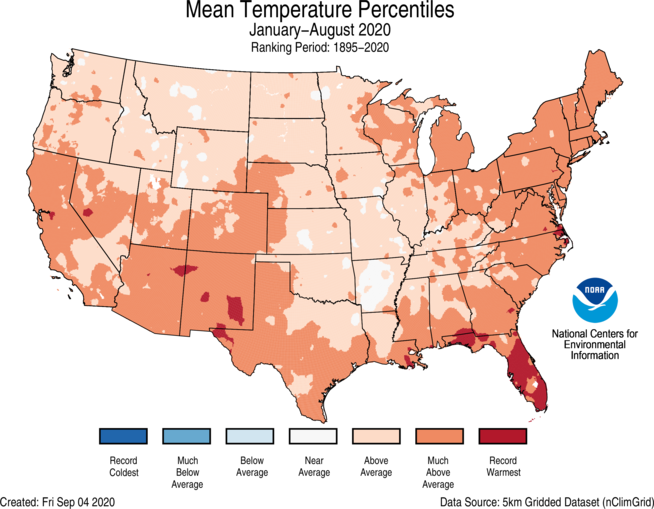
Year-to-date (January–August) Temperature

- Above- to much-above-average year-to-date temperatures were observed across nearly the entire Lower 48. The year-to-date average temperature for Florida ranked warmest on record with 2019 and 2017 ranking second and third warmest. Maryland, Delaware, New Jersey and Rhode Island ranked second warmest for this January-August period.
- Phoenix shattered a record for the most number of days in a calendar year with a high temperature of at least 110°F. Through September 1, there were 50 days in 2020 where temperatures were at least 110°F. This exceeds the 2007 record of 33 days.
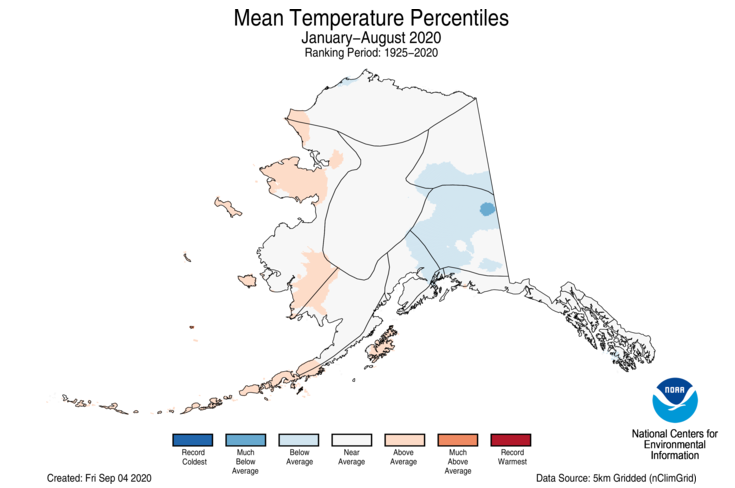
- Year-to-date temperatures averaged across Alaska were near-average with above-average temperatures observed along portions of the West Coast and the Aleutians. Below-average temperatures for this year-to-date period were observed across parts of the eastern interior regions and Cook Inlet.
Year-to-date (January–August) Precipitation
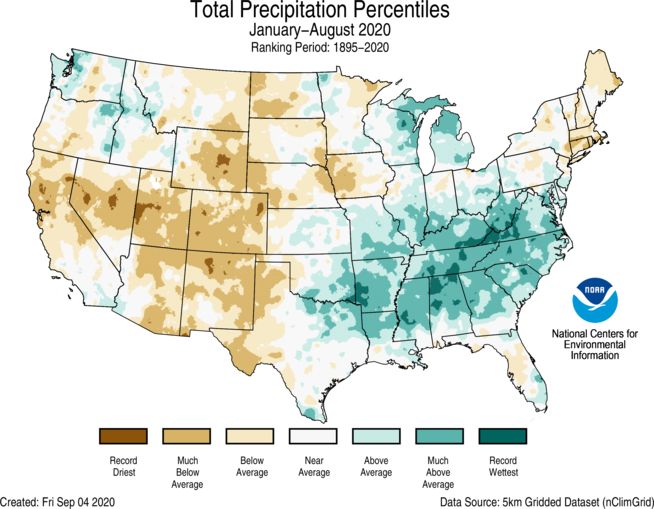
- Above- to much-above-average January-August precipitation occurred in portions of the Northwest and from the Great Lakes to the Gulf Coast and from the central Plains to the mid-Atlantic region. Tennessee and Virginia ranked second wettest for this year-to-date period with Alabama ranking third wettest.
- Drier-than-average conditions occurred from the West Coast to the Rockies and into portions of the Plains as well as across parts of New England. Colorado ranked third driest while Utah ranked fourth driest for this year-to-date period.
- For Alaska, January-August precipitation was lower than average across the western North Slope and northern West Coast as well as the Aleutians and central Gulf Coast. Above-average precipitation was observed across parts of the southern West Coast, Bristol Bay, eastern Interior regions and the Panhandle.
Here is more information on the current western wildfires:
Here is more climate and weather news from Thursday:
(As usual, this will be a fluid post in which more information gets added during the day as it crosses my radar, crediting all who have put it on-line. Items will be archived on this site for posterity. In most instances click on the pictures of each tweet to see each article. The most noteworthy items will be listed first.)
Now here are some of today’s articles and notes on the horrid COVID-19 pandemic:
(If you like these posts and my work please contribute via the PayPal widget, which has recently been added to this site. Thanks in advance for any support.)
Guy Walton “The Climate Guy”