The main purpose of this ongoing blog will be to track United States extreme or record temperatures related to climate change. Any reports I see of ETs will be listed below the main topic of the day. I’ll refer to extreme or record temperatures as ETs (not extraterrestrials).😉
Main Topic: Alarmingly Reaching the 50% Above Preindustrial Level For CO2 This Year
Dear Diary. As we all know, numbers and statistics can have significant meaning. Most of us realize that a doubling of carbon dioxide concentration above preindustrial would be game over for our climate, with civilization as we know it not able to withstand a withering assault due to rising seas and wicked levels of heat and drought. I suspect that civilization’s existence will be threatened long before the 556 parts per million level is reached, which would be a doubling of 278 ppm, where we started before widespread use of coal jump started our modern world beginning in the 19th century.
This year it is expected that we will reach half that level or 50% above preindustrial conditions, or 417 ppm. For details on this landmark here is a Desdemona Despair article:
January 9, 2021
Atmospheric carbon dioxide to pass iconic threshold in 2021 – “Emissions have now returned almost to pre-pandemic levels … The human-caused build-up of CO2 in the atmosphere is accelerating”
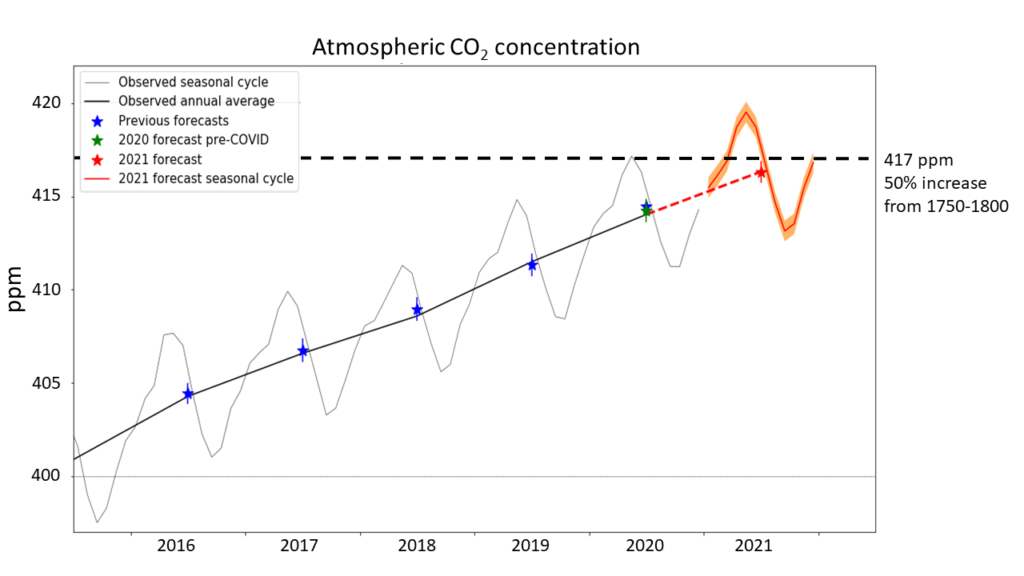
Forecast CO2 concentrations at the Mauna Loa observatory for the year 2021, showing monthly (red curve) and annual (red star) values. The orange band and vertical red line shows the forecast uncertainty ranges. The thin and thick black curves show the observed monthly and annual average concentrations respectively. Blue stars and blue lines show previous forecast annual averages and their uncertainties, with the 2020 value being the original 2020 forecast issued before the impact of the pandemic on emissions was known. The green star and green line shows the updated 2020 forecast and its uncertainty, issued followed the reduction in global CO2 emissions due to the Covid-19 pandemic. Graphic: Met Office
By Grahame Madge
8 January 2021
(Met Office) – In 2021, carbon dioxide in the atmosphere will reach levels 50% higher than before the industrial revolution, due to human-caused emissions, says a Met Office forecast.
The Met Office predicts that annual average CO2 concentration at Mauna Loa Observatory, Hawaii, will be 2.29 ± 0.55 parts per million (ppm) higher in 2021 than in 2020. This rise is driven by emissions from fossil fuel burning and deforestation, but will be slightly smaller than usual due to a temporary strengthening of natural carbon sinks. Weather patterns linked to the current La Niña event are expected to promote a temporary burst of growth in tropical forests that soak up some of humanity’s emissions.
Despite these La Niña-related effects, CO2 will still continue to build up in the atmosphere, and will exceed 417 ppm for several weeks from April to June. This is 50% higher than the level of 278 ppm in the late Eighteenth Century when widespread industrial activity began.
As usual, the annual peak – at new record levels in May – will be followed by a temporary fall in concentrations as ecosystems take up CO2 during the northern hemisphere growing season – but from September onwards the CO2 will continue to rise again. The annual average CO2 concentration will be 416.3 ± 0.6 ppm.
Professor Richard Betts MBE, who leads the production of the Met Office’s annual CO2 forecast, said: “Since CO2 stays in the atmosphere for a very long time, each year’s emissions add to those from previous years and cause the amount of CO2 in the atmosphere to keep increasing. Although the Covid-19 pandemic meant that 7% less CO2 was emitted worldwide in 2020 than in previous years, that still added to the ongoing build-up in the atmosphere. Emissions have now returned almost to pre-pandemic levels, but their effect this year will be partly dampened for a while by the stronger natural sinks due to the La Niña.”
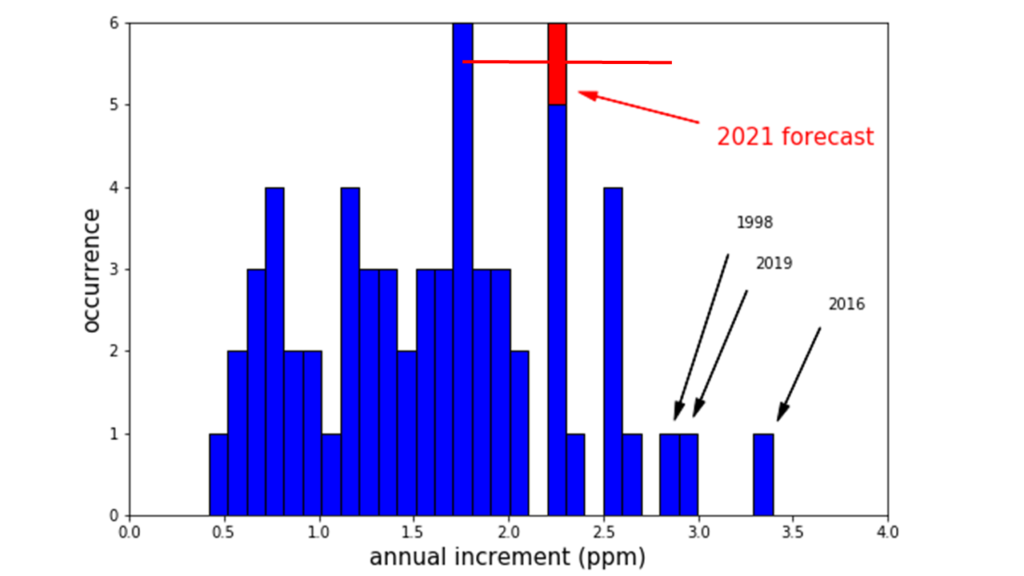
The central estimate of the CO2 rise forecast for 2020-2021 in the context of the frequency distribution of the observed annual rise for each year in the Mauna Loa record. The horizontal red bar shows the forecast uncertainty range of ± 0.55 ppm. Graphic: Met Office
Mauna Loa Observatory in Hawaii is the site of the longest-running continuous record of atmospheric CO2 concentrations, which were begun in 1958 by David Keeling.
The iconic ‘Keeling Curve’ graph is a potent symbol of humanity’s accelerating impact on the global climate system. CO2 concentrations in the Keeling Curve record first reached 348 ppm, 25% above pre-industrial levels, in 1986.
Professor Betts added: “The human-caused build-up of CO2 in the atmosphere is accelerating. It took over 200 years for levels to increase by 25%, but now just over 30 years later we are approaching a 50% increase. Reversing this trend and slowing the atmospheric CO2 rise will need global emissions to reduce, and bringing them to a halt will need global emissions to be brought down to net zero. This needs to happen within about the next 30 years if global warming is to be limited to 1.5°C.”
The Met Office has been issuing annual forecasts of the CO2 at Mauna Loa since 2016, and has successfully predicted the influence of year-to-year changes in natural carbon sinks on the rate of CO2 rise. In 2020, once it became clear that the pandemic would cause a temporary dip in emissions, the impact of this on the CO2 rise was also successfully predicted.
The Met Office carbon dioxide forecast for 2021 can be found here.
Atmospheric carbon dioxide to pass iconic threshold
Will we as a species finally level off the Keeling Curve? Find out as we move through the 2020s in thus blog.
Here are some chilly Spanish “ET’s” from Tuesday:
Here is more climate and weather news from Tuesday:
(As usual, this will be a fluid post in which more information gets added during the day as it crosses my radar, crediting all who have put it on-line. Items will be archived on this site for posterity. In most instances click on the pictures of each tweet to see each article. The most noteworthy items will be listed first.)
Now here are some of today’s articles and notes on the horrid COVID-19 pandemic:
(If you like these posts and my work please contribute via the PayPal widget, which has recently been added to this site. Thanks in advance for any support.)
Guy Walton “The Climate Guy”
One thought on “Extreme Temperature Diary- Tuesday January 12th, 2021/ Main Topic: Alarmingly Reaching the 50% Above Preindustrial Level For CO2 This Year”