The main purpose of this ongoing blog will be to track planetary extreme or record temperatures related to climate change. Any reports I see of ETs will be listed below the main topic of the day. I’ll refer to extreme or record temperatures as ETs (not extraterrestrials).😉
Main Topic: Early August Record Scoreboard And Climatological Review
Dear Diary. It’s time once again for our monthly climatological review. Here on this site we present monthly summaries near the 8th of each month, and each is available if you want to go back through my Extreme Temperature Diary archive. Today a big IPCC report came out indicating that time is short to avert the worst of the climate crisis. Below our monthly summary I’ve posted plenty of must read article links on that. This report will be added to our climate summary and record scoreboard category on this site for these posts, where you can check out reviews and statistics from prior months:
https://guyonclimate.com/category/record-scoreboard-climatological-reviews/
I’m repeating my mantra from prior months:
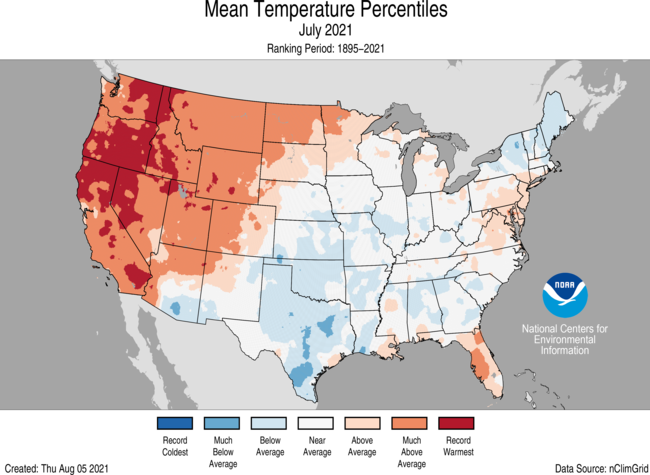
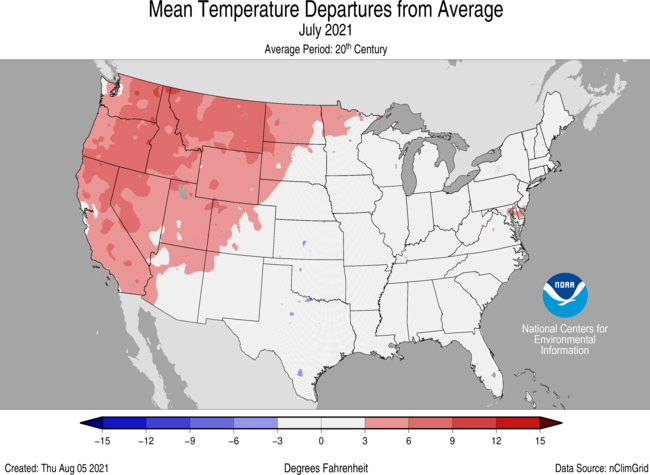
July 2021 got ranked by the National Center for Environmental Information as 13th warmest, temperature wise, for the lower 48 states, coming in as the number 13 warmest or 115th coldest since records began being kept in 1895:
https://www.ncei.noaa.gov/news/national-climate-202107
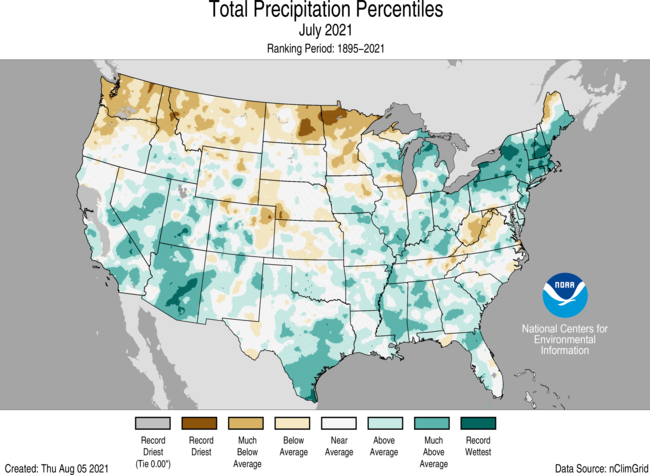
Just like in June several western states had their warmest July in recorded history. Also the coolest area was the south-central states. For a change northern New England was cooler than average.

Here are my two U.S. Daily Record Scoreboards updated through 7/09/2021 (data compiled from the following NCEI site):
https://www.ncdc.noaa.gov/cdo-web/datatools/records


DHMX= Daily High Max Reports. DLMN= Daily Low Min Reports. DHMN= Daily High Min Reports. DLMX=Daily Low Max Reports.
For these data sets all monthly ratios of > 10 to 1 DHMX to DLMN or > 10 to 1 DLMN to DHMX are in bold type. The rankings are for the lower 48 states with the warmest ranking since 1895 of average temperatures being 126 and 1 being the coldest as of 2021. Blue colors represent cold months and red warm. Those months and years with counts close to a 1 to 1 ratio of highs to lows are colored black. Boldly colored months, such as June 2021, have ratios of more than 10 to 1 daily record highs to lows or lows to highs, and are either historically hot or cold, most of which have made news.
July 2021 had approximately an 7.0-1 ratio of record DHMX to DLMN individual record counts, so the color I used for this month was red on the top chart.
July 2021 had approximately a 3.6-1 ratio of record DHMN to DLMX individual record counts, so the color I used for this month was red on the bottom chart.
Due to climate change we are seeing less blue colors on these Record Scoreboards with time, and July 2021 certainly fit this trend.
As stated, the ranking for July 2021 was 115, which was colored red. I color rankings +10 or -10 from the average ranking of 63 black, indicating that these are near average temperature wise. Record statistics matched up well with the ranking of 115 for July 2021.
As shown on both charts, we can see that August 2021 has gotten off to a warm start, and warmer than average conditions should continue for much of the month for most of the lower 48 states looking at meteorological models. Also, summer 2021 is the hottest summer on record, so far. We’ll see if this summer retains that top ranking around the 8th of September when NCEI has processed all of its data.
Brief summary for July 2021: Most reports of record warmth came from two more heatwaves, Gamma and Delta. A Southwest Heatwave Gamma was particularly historic during the middle of the month. Delta occurred east of the Rockies south of the Upper Midwest late in the month. Most record chill was sporadically reported from the Midwest into the Northwest.
Here is much more detailed July 2021 U.S. climatology as complied by NOAA:
https://www.ncei.noaa.gov/news/national-climate-202107
Home
News
Assessing the U.S. Climate in July 2021
Extreme heat, ongoing drought and wildfires plague much of the western contiguous U.S. during July
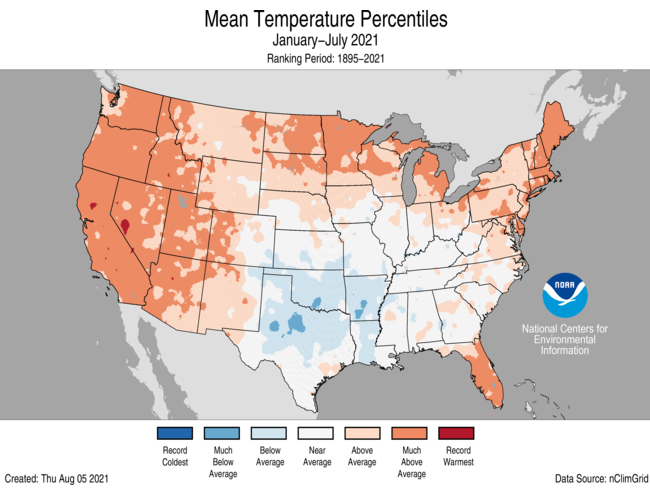
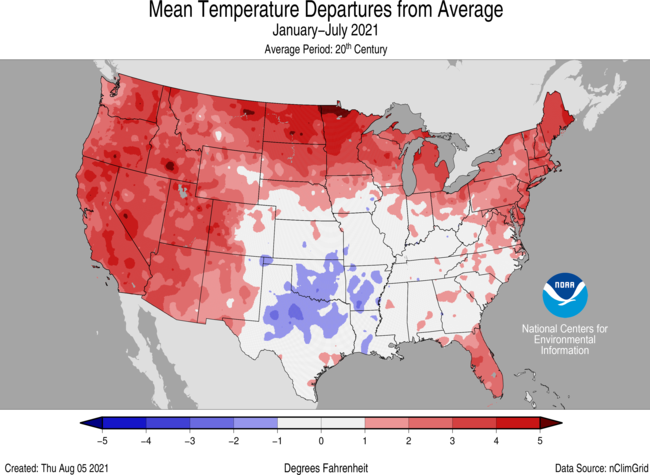
The July 2021 contiguous U.S. temperature was 75.5°F, 1.9°F above the 20th-century average, tying with 1954 and 2003 for 13th warmest in the 127-year record. For the year-to-date, the national temperature was 53.0°F, 1.8°F above average, ranking 14th warmest on record.
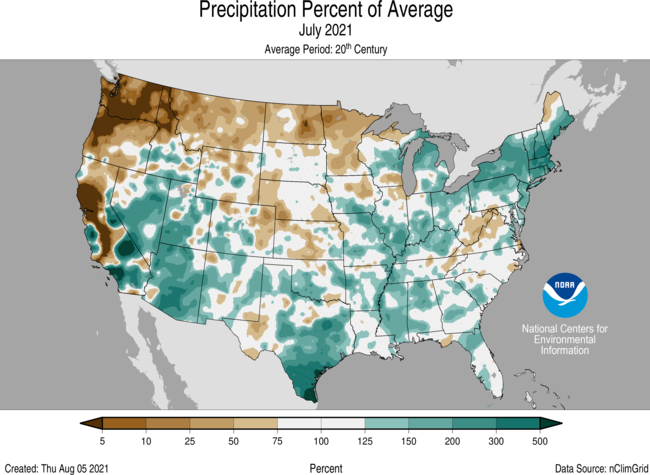
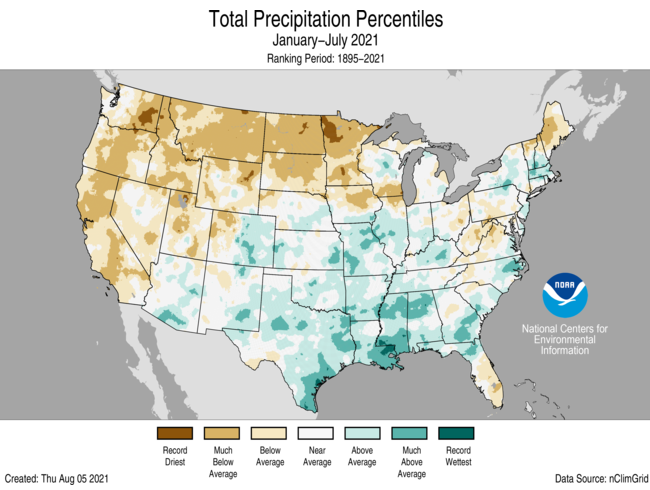
The July precipitation total for the contiguous U.S. was 3.36 inches, 0.58 inch above average, and sixth-wettest in the 127-year period of record. The year-to-date precipitation total for the Lower 48 was 18.00 inches, 0.09 inch below average, ranking in the middle one-third of the historical record.
This monthly summary from NOAA National Center for Environmental Information is part of the suite of climate services NOAA provides to government, business, academia, and the public to support informed decision-making.
July 2021
Temperature

- Temperatures were above average to record warm across the West, much of the northern Plains and portions of the mid-Atlantic and Southeast. Washington, Oregon, California and Nevada each had their warmest July on record with five additional states across the West and northern Plains having a top-10 warm month.
- Temperatures were below average across portions of the southern and central Plains, Midwest, Southeast and Northeast.
- A ridge of high pressure across the western U.S and a trough across the eastern U.S. for most of July kept the temperatures well-above average across the West and more moderate across the central and eastern states. This pattern remained in place for the duration of the month. An eastward shift in the ridge mid-month allowed the southwestern monsoon to kick off.
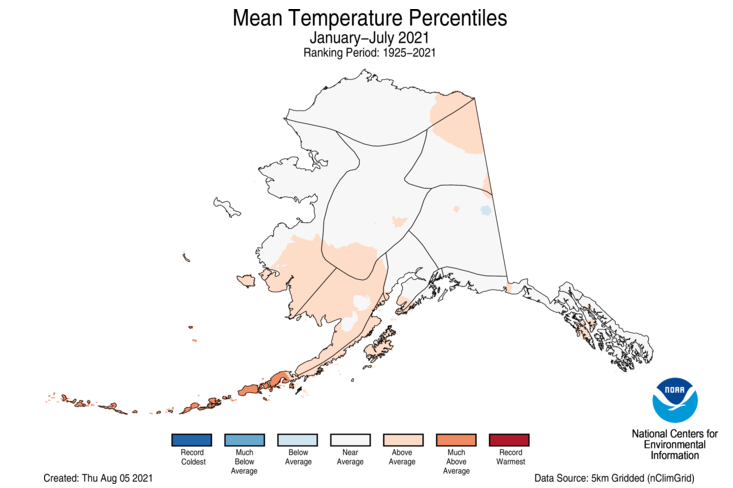
- The Alaska average July temperature was 53.7°F, 1.0°F above the long-term mean and ranked in the warmest third of the historical record for the state.
- Areas that experienced above-average precipitation across western Alaska during July also had temperatures that were below average.
- Above-average temperatures occurred across much of the eastern half of Alaska and across the Aleutians.
- The Alaskan wildfire season, to-date, is well-below average.
Precipitation

- Precipitation was above average across much of the Northeast, Southeast, and South; portions of the Midwest, Ohio Valley, and Great Lakes; and much of the Southwest. New York and Massachusetts had their wettest July on record with nine additional states across the Northeast, South and Southwest experiencing a top-10 wettest July.
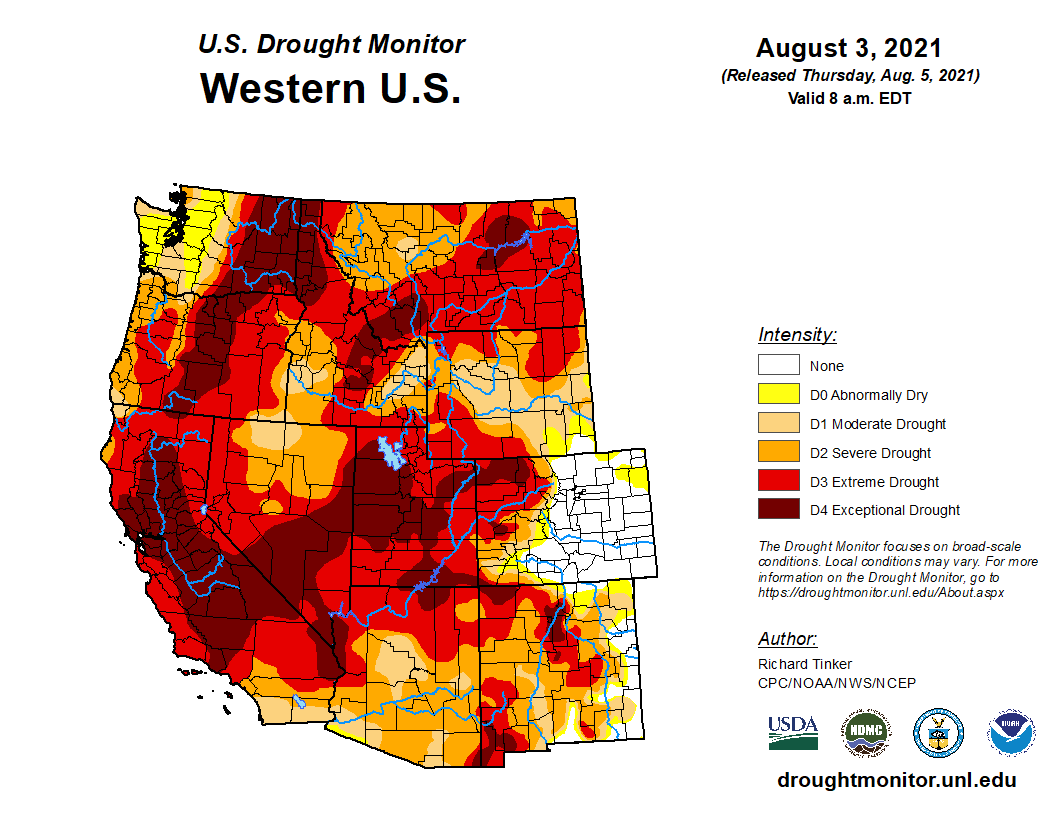
- The Southwest monsoon season began in earnest during the second half of July, bringing some rainfall to the drought-stricken region. Portions of Colorado, Nevada, New Mexico, Utah and Arizona saw some improvement in the drought intensity, but still remain entrenched in drought.
- Much of the West, particularly the Northwest, remained entrenched in exceptional drought conditions, which was reflected in very high wildfire activity throughout the month.
- Precipitation was below average across much of the Northwest, Northern Tier and portions of the central Plains, Midwest and central Appalachians. Minnesota ranked second driest while Washington ranked fourth driest.
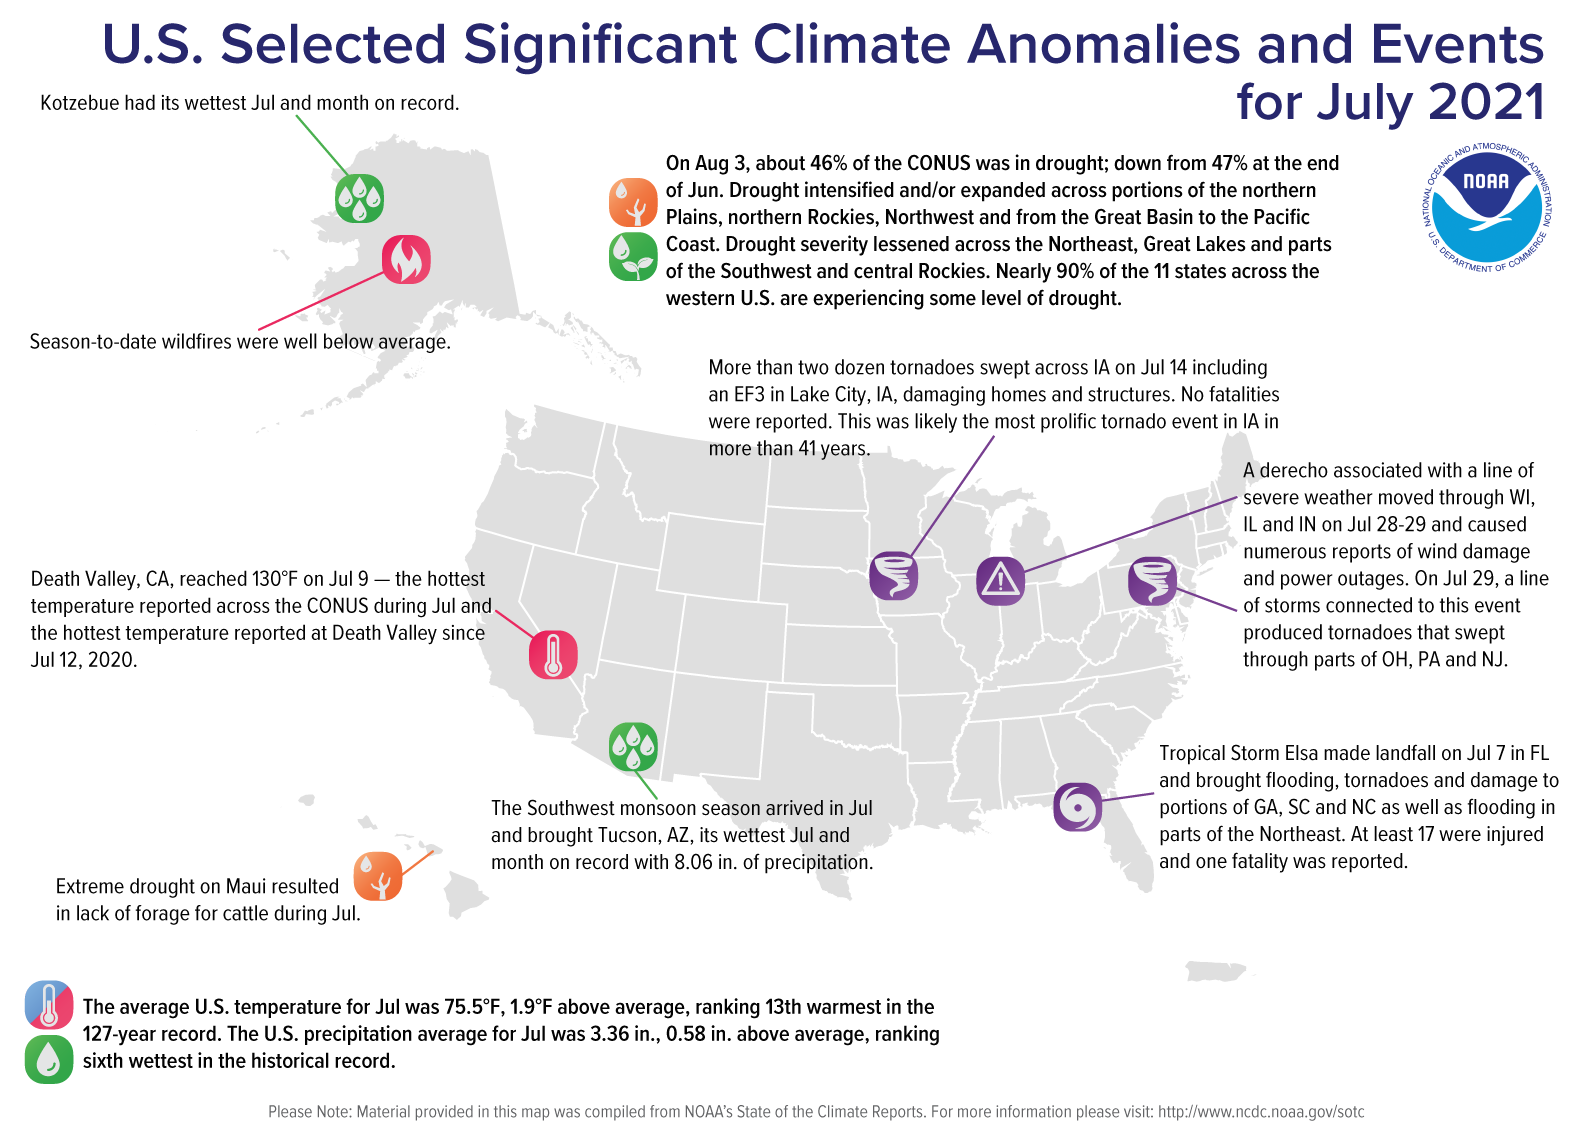
- Hurricane Elsa formed in the Atlantic Ocean in early July and made landfall in Cuba before reemerging in the Gulf of Mexico and making landfall as a tropical storm in Florida.
- Elsa brought flooding, tornadoes and damage to portions of Georgia and the Carolinas as well as flooding in parts of the Northeast. At least 17 were injured and one fatality was reported.
- Elsa was the earliest fifth-named storm on record.
- Alaska received near-average precipitation during July, but regional amounts varied greatly. Precipitation was above average across much of western Alaska and below average across eastern Alaska.
- Kotzebue had its wettest July and month on record while Nome and Bethel each had their wettest July since the 1920s.
- According to the August 3 U.S. Drought Monitor, approximately 46 percent of the contiguous U.S. was in drought, down from about 47 percent at the end of June. Drought intensified and/or expanded across portions of the northern Plains, northern Rockies, Northwest and from the Great Basin to the Pacific Coast. Drought also emerged across portions of Alaska and intensified across Maui in Hawaii. Drought severity lessened across the Northeast, Great Lakes and portions of the Southwest and central Rockies. Nearly 90 percent of the 11 states across the western U.S. are experiencing some level of drought.
Year-to-date (January–July 2021)
Temperature

- January-July temperatures were above average across the West, northern and central Plains, Great Lakes, Northeast, mid-Atlantic and portions of the Southeast. California, Oregon and Nevada each had their fourth-warmest year-to-date period on record with 11 additional states across the West, northern Plains, Northeast and Southeast experiencing a top-10 warmest January-July.
- Temperatures were below average across portions of the South.
- The Alaska statewide average temperature for this year-to-date period was 27.1°F, 1.3°F above average and ranked in the middle one-third of the record. Temperatures were above average across much of Bristol Bay, Northwest Gulf and the Aleutian regions with near-average temperatures present across much of the rest of the state.
Precipitation
Other Notable Events
- Wildfire activity exploded across the drought-stricken portions of the West, especially the Northwest, during July. As of July 31, 37,650 fires have burned through 2,982,960 acres during the first seven months of 2021. This is nearly 1 million more acres than were consumed by this time last year and about 1 million fewer acres burned than the 2011-2020 year-to-date average.
- With multiple large fires burning across the West, forecasts for worsening conditions and a potential shortage of resources, on July 14, the National Multi-Agency Coordination Group raised the national Preparedness Level (PL) to the highest category — level 5. This is the earliest PL5 issued in the past 10 years.
- As of July 31, the largest fire across the U.S., the Bootleg Fire, located in Oregon, has consumed more than 413,000 acres and was 56 percent contained.
- The second largest fire in the U.S., the Dixie Fire, located in northern California, burned more than 240,000 acres and was 24 percent contained.
- Heavy smoke from these and many other fires across the western U.S. and Canada contributed to low air quality across the U.S. during July.
For more detailed climate information, check out our comprehensive July 2021 U.S. Climate report scheduled for release on August 12, 2021.
Here is some more July 2021 climatology:
Here are some major “ET’s” reported on Monday:
IPCC information:
Here is more climate and weather news from Monday:
(As usual, this will be a fluid post in which more information gets added during the day as it crosses my radar, crediting all who have put it on-line. Items will be archived on this site for posterity. In most instances click on the pictures of each tweet to see each article. The most noteworthy items will be listed first.)
Now here are some of today’s articles and notes on the horrid COVID-19 pandemic:
(If you like these posts and my work please contribute via the PayPal widget, which has recently been added to this site. Thanks in advance for any support.)
Guy Walton “The Climate Guy”