The main purpose of this ongoing blog will be to track planetary extreme, or record temperatures related to climate change. Any reports I see of ETs will be listed below the main topic of the day. I’ll refer to extreme or record temperatures as ETs (not extraterrestrials).😉
Main Topic: U.S. September Record Scoreboard
Dear Diary. It’s time once again for our monthly climatological review. Here on this site, we present monthly summaries near the 8th of each month, and each is available if you want to go back through my Extreme Temperature Diary archive under my “Record Scoreboard Climatological Reviews” category (located on the upper left-hand corner of my home page).
https://guyonclimate.com/category/record-scoreboard-climatological-reviews/
I’m repeating this mantra every month:
*I have a very special although alarming finding for September 2022. For the first time since at least January 1890 there has been three consecutive months of greater than a 10 to 1 ratio of daily record high maxes to low minimums in the NCEI database. Here is my updated record scoreboard showing totals as is 10/07/2022*:

DHMX= Daily High Max Reports. DLMN= Daily Low Min Reports. DHMN= Daily High Min Reports. DLMX=Daily Low Max Reports.
The rankings are for the lower 48 states with the warmest ranking since 1895 of average temperatures being 128 (or 127 for a tie) and 1 being the coldest as of 2021. Blue colors represent cold months and red warm. Those months and years with counts close to a 1 to 1 ratio of highs to lows are colored black. Boldly red-, blue-, or purple-colored months, such as January 2020 and June 2021, have ratios of >10 to 1 daily record highs to lows or <1 to 10 daily record highs to lows, and are either historically hot or cold, most of which have made news. All-time record hot or cold ranked months are highlighted in purple.
September 2022 using 1901-2000 mean data got ranked by the National Center for Environmental Information for the lower 48 states as 5th warmest, or 124th coolest since records began being kept in 1895 (and indeed as previously expected suspected weeks ago, coming in as a top 10 warmest September:
https://www.ncdc.noaa.gov/cag/national/rankings
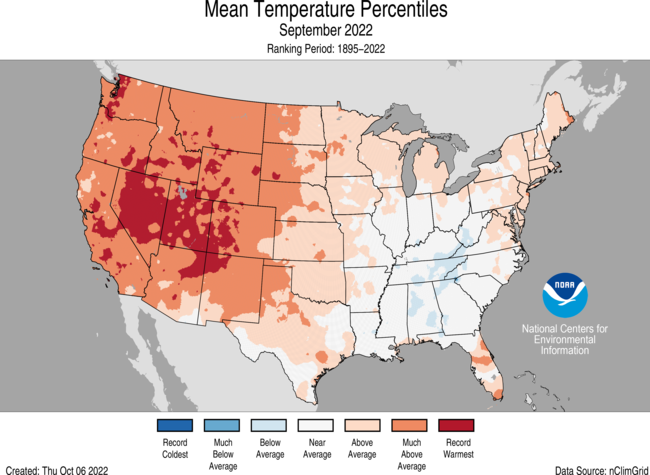
Well above average temperatures were experienced everywhere except in the Southeast and portions of the southern Midwest. There were no below average states. Nevada and Utah had their hottest September on record:

Brief summary for September 2022: Most reports of record heat came from the West concurrent with a historic drought. There was a historic heat episode in the West early in September that I dubbed Heatwave Falkor, which produced most of the record numbers. Sporadic reports of record chill came from every corner of the nation.
Here are my two U.S. Daily Record Scoreboards updated through 9/05/2022 (data compiled from the following NCEI site):
https://www.ncdc.noaa.gov/cdo-web/datatools/records


Record numbers statistically matched up well during September of 2022 with that month being the 5th warmest September on record.
September 2022 had approximately a 25 to 1 ratio of record DHMX to DLMN individual record counts, so the color I used for this month was bold red on the top chart.
September 2022 had approximately a 10 to 1 ratio of record DHMN to DLMX individual record counts, so the color I used for this month was bold red on the bottom chart.
Due to climate change, we are seeing fewer blue colors on these Record Scoreboards with time, and September 2022 added to this trend.
As stated, the ranking for September 2022 was 124, which was colored red since it was well above average.
I color rankings of +20 or -20 from the average ranking of 64 black, indicating that these are near average temperature wise. The top warmest ranking for 2022 would be 128 since rankings began in 1895.
October 2022 has gotten off to a warm start again across the West. I still seriously doubt that we will see an anomalously warm October similar to September 2022 looking at meteorological models, though. *We did indeed see three consecutive months (July to September 2022) of a > 10 to 1 ratio of DHMX to DLMN records for the first time since January 1890 in the NCEI database as speculated on my report for August.*
Here is much more detailed climatology for September 2022 as complied by NOAA:
https://www.ncei.noaa.gov/news/national-climate-202209
Assessing the U.S. Climate in September 2022
Fifth-warmest September on record; heatwave brought record temperatures to the West

Courtesy of Getty Images
PUBLISHED
OCTOBER 11, 2022
Key Points:
- The average temperature of the contiguous U.S. in September was 68.1°F, which is 3.2°F above average, ranking fifth warmest in the 128-year record. Generally temperatures were above average in the Great Lakes to Northeast with record warmth across much of the West.
- September precipitationfor the contiguous U.S. was 1.83 inches, 0.66 inch below average, ranking 10th driest on record.Precipitationwas above average across the Northeast, Florida, and much of the central Rockies to California. Precipitation was below average across the Pacific Northwest, Plains to Mississippi Valley, Great Lakes and parts of the Southeast.
- The U.S. has experienced 15 weather and climate disasters each incurring losses that exceeded $1 billion this year. This is also a record eighth-consecutive year where the U.S. experienced 10 or more billion-dollar disasters.
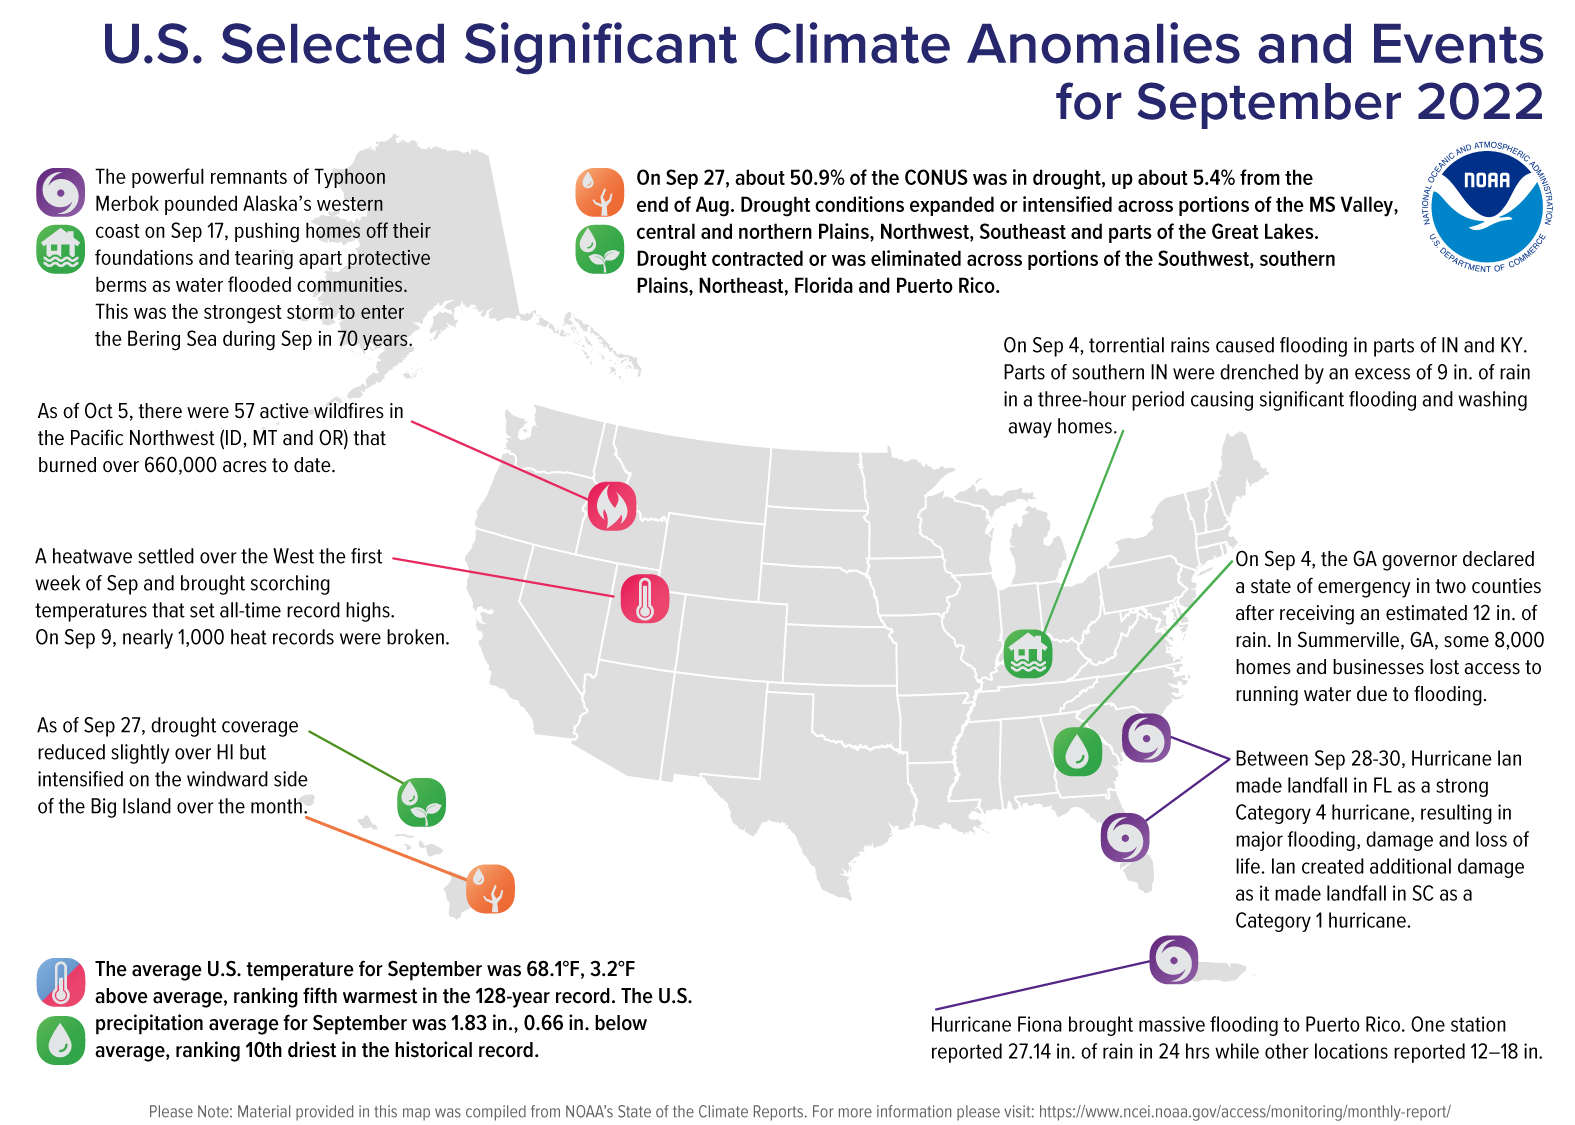
- Hurricane Ian made landfall in Florida on September 28 as a strong Category 4 hurricane resulting in major flooding, damage and loss of life. Ian created additional damage as it made landfall in South Carolina as a Category 1 hurricane.
- Hurricane Fiona brought massive flooding and structural damage to Puerto Rico on September 18, with some areas receiving 12-18 inches of rain.
- Remnants of Typhoon Merbok pounded Alaska’s western coast on September 17, becoming the strongest storm to enter the Bering Sea during September in 70 years.
- In early September, nearly 1,000 heat records were broken over the western United States.
- According to the September 27U.S. Drought Monitor report, about 50.9% of the contiguous United States was in drought. Severe to exceptional drought was widespread from the Great Basin to the Pacific Coast, across portions of the Great Plains, and in Hawaii, with moderate to severe drought in parts of the Northeast.
Other Highlights:
Temperature

For the month of September, Nevada and Utah ranked warmest on record. In addition to this record warmth, near-record temperatures were widespread across the West. California, Idaho, Wyoming and Arizona each had their second warmest September, with four additional states experiencing a top-five warmest September on record.
For the July-September period, the average contiguous U.S. temperature was 73.0°F, 2.8°F above average, ranking as warmest on record for this 3-month period. Temperatures were above average across most of the contiguous U.S. with record warmth blanketing much of the West. California, Nevada, Oregon, Washington, Idaho, Montana, Wyoming, Colorado and Utah each had their warmest July-September period on record. Seven additional states experienced a top-five warmest event for this three-month period.
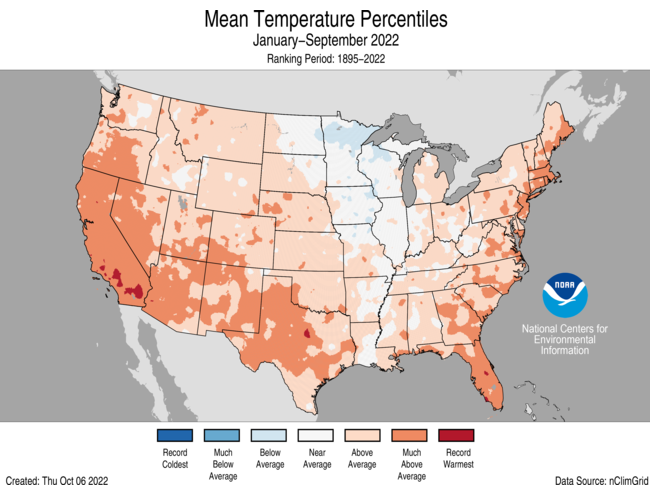
For the January-September period, the average contiguous U.S. temperature was 56.8°F, 1.7°F above average, ranking in the warmest third of the record. Temperatures were above average from the West Coast to the Gulf Coast and from the Gulf to New England. California ranked third warmest and Florida ranked fourth warmest on record for this period. Temperatures were near average across parts of the Upper Midwest and northern Plains.
The Alaska statewide September temperature was 43.0°F, 2.4°F above the long-term average. This ranked in the warmest third of the 98-year period of record for the state.Temperatureswere above average across much of the state with portions of southwest Alaska experiencing near-average conditions for the month.
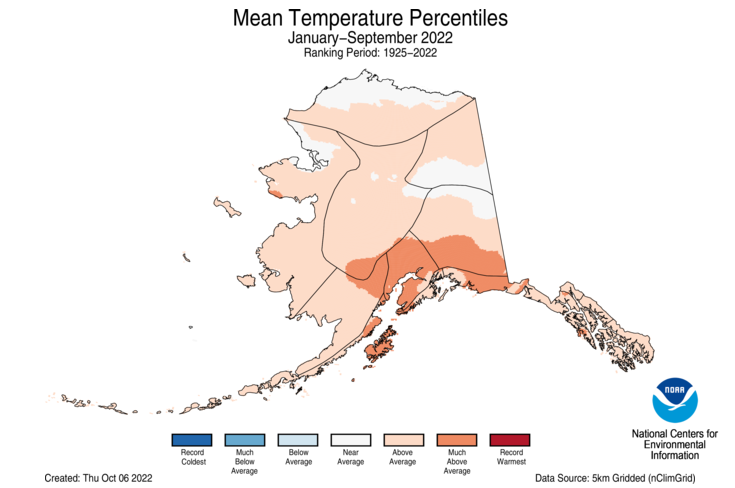
The Alaska January-September temperature was 32.6°F, 2.5°F above the long-term average, ranking in the warmest third of the record for the state. Above-average temperatures were observed across much of the state with portions of the North Slope and eastern interior regions experiencing near-average conditions for this nine-month period.
Precipitation

Dry conditions across the central U.S. resulted in Oklahoma ranking fifth driest while Mississippi had its eighth-driest September on record. Arkansas, Missouri and South Dakota each had their 10th driest September on record. No state experienced a top-10 wettest September.
The January-September precipitation total for the contiguous U.S. was 21.53 inches, 1.67 inches below average, ranking in the driest third of the historical record. Precipitation was above average across parts of the Northeast, Appalachian Mountains, Ohio and Tennessee River valleys, lower Mississippi Valley, and parts of the Great Lakes, Southwest and Northwest. Precipitation was below average across much of the West, central and southern Plains and parts of the East Coast during the January-September period. California ranked driest on record while Nebraska ranked sixth driest and Texas ranked eighth driest for this nine-month period.

Monthly precipitation averaged across the state of Alaska was 6.76 inches, 2.19 inches above average, ranking as the third-wettest September in the 98-year record. Much of the state was wetter-than-average, with portions of the Aleutians and lower Panhandle experiencing near-average conditions during the month.
The January-September precipitation ranked wettest on record for Alaska, with above-average precipitation observed across all but the northeast Interior and Aleutian regions.
Other Notable Events
September had several notable storms that brought destruction and flooding to portions of the United States and its territories:
- On September 9, Tropical Storm Kay impacted California with gusty winds and heavy rains causing mudslides.
- The powerful remnants of Typhoon Merbok pounded Alaska’s western coast on September 17, pushing homes off their foundations and tearing apart protective berms as water flooded communities. This was the strongest storm to enter the Bering Sea during September in 70 years.
- On September 18, Hurricane Fiona brought massive flooding to Puerto Rico with some areas receiving 12-18 inches of rain. One station reported 27.14 inches of rain in a 24-hour period.
- Hurricane Ian, with 150 mph sustained winds, made landfall in southwest Florida as a strong Category 4 hurricane on September 28, resulting in major flooding, damage and loss of life.
- On September 30, Ian, with 85 mph sustained winds, created additional damage as it made landfall in South Carolina as a Category 1 hurricane.
A heatwave settled over the West the first week of September and brought scorching temperatures that set all-time record highs. By September 9, nearly 1,000 heat records were broken.
As of October 5, there were 57 active wildfires in the Pacific Northwest (Idaho, Montana and Oregon) that burned over 660,000 acres to date across the region.
Drought
According to the September 27 U.S. Drought Monitor report, about 50.9 percent of the contiguous United States was in drought, up about 5.4 percent from the end of August. Drought conditions expanded or intensified across portions of the Mississippi Valley, central and northern Plains, Northwest, Southeast and parts of the Great Lakes. Drought contracted or was eliminated across portions of the Southwest, southern Plains, Northeast and Puerto Rico.
Billion-Dollar Weather and Climate Disasters

From January through the end of September, the U.S. experienced 15 weather and climate disasters each incurring losses that exceeded $1 billion. These disasters included: 10 severe storms, two tropical cyclones, one flooding event, one combined drought and heat wave and one regional wildfire event.
Six new events have been added since the mid-year update including: Hurricanes Ian and Fiona, the Western wildfires, the Kentucky/Missouri flooding and two severe storm events.
The loss of human life this year from these disaster events exceeds 340 people, with assessments ongoing due to recent hurricane impacts in Florida and Puerto Rico. There were more than 100 lives lost in both Hurricane Ian and from the summer heatwaves in the Western U.S.
Total loss due to property and infrastructure damage to-date is up to $29.3 billion—but this does not yet include the costs for Hurricane Ian, the Western Wildfires and Hurricane Fiona, which may push the 2022 total closer to $100 billion, a total reached in four of the last five years.
This is also a record eighth-consecutive year where the U.S. experienced 10 or more billion-dollar disasters.
The U.S. has sustained 338 weather and climate disasters since 1980 where overall damages/costs reached or exceeded $1 billion (including CPI adjustment to 2022). The total cost of these 338 events exceeds $2.295 trillion.
Monthly Outlook
According to the September 30 One-Month Outlook from the Climate Prediction Center, much of the contiguous U.S. from Florida to the West Coast, as well as much of Alaska, have the greatest chance of seeing above-normal monthly temperatures in October, whereas the greatest chance for below-normal temperatures is projected to occur across portions of the Mid-Atlantic. Portions of the Southwest, Mid-Atlantic and Alaska are projected to have the greatest chance of above-normal monthly total precipitation, while the greatest chance for below-normal precipitation is favored to occur from the Gulf of Mexico to the northern Plains and into New England. Drought is likely to persist across much of the West, central Plains and Hawaii with some improvement and/or drought removal likely along the Mid-Atlantic coastline. Drought development is likely from the southern Plains to the southern Mississippi Valley, as well as across portions of the central and northern Plains.
According to the One-Month Outlook issued on October 1 from the National Interagency Fire Center, southwest California, Hawaii and portions of the southern Plains and Mississippi Valley have above normal significant wildland fire potential during October.
This monthly summary from NOAA National Centers for Environmental Information is part of the suite of climate services NOAA provides to government, business, academia and the public to support informed decision-making. For more detailed climate information, check out our comprehensive September 2022 U.S. Climate Report scheduled for release on October 13, 2022.
Here are some “ET’s” recorded from around the planet the last couple of days, their consequences, and some extreme temperature outlooks:
Here is some more September 2022 climatology:
Here is more climate and weather news from Tuesday:
(As usual, this will be a fluid post in which more information gets added during the day as it crosses my radar, crediting all who have put it on-line. Items will be archived on this site for posterity. In most instances click on the pictures of each tweet to see each article. The most noteworthy items will be listed first.)
If you like these posts and my work please contribute via the PayPal widget, which has recently been added to this site. Thanks in advance for any support.)
Guy Walton “The Climate Guy”