The main purpose of this ongoing blog will be to track planetary extreme, or record temperatures related to climate change. Any reports I see of ETs will be listed below the main topic of the day. I’ll refer to extreme or record temperatures as ETs (not extraterrestrials).😉
Main Topic: More Weather Whiplash…California from Drought to Deluge
Dear Diary. It’s high time that I address more awful weather occurring in California, which to my mind has been the hardest state hit by climate change since I started this blog in 2017. Incidentally, Texas then Florida and Louisiana would be a close second, third and fourth due to hurricanes. The news isn’t all bad here because California’s drought appears to be getting a very big dent. Agricultural interests across the state should be getting a big break during 2023 because of great water runoff from the Sierra Mountains, which are getting pummeled with much needed snow. Seasonal forecasters were predicting another dry winter due to a triple La Niña, and I’m delighted to report that they were wrong.
So, how has climate change affected the cycle of going from dry years to wet across California? It’s troubling that we see so much extremity in this cycle, going from very dry to destructively wet over the past decade. Today we will address why when California does go through a wet cycle, it gets extraordinarily wet.
I received an Email yesterday from Joe Witt of NASA concerning atmospheric rivers stating:
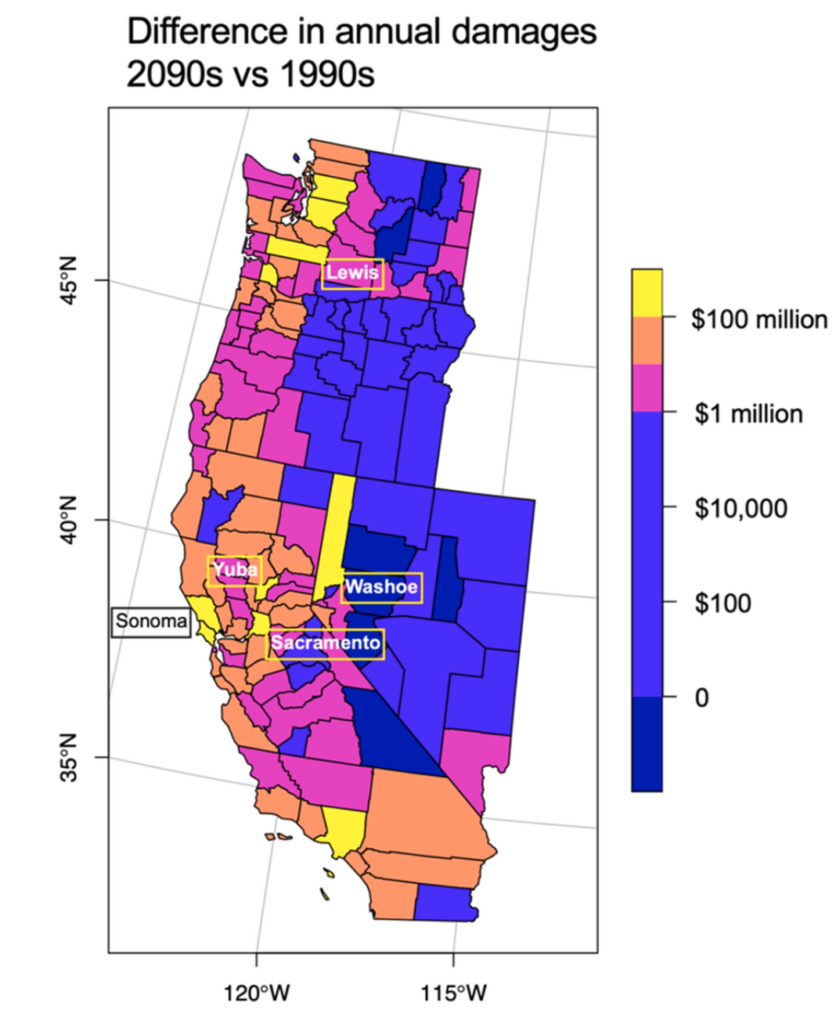
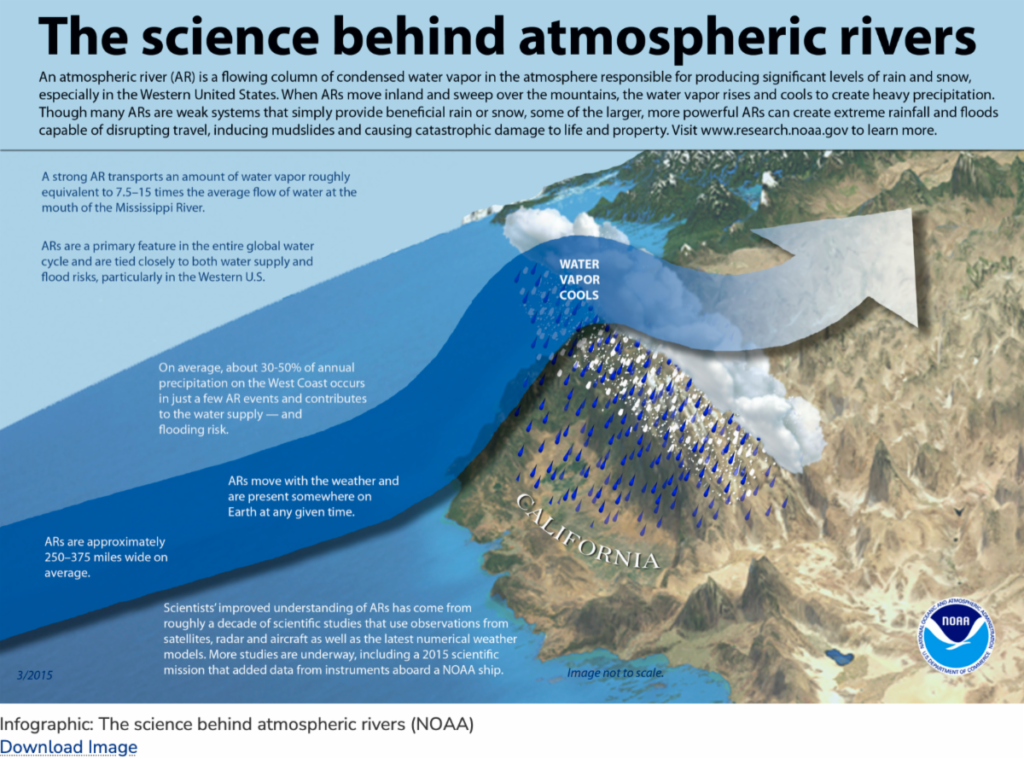
Atmospheric Rivers & Climate Change
Flood damages due to ARs may triple by 2100 under RCP8.5 (1200 ppm CO2, +5C) scenario (“business as usual”)
From $1B to over $3 B
RCP4.5 (550 ppm CO2, +3C) results in a doubling of damages: $1B to over $2B.
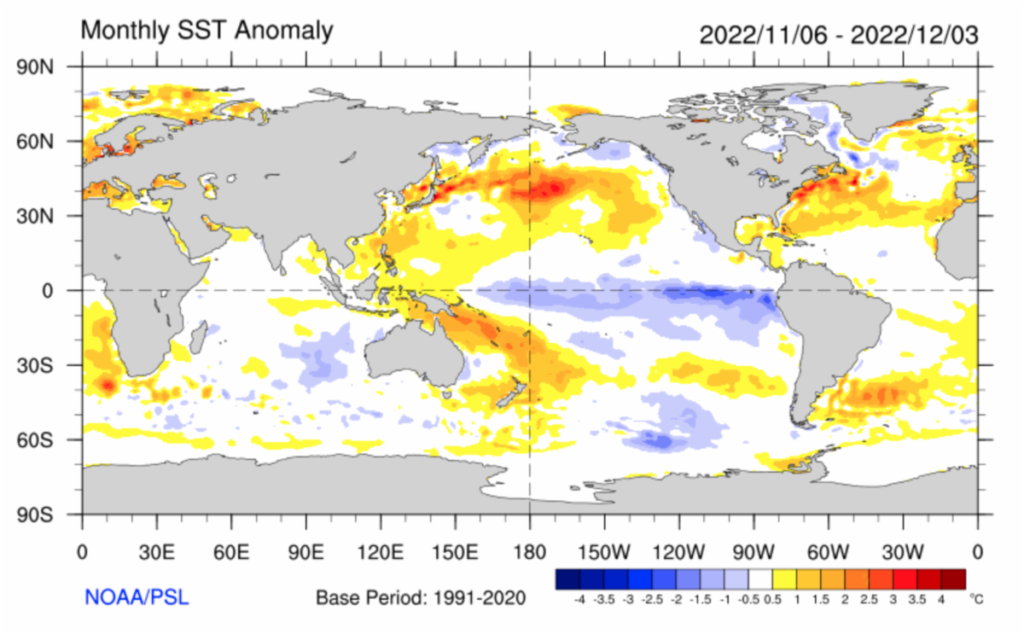
A warmer Pacific Ocean ( see image below of current sea surface temperature anomaly) means more evaporation, and a warmer atmosphere means the air over the Pacific holds more moisture. When this river of water vapor is forced up the western slopes of the California mountains more rain and snow results. And more flooding.

“ARs provide beneficial contributions to water supplies in the mid latitudes, they also generate significant flooding. In the western United States over the past 40 years, ARs caused over
$1 billion a year in average estimated flood damages, accounting for 84% of total flood damages. Several billion-dollar flood events have been attributed to ARs, including the February 2017 storm that damaged the Oroville Dam in Northern California leading to the evacuation of over 180,000 people from the Feather River basin.
“Rising sea surface temperatures and increased vertically integrated horizontal vapor transport (IVT), ARs are projected to increase in intensity, a process which appears to have already started.
“In this study we build county-level AR-related flood damage projections based on 16 GCMs under the RCP8.5 “high emissions” scenario using statistical models that link damages to AR landfall characteristics using historical reanalysis data
“Forty years of flood insurance data from the National Flood Insurance Program (NFIP) linked to total direct damage estimates from the National Weather Service (NWS) and an observational catalogue of landfalling AR events were used to build statistical models of county-level flood damages as functions of characteristics of ARs at landfall from Baja California to British Columbia
“In a 14-model comparison of projected damages between the RCP4.5 and RCP8.5 scenarios… By the 2090s projected AR-related flood damages across the western United States are $2.3 billion under RCP4.5 and $3.2 billion under RCP8.5 (all damages are adjusted for inflation and reported in 2022 U.S. dollars).
| CW3E AR Update: 3 January 2023 Outlook This AR will be the first of 3 landfalling ARs over the next 7 days |
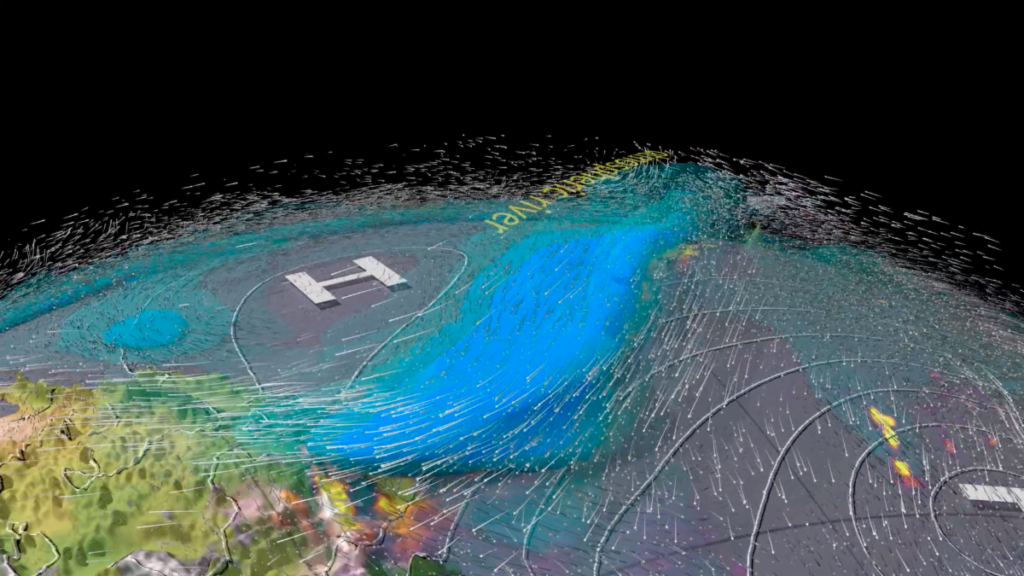
| BELOW: Atmospheric River EXPLAINER:Use parts of this just-released beautiful 4 minute HD visualization to help your viewers understand ARs: a squeeze play of with low level tropical moisture ( from thousands of miles away) squeezed between the Alaska Low and the California High. |
This is quite the statistic:
Here is a new writeup by my friend Bob Henson on what California has been experiencing over the last week:
More wind, rain, flooding ahead for storm-battered California » Yale Climate Connections
More wind, rain, flooding ahead for storm-battered California
At least two more intense cyclones expected to slam the state into next week.


by BOB HENSON and JEFF MASTERS JANUARY 4, 2023
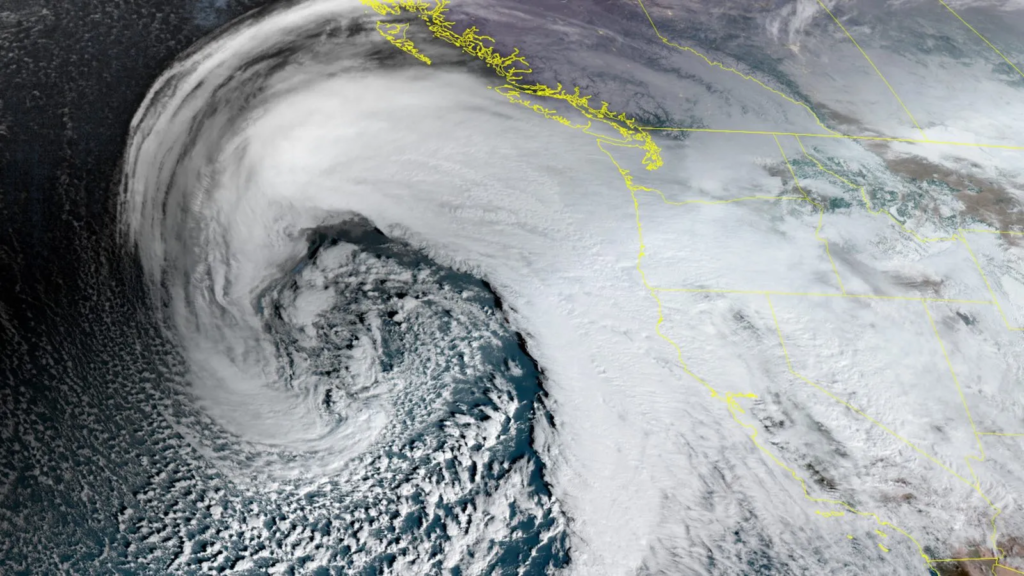
GeoColor satellite image of the powerful storm system off the California coast at 2050Z (3:50 p.m. EST) Wednesday, January 4, 2023. (Image credit: RAMMB/CIRA/CSU)
Aseries of Pacific storms that’s taken aim on California since late December is on track to continue into mid-January. Ferocious winds will slam much of the state on Wednesday and Thursday, accompanied by heavy rain likely to trigger widespread flash floods. After a brief break, at least two more potent systems are expected over the following week.
The driver of the relentless storminess is an exceptionally strong jet stream that extends across much of the Pacific at unusually low latitudes. Each major impulse along the jet stream has pulled tropical moisture northward and concentrated it into atmospheric rivers — the channels of moisture aloft that bring California some of its most intense rain and flood events.
On Wednesday, an approaching upper-level disturbance triggered a spectacular “bomb cyclone,” defined as a surface low that deepens by at least 24 millibars in 24 hours. With its central pressure dipping below 960 mb, the storm was one of the strongest on record over the North Pacific at latitudes below 40 degrees north. Most of its historical rivals are hurricanes rather than winter-type extratropical cyclones.
A sharp warm front spinning around the bomb cyclone was on track to bring an initial surge of rain into California on Wednesday night. On its heels, a strong cold front is predicted to bring even more rain and winds, gusting well over 40 mph inland and up to 50-70 mph in some coastal and mountain areas, likely toppling many trees and power lines. This storm is expected to be the season’s strongest to date in Southern California, including the Los Angeles area, where rainfall could total 2 to 4 inches.
National Weather Service offices across California stressed the manifold dangers of the Wednesday/Thursday storm. The NWS/Los Angeles office warned: “Wind damage to trees and large objects is likely. Many power outages are nearly certain and could be prolonged by the concurrent heavy rain.”
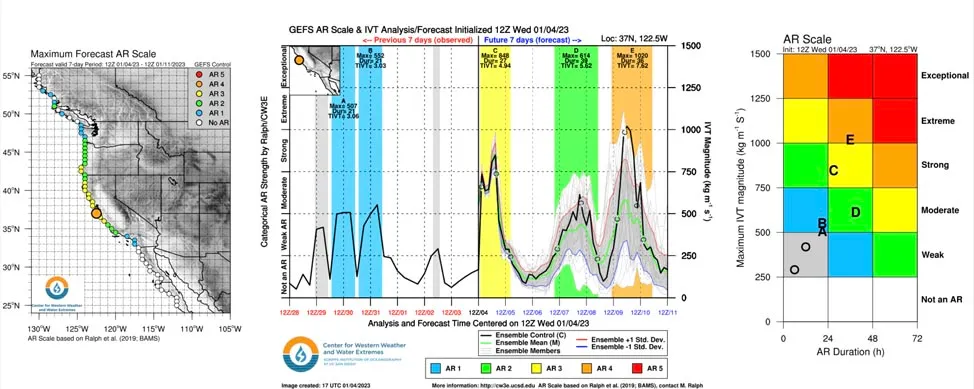
Figure 1. Multiple atmospheric rivers (ARs) have affected or will affect California from December 30, 2022, through at least January 11, 2023. The most intense atmospheric river for the San Francisco area (large orange dot in left image) is predicted to hit January 9-10. On the 1-5 atmospheric river scale, this is predicted to be at Level 4 (orange) in the Bay Area, with the January 4-5 atmospheric river predicted to be Level 3 (yellow) and the January 7-8 atmospheric river predicted to be at Level 2 (green). (Image credit: Center for Western Weather and Water Extremes)
As if this system wasn’t enough, forecast models have been consistent in predicting a somewhat weaker atmospheric river over the weekend, followed by another potential powerhouse next week (see Figure 1 above).
NWS/Sacramento noted: “The cumulative effect of the repeated rounds of moderate to heavy rain will lead to the potential for more widespread flooding with increasingly severe impacts.”
Some individual runs of the GFS and European models have spit out mind-boggling precipitation totals. Ensembles of these models, which are typically more reliable than any single run, haven’t been quite so hyperactive, but together they point toward an extended period of high-impact weather for much of California.
The Sierra Nevada could easily rack up three to five feet of snowfall over the next week, with even larger amounts atop mountain passes.
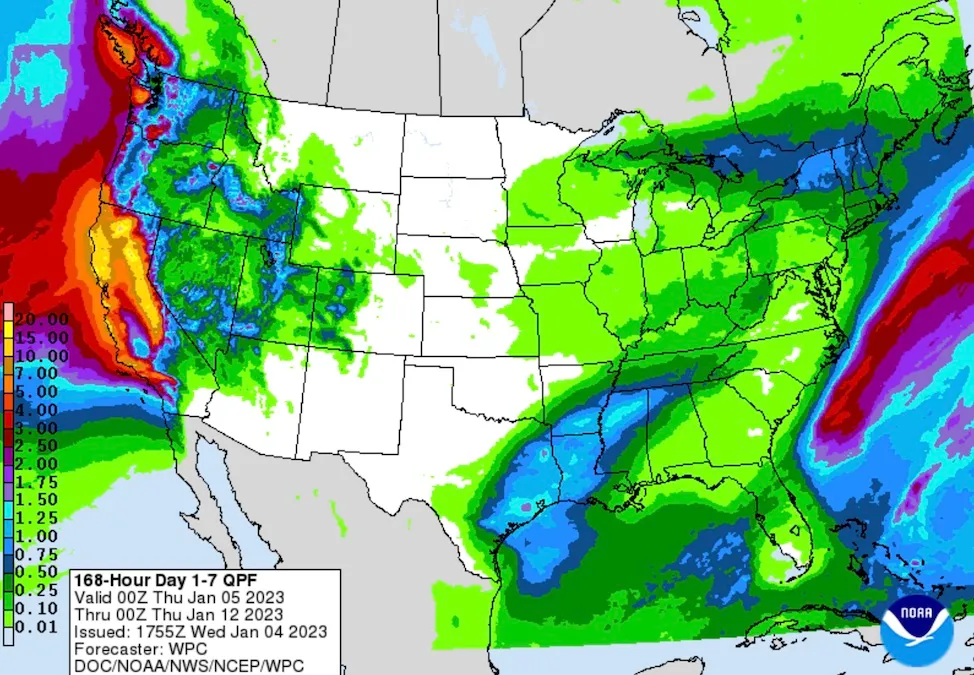
Figure 2. Precipitation forecast for the seven-day period starting at 8 a.m. EST Wednesday, January 4. (Image credit: NOAA/NWS/WPC)
Sierra snow survey hits the jackpot, but will the moisture peter out before spring?
The Sierra Nevada snowpack – which furnishes about 30% of the water used in California – showed a bountiful supply for the date as of Jan. 3. The Phillips Station benchmark site in the central Sierra reported 55.5 inches of snow depth and 17.5 inches of moisture. The moisture content was 177% of the long-term average for the snow season to date.
The bounty was shared well beyond Philips Station, as the statewide average snowpack was at 174% of average for the date.

Figure 3. Water levels in key California reservoirs as of January 3, 2023. (Image credit: California Department of Water Resources)
It’s been tough in recent years for the state to scare up a full winter’s worth of moisture, as California has been in the grip of a devastating 22-year drought that has cost billions of dollars and helped fuel record wildfire seasons
The trend toward “hot droughts” has made these long moisture-free periods even more worrisome, helping extend the wildfire season into months where fire was once uncommon. Thus, the rains of 2023 will bring welcome drought relief and are likely to prevent hundreds of millions of dollars of drought damages. Several reservoirs in the state have already gone above their average water levels for this point in the season (Figure 3), and additional liquid gold will fill the reservoirs in the coming weeks.
The ongoing series of storms will surely push January’s precipitation toward average for the month, and perhaps well beyond. But will the faucet keep running? In its Jan. 3 statement, the California Department of Natural Resources, which carries out the snow survey, noted: “This January’s results are similar to results in 2013 and 2022 when the January 1 snowpack was at or above average conditions, only for dry weather to set in and lead to drought conditions by the end of the water year (September 30).”
Unfortunately, the rains will bring costly flooding likely to cause hundreds of millions of dollars in damage. This whipsaw from damaging drought to damaging flooding is a particularly striking example of the exacerbation of precipitation extremes that a warming climate is likely to continue producing in an area naturally prone to weather whiplash, as documented by Daniel Swain and coauthors in a 2018 paper in Nature Climate Change, “Increasing precipitation volatility in twenty-first century California.”
Website visitors can comment on “Eye on the Storm” posts (see comments policy below). Sign up to receive notices of new postings here.
BOB HENSON
Bob Henson is a meteorologist and journalist based in Boulder, Colorado. He has written on weather and climate for the National Center for Atmospheric Research, Weather Underground, and many freelance… More by Bob Henson
JEFF MASTERS
Jeff Masters, Ph.D., worked as a hurricane scientist with the NOAA Hurricane Hunters from 1986-1990. After a near-fatal flight into category 5 Hurricane Hugo, he left the Hurricane Hunters to pursue a… More by Jeff Masters
Dr. Jeff Master’s and Bob Henson’s More wind, rain, flooding ahead for storm-battered California was first published on Yale Climate Connections, a program of the Yale School of the Environment, available at: http://yaleclimateconnections.org. This work is licensed under a Creative Commons Attribution-Noncommercial-No Derivative Works 2.5 license (CC BY-NC-ND 2.5).
More:
Here are some “ET’s” recorded from around the planet the last couple of days, their consequences, and some extreme temperature outlooks, as well as some extreme precipitation reports:
Here is some new 2022 climatology:
Here is more climate and weather news from Thursday:
(As usual, this will be a fluid post in which more information gets added during the day as it crosses my radar, crediting all who have put it on-line. Items will be archived on this site for posterity. In most instances click on the pictures of each tweet to see each article. The most noteworthy items will be listed first.)
If you like these posts and my work please contribute via the PayPal widget, which has recently been added to this site. Thanks in advance for any support.)
Guy Walton… “The Climate Guy”