The main purpose of this ongoing blog will be to track global extreme or record temperatures related to climate change. Any reports I see of ETs will be listed below the main topic of the day. I’ll refer to extreme or record temperatures as ETs (not extraterrestrials).😉
Main Topic: Spring Warming Trends from Climate Central
Dear Diary. Spring has sprung across a large chunk of the country and way too early for some because nature is quite confused where nights traditionally remain below freezing. In my area of the country fruit trees were already budding in late February, where a later March freeze could ruin crops. Atlanta had its second warmest February on record. Yesterday on the last day of February we saw a record high maximum temperature of 80°F.
When it gets this warm across the south during late winter residents will refer to these conditions as “tornado weather.” Indeed, the Southeast will probably see another unfortunate big outbreak of tornadoes later this week thanks in part to climate change because anomalous warmth will interact with yet another strong system moving eastward from the Rockies.
Here are new spring statistics from Climate Central indicating how much the United States has warmed in recent decades:
2023 Spring Package | Climate Central
Click here to access the data (CSV)
KEY CONCEPTS
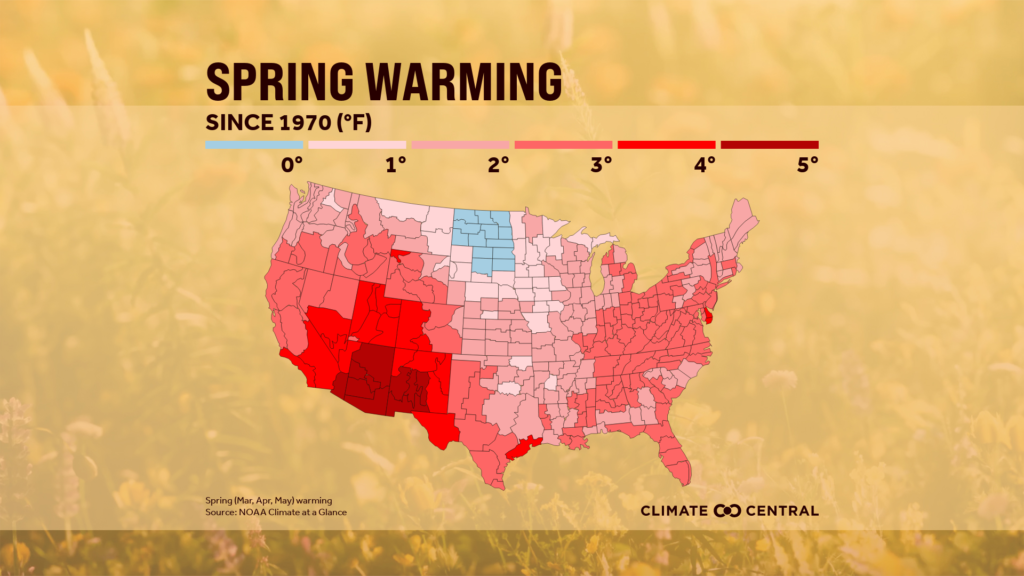
- Spring temperatures have increased by 2°F on average across the U.S. since 1970.
- Spring has warmed since 1970 in 232 U.S. locations.
- The Southwest has experienced the most spring warming, with locations in Nevada, Texas, and Arizona exceeding a 6°F increase.
- Since 1970, 75% of locations saw at least seven more days above their 1991–2020 spring normal temperature.
- Spring is not only warming but coming earlier, stressing water supplies in the West and extending the allergy season across the country.
Click the downloadable graphic: Average Spring Temperatures
Spring is here
Today, March 1st, marks the first day of meteorological spring (March, April, May). To help you welcome the season of melting snow and blooming flowers, we’ve updated our annual Spring Package with:
- Average spring temperature trends since 1970 (247 U.S. locations)
- Change in average spring temperature since 1970 (Contiguous U.S.)
- Spring days above normal trends since 1970 (247 U.S. locations)
Springing into a warmer-than-normal season
The year started with record-setting January warmth, especially in the Northeastern U.S. And like all other seasons, spring is getting warmer across the country. These warming trends are a result of human-caused carbon pollution.
Climate Central analyzed spring temperature data since 1970 in 247 U.S. locations. Trends for 238 U.S. cities (see Methodology) are summarized below:
- Since 1970, spring temperatures have increased by 2°F on average across the U.S.
- Spring has warmed in 97% (232) of 238 U.S. locations.
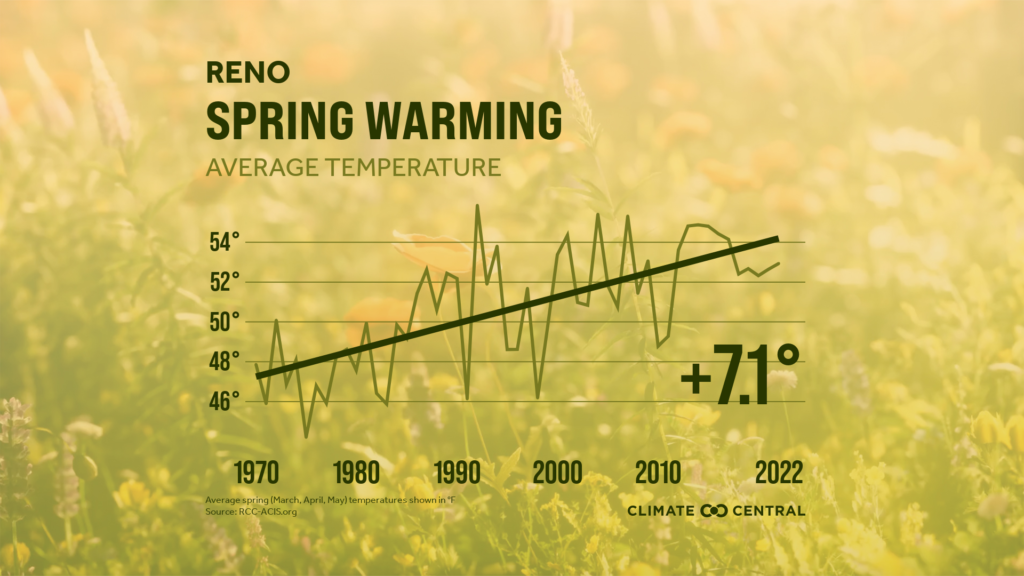
- The Southwest has experienced the largest increase in average spring temperatures, with the greatest warming in Reno, Nev. (7.1°F), Las Vegas, Nev. (6.5°F), and El Paso, Texas (6.2°F).
- Since 1970, 75% (178) of locations saw at least seven more days above their 1991-2020 spring normal temperature.
Warmer springs impact agriculture, health, and water supplies
Spring is not only warming but also shifting. EPA data shows that, since 1980, the last spring frost has happened on average 3.5 days earlier than the long-term average. As warm weather cuts into colder months, growing seasons last longer.
A longer growing season can bring opportunities and challenges for agriculture, depending on the location, ecosystem, and other factors such as water supply. For example, a longer growing season might give some farmers the chance to diversify crops and find new markets. Other farmers might be faced with higher irrigation demands or unwanted plants and animals—including weeds like poison ivy and pests like mosquitoes—that might reduce crop yields. Longer growing seasons also mean longer pollen seasons—a health concern for millions of Americans suffering from allergies and asthma.
In the West, where spring warming is particularly pronounced, another critical resource is impacted: water. Warmer winters and springs mean less snow accumulation and earlier snowmelt, which stresses the region’s limited water resources. The water deficit brought by earlier snowmelt has critical consequences for hydropower generation, agriculture, and drinking water supplies.
LOCAL STORY ANGLES
When is spring blooming near you?
Check out the “springcasting” tools at USA National Phenology Network (USA-NPN), an organization of citizen scientists, government agencies, non-profit groups, and others, who monitor seasonal changes in the natural world. USA-NPN tracks the onset of spring across the country and has historical, real-time, and forecasted phenology maps. These are important tools for forecasting invasive species and pests, allergy outbreaks, and informing agricultural calendars.
How is allergy season in your area affected by warmer springs?
Check out how the duration of the pollen season has changed in your area since 1970 with Climate Central’s local graphics (available for 203 U.S. locations). Find out how your city ranked in the Asthma and Allergy Foundation of America report on the top 100 U.S. Allergy Capitals of 2022. Search for a local allergen report or sign up for pollen level alerts through the National Allergy Bureau.
Check out climate fingerprints on warm spring temperatures near you:
Climate Central’s Climate Shift Index (CSI) quantifies the influence of climate change on daily high and low temperatures experienced in cities across the U.S. To get notified about when CSI peaks in your area, sign up for our Realtime Climate alerts.
CONTACT EXPERTS
Alyssa Rosemartin
Partner and Application Specialist
USA National Phenology Network
School of Natural Resources and the Environment, University of Arizona
Relevant expertise: plant and animal phenology
Contact: alyssa@usanpn.org
*Available for interviews in Spanish and English
Janet Prevéy, PhD
Research Ecologist
Fort Collins Science Center, USGS
Relevant expertise: impact of environmental changes on phenology
Contact: jprevey@usgs.gov
Jose Pablo Ortiz Partida, PhD
Senior Bilingual Water and Climate Scientist
Union of Concerned Scientists
Relevant expertise: climate and water science in California
Contact: Debra Holtz, WesternStatesMedia@ucsusa.org
*Available for interviews in Spanish and English
Mark D. Schwartz, PhD
Distinguished Professor, Department of Geography, University of Wisconsin-Milwaukee
Co-founder of the USA National Phenology Network
Relevant expertise: climatology, phenology
Contact: mds@uwm.edu
Theresa Crimmins, PhD
Director, USA National Phenology Network
Research Professor, University of Arizona
Relevant expertise: plant and animal phenology
Contact: theresa@usanpn.org
Viviana Beltran
Student translator, USA National Phenology Network
Graduate Student, University of Arizona
Relevant expertise: educational outreach on environmental science
Contact: viviana@usanpn.org
*Available for interviews in Spanish and English
FIND EXPERTS
Submit a request to SciLine from the American Association for the Advancement of Science or to the Climate Data Concierge from Columbia University. These free services rapidly connect journalists to relevant scientific experts.
Browse maps of climate experts and services at regional NOAA, USDA, and Department of the Interior offices.
Explore databases such as 500 Women Scientists, BIPOC Climate and Energy Justice PhDs, and Diverse Sources to find and amplify diverse expert voices.
Reach out to your State Climate Office or the nearest Land-Grant University to connect with scientists, educators, and extension staff in your local area.
METHODOLOGY
Analyses used 1970–2022 data from the Applied Climate Information System. Spring days above normal were calculated relative to the 1991–2020 NOAA/NCEI normals. Displayed trend lines are based on a mathematical linear regression. Climate Central’s local analyses include 247 stations. However, for data summaries based on linear trends, only 238 stations are included due to data gaps in Bend, Ore., Dothan, Ala., Hattiesburg, Miss., Hazard, Ky., Jefferson City, Mo., Jonesboro, Ark., Terre Haute, Ind., Twin Falls, Idaho, and Wheeling, W. Va. Average spring warming since 1970 for U.S. climate divisions (displayed on the national map graphic in this release) use NCEI/NOAA Climate at a Glance data.
Here are some “ET’s” recorded from around the planet the last couple of days, their consequences, and some extreme temperature outlooks, as well as any extreme precipitation reports.
Here is some new February 2023 climatology:
Here is more climate and weather news from Wednesday:
(As usual, this will be a fluid post in which more information gets added during the day as it crosses my radar, crediting all who have put it on-line. Items will be archived on this site for posterity. In most instances click on the pictures of each tweet to see each article. The most noteworthy items will be listed first.)
If you like these posts and my work please contribute via the PayPal widget, which has recently been added to this site. Thanks in advance for any support.)
Guy Walton… “The Climate Guy”