The main purpose of this ongoing blog will be to track planetary extreme, or record temperatures related to climate change. Any reports I see of ETs will be listed below the main topic of the day. I’ll refer to extreme or record temperatures as ETs (not extraterrestrials).😉
Main Topic: Electricity Bills Raised Because of Higher Heat Due to Climate Change
Dear Diary. Currently the United States going into May is not experiencing any heatwaves. These mid afternoon temperatures are pretty easy to take:

As summer approaches the good times won’t last with our air conditioners getting a big workout. That means high electric bills, but they are even higher due to climate change. To meet that demand renewable energy needs to be expanded as fast as possible to prevent further environmental degradation.
Here are new details on how much more power demand is occurring because of climate change from Andrew Dressler, writing for the Climate Brink:
How climate change is raising your electricity bill
a case study of Texas’ electricity market

May 06, 2025
In August 2023, during an especially brutal Texas heat wave, I opened my electricity bill and was stunned by the total. As someone who studies climate change, I couldn’t help but connect the dots: global warming had made the heat wave worse, and that extra heat was driving up how much I had to spend on electricity.
That realization led me to a simple question: how much of this bill was due to climate change? I set out to answer it and, 1.5 years later, I published a peer-reviewed paper. This post explains the method behind that analysis and why I estimate that climate change added about $80 to electricity costs for every Texan in 2023.
Understanding the link between climate and electricity demand
The amount of electricity consumed is strongly affected by the outside temperature. We can see this by plotting Texas temperature from ERA5 reanalysis vs. ERCOT energy demand:

Scatterplot of 2023 daily average temperature of Texas (°C) vs daily ERCOT’s daily average power demand (GW); the dashed line is a polynomial fit to the data. Adapted from Fig. 1a of Dessler, 2025
Each dot is one day of data from 2023. The daily average demand is the total average power (in GW) supplied by the ERCOT grid on that day; the daily-average temperature is the population-weighted average temperature of Texas.
The result is a V-shaped curve. Electricity demand is lowest at moderate temperatures — 60-70°F — when people don’t need much heating or cooling. But as temperatures rise or fall beyond that comfort zone, demand increases as more energy is used for air conditioning or heating.
Climate change
As summers get hotter, we expect people to consumer more energy for cooling. Winters are also warming and that will decrease energy consumption because less energy will be used for heating. The overall impact is the net of these two effects.
We can use a fit to the temperature-demand data in the plot above to quantify this (the dashed line). With the fit, I can take the daily average temperature of Texas on any date and I can tell you what the daily average electricity demand in 2023 would have been with that temperature.
So I do the following:
- I take daily temperatures from the middle of the 20th century and plug them into the fit to predict what 2023’s demand would have been with the cooler climate of that time.
- I take daily temperatures from the recent decade and plug them into the fit to predict what 2023’s demand is with the warmer present-day climate.
Comparing demand with the climate of the mid-20th century to demand with the climate of the recent decade will show how climate change has increased energy demand:
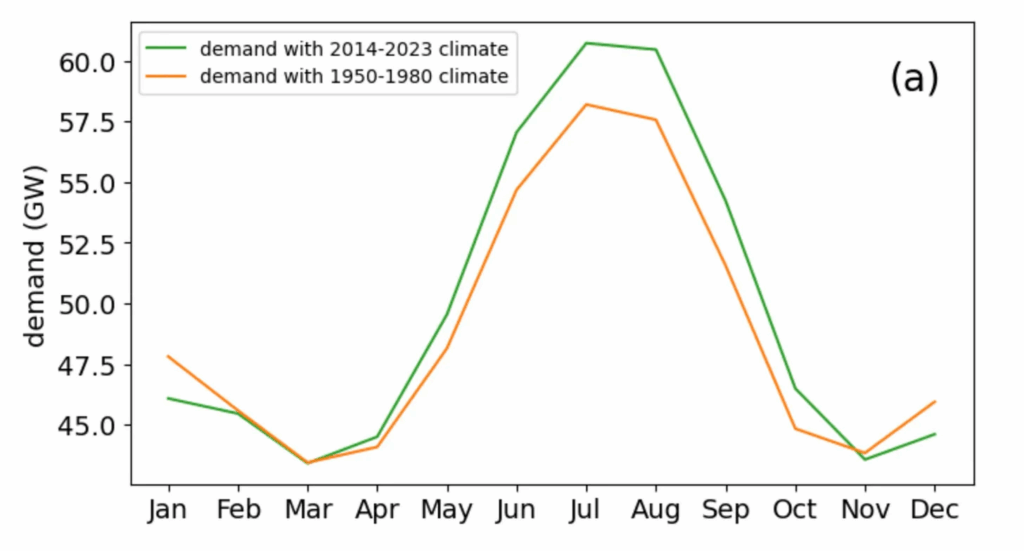
Monthly average 2023 demand using temperatures from two periods: mid-20th century (1950-1980) and modern (2014-2023). Adampted from Fig. 3a of Dessler, 2025
The difference between these lines in this plot is an estimate of the impact of climate change on Texas electricity demand. As discussed above, we see that demand in January and December is lower today due to warmer winters, which require less heating.
From April to October, on the other hand, we see that increasing temperatures increased average electricity demand. The differences are particularly pronounced at the height of summer: in August, demand has increased by 5% due to climate change.
Over the entire year, climate change increased electricity demand by 1.8% between the mid-20th century and today.
To clarify an important point: This analysis isolates the impact of temperature alone. All other variables — population size, grid infrastructure, power generation capacity, and ERCOT’s operational policies — remain fixed at their 2023 levels throughout these calculations. Temperature is the only changing factor in this comparison between historical and current climate conditions.
The economic impact of rising temperatures
This increase in demand is just the first step. On the wholesale ERCOT market, the price of electricity and level of demand are related: as demand rises, the price of electricity also rises.
To show this, here is a plot of daily average wholesale price vs. daily average demand:
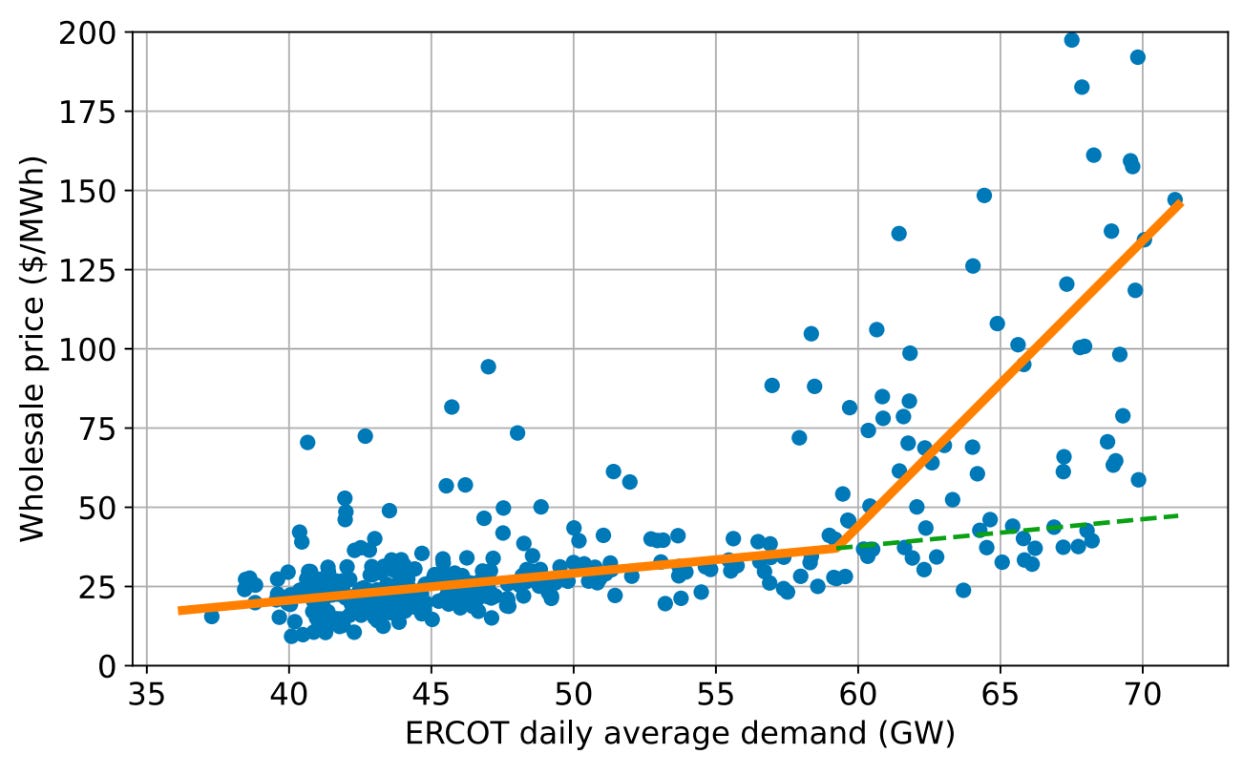
Demand-weighted daily average price vs daily average demand for 2023. Prices are the hub average cost (HB_HUBAVG) from the day-ahead market. Blue dots show daily values, and the orange line is a piecewise linear fit to the median values of daily data in 2.5-GW demand bins. The green dashed line shows the fit from the “normal regime” extended to high levels of demand. Adapted from Fig. 4 of Dessler, 2025.
The figure shows that, at all levels of demand, the price rises as demand increases. At lower levels of demand (below 59 GW), the price rises relatively slowly. This occurs because ERCOT must rely on increasingly expensive sources of power to meet increasing demand, causing per-unit electricity costs to increase.
Above 59 GW of daily-average demand, the grid approaches its physical capacity to provide power. When this happens, ERCOT implements scarcity pricing, causing the price to rapidly rise.
This creates a double burden for consumers: As temperatures rise due to climate change, consumers need to buy more electricity to cope with higher temperatures and each unit of electricity costs more.
To quantify the financial impact of climate change, I calculated the daily electricity costs using this process:
- Gather daily average Texas temperatures from reanalysis data
- Apply these temperatures to the temperature-demand relationship to predict electricity demand
- Use estimated demand to determine wholesale prices based on the price-demand curve (orange lines in the price-demand figure)
- Calculate total daily cost by multiplying price by demand
I performed this analysis using temperature data from both the mid-20th century (1950-1980) and the recent decade (2014-2023) to compare the costs:
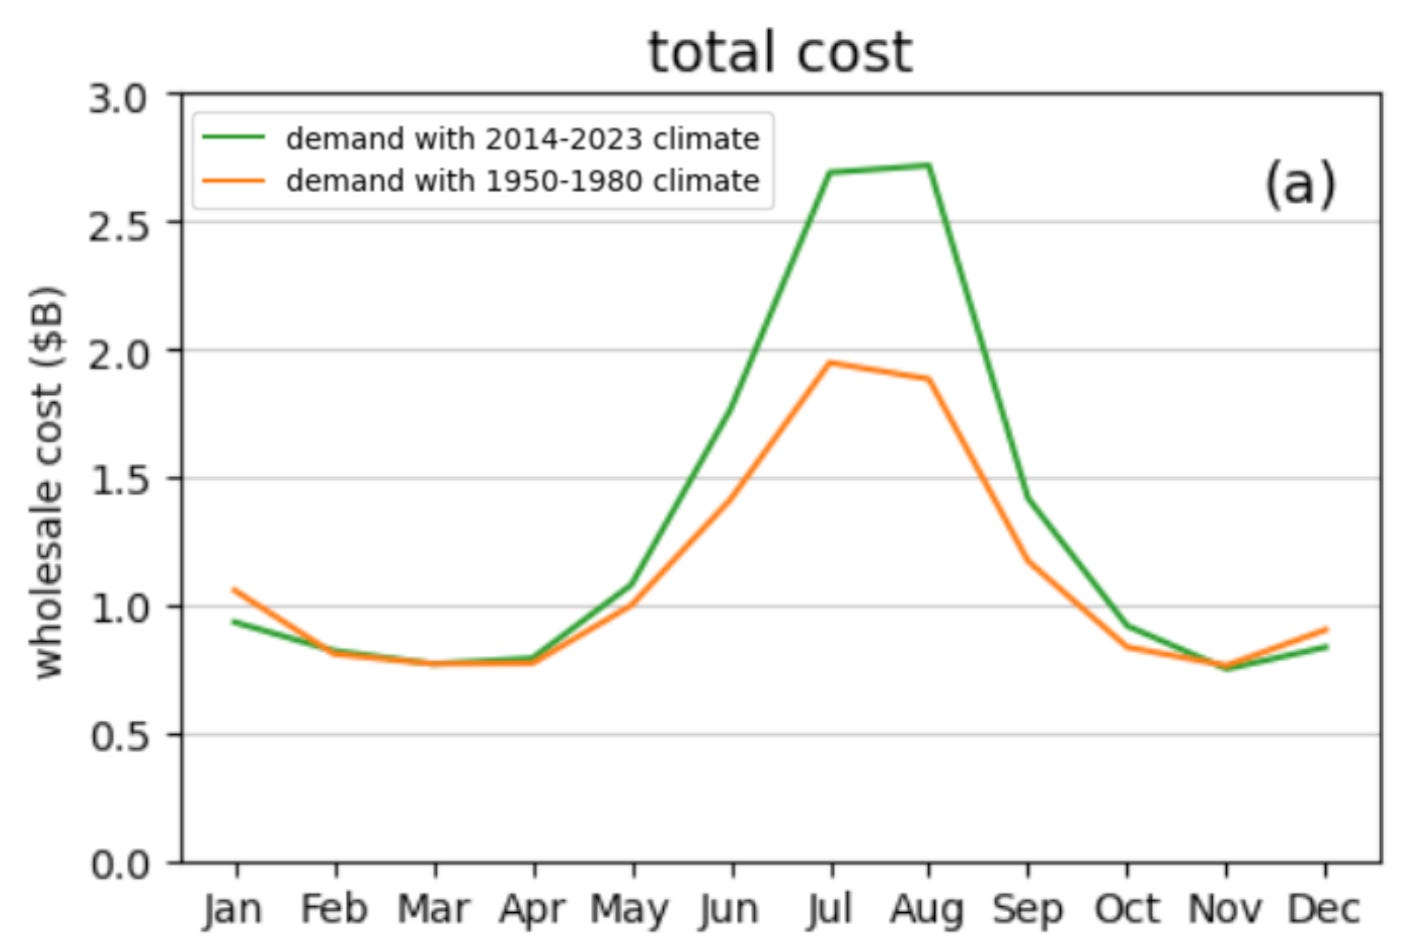
Monthly average cost of electricity in 2023 with the climate of 1950–80 and 2014–23 in billions of dollars. Adapted from Fig. 5a of Dessler, 2025.
Summing over the year, we find that the increase in demand combined with the corresponding increase in price raised the cost of wholesale electricity in 2023 by 16%, corresponding to $80 per Texas resident1.
This is a climate tax we’re all paying. But unlike government taxation that funds public services voters value — like national defense, parks, or deficit reduction — this climate burden provides no benefits to citizens. Instead, these additional costs enrich fossil fuel executives and shareholders, financing luxury excesses while ordinary people shoulder the financial burden of a warming planet.
This is yet another way that climate change is a bum deal.
Here are more “ET’s” recorded from around the planet the last couple of days, their consequences, and some extreme temperature outlooks, as well as any extreme precipitation reports:
Here is More Climate News from Tuesday:
(As usual, this will be a fluid post in which more information gets added during the day as it crosses my radar, crediting all who have put it on-line. Items will be archived on this site for posterity. In most instances click on the pictures of each tweet to see each article. The most noteworthy items will be listed first.)