The main purpose of this ongoing blog will be to track planetary extreme, or record temperatures related to climate change. Any reports I see of ETs will be listed below the main topic of the day. I’ll refer to extreme or record temperatures as ETs (not extraterrestrials).😉
Main Topic: Latest Hurricane Trends Due to Climate Change
Dear Diary. Despite awful faulty charts presented by contrarians, science is demonstrating that climate change is making hurricanes worse with each passing year. Climate Central is doing a great job judging factors such as strength, intensification, and potential destruction due to sea level rise.
Here are their findings as of 2025. Since the Atlantic Hurricane Season is upon us, let’s be mindful of added threats we have to contend with due to our carbon pollution. For the full report, which I did not post, hit the link below:
KEY FACTS
- Oceans made warmer by human-caused climate change are fueling more intense hurricanes in the Atlantic — that bring heavier rainfall and higher storm surge when they make landfall.
- Climate Central resources bring the latest climate science into hurricane season coverage.
- Climate Central’s new hurricane attribution system will calculate how much stronger each named storm of the 2025 Atlantic hurricane season became due to ocean temperatures made warmer by climate change.
- Climate Central’s new RiskViewer site provides a curated set of photorealistic storm surge visualizations in coastal locations across 20 Atlantic and Gulf Coast states.
- Updated graphics show that, from 1980 to 2024, 186 landfalling Atlantic tropical cyclones rapidly intensified.
This Climate Matters analysis is based on open-access data from the National Oceanic and Atmospheric Administration (NOAA), including the National Hurricane Center. See Methodology for details.

Hurricanes and climate change: Five new reporting resources
Oceans made warmer by human-caused climate change are fueling more intense hurricanes in the Atlantic. In our warming climate, these storms also bring heavier rainfall and higher storm surge when they make landfall.
Here are five new reporting resources that bring the latest climate science into coverage of the 2025 Atlantic hurricane season (June 1 – November 30):
1. Attribution analysis for every 2025 Atlantic hurricane
Climate change is warming oceans worldwide. Those warm waters fuel stronger hurricane winds and more powerful hurricanes.
Climate Central’s Climate Shift Index: Ocean tool (Ocean CSI) measures how climate change affects ocean temperatures.
Our latest hurricane attribution system, Climate Shift Index: Tropical Cyclones, is powered by the Ocean CSI and based on peer-reviewed methods. This new system can now show how much more intense a storm’s winds became because of climate change-fueled warmer waters. Learn more here about how the science works.
Climate Central will compile this attribution data to tell the climate change story of each named storm of the 2025 Atlantic hurricane season.
Sign up for Climate Matters to receive these hurricane analyses in your inbox throughout the season.
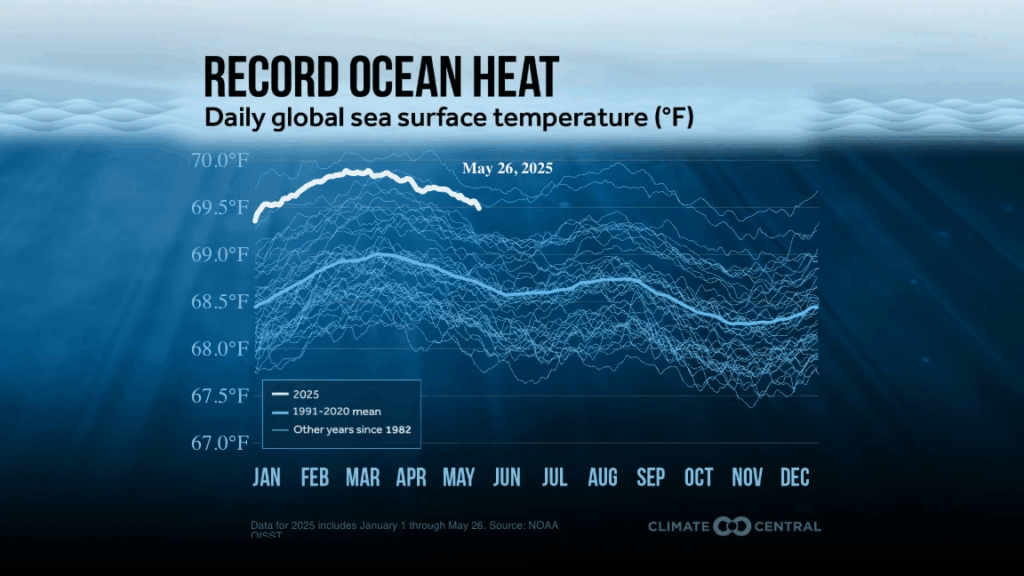
Global sea surface temperature, 1982-2025
Click here to view and download this graphic showing daily global mean sea surface temperature (°F) from NOAA’s OISST dataset. This graphic will update daily around 6 a.m. ET.
2. RiskViewer: Visualizations of local storm surge
Sea level rise can amplify storm surge during hurricanes, putting coastal residents at heightened risk.
Climate Central’s newly-launched RiskViewer site provides a set of photorealistic visualizations of storm surge in coastal locations across 20 states along the Atlantic and Gulf Coasts.
RiskViewer is powered by Climate Central’s FloodVisionⓇ technology, which generates science-based visualizations of local flood risk from storm surge and sea level rise.
The FloodVision team’s 2024 Edge of America Tour drove through coastal communities from Maine to Texas capturing images of local landmarks. Now you can see how those landmarks would fare with storms and sea level rise — including the kinds of storm surge events that could occur this hurricane season.
Contact the FloodVision team to request additional visualizations of locations at risk near you.
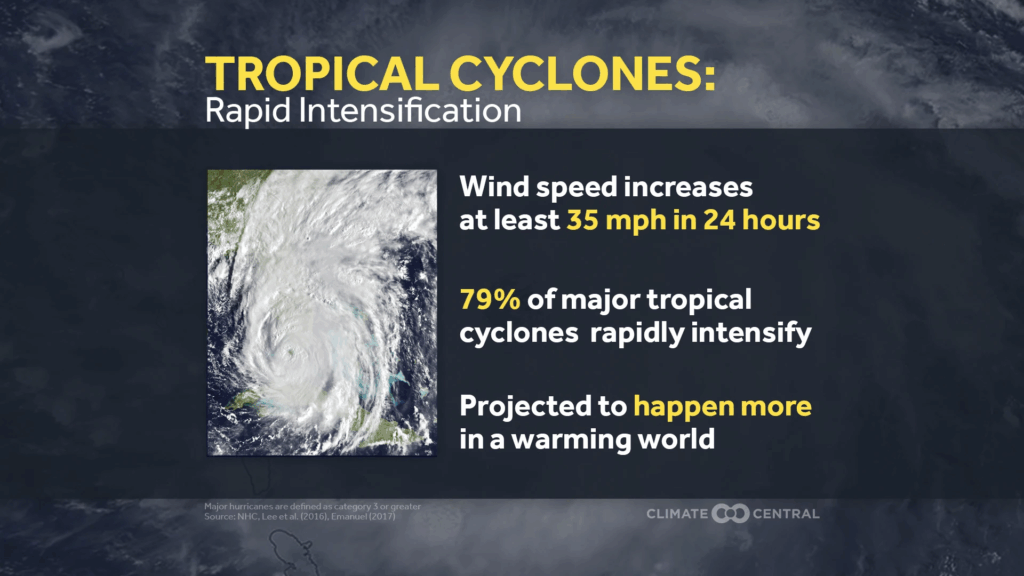
3. Hurricane rapid intensification
About 80% of major hurricanes (Category 3-5) undergo rapid intensification — defined as an increase in the maximum sustained winds of a tropical cyclone of at least 30 kt (about 35 mph) in a 24-hour period.
Research suggests that warmer sea surface temperatures may contribute to an increased fraction of tropical cyclones that undergo rapid intensification.
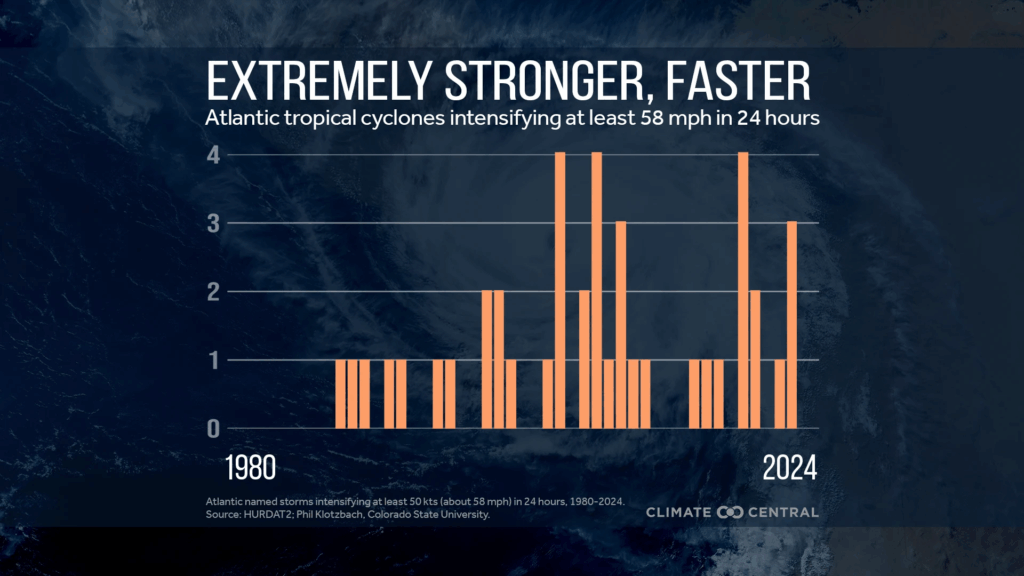
From 1980 to 2024, 186 landfalling Atlantic tropical cyclones rapidly intensified above the 30 kt threshold.

Nearly one-quarter of these 186 storms (42 or 23%) experienced extreme rapid intensification: an increase in maximum sustained winds of at least 50 kt (about 58 mph) in a 24-hour period.
Forecasting rapid intensification can be challenging, which contributes to the high human and economic toll of such storms.
Tropical cyclones, which include hurricanes and tropical storms, are the most costly weather and climate disasters in the U.S. by far — accounting for over $1.4 trillion in damages since 1980.
Most (72%, or 48) of the 67 total billion-dollar tropical cyclones in the U.S. since 1980 rapidly intensified.
4. Extreme Weather Toolkit: Tropical Cyclones
Climate Central’s Extreme Weather Toolkit: Tropical Cyclonesprovides quick facts in English and Spanish on hurricanes and climate change — along with a collection of reporting resources.
The toolkit reviews the connections among ocean warming, sea level rise, and heavier rainfall in our warming climate and observed trends in tropical cyclone intensity and impacts.
Warmer air can hold more moisture, increasing the chances of heavier downpours that contribute to flooding.
Analysis by World Weather Attribution found that human-caused climate change intensified Hurricane Helene’s record-breaking rainfall, which led to catastrophic flooding in both coastal and inland regions.
Tropical cyclone rainfall rates have increased globally and in the Atlantic, with further increases expected as warming continues.
This higher rainfall intensity, combined with the fact that climate change is enabling tropical cyclones to maintain more of their strength after making landfall, increases the risk of inland flooding.
Rainfall flooding accounted for 57% of all U.S. deaths from tropical cyclones during 2013–2022, according to a 2023 report from the National Hurricane Center.
5. Official 2025 hurricane season resources
Official outlook: NOAA’s 2025 Atlantic hurricane season outlook predicts above-normal activity.
Real-time updates: NOAA’s National Hurricane Center monitors current conditions and provides 2-day and 7-day tropical weather outlooks for the Atlantic, Eastern Pacific, and Central Pacific.
Early outlook: Colorado State University’s 2025 Atlantic seasonal hurricane forecast, released in early April and available in English and Spanish, anticipates above-normal activity this season. Updates are expected on June 11, July 9, and August 6.
Hurricane safety: NOAA’s Hurricane Preparedness hub provides safety information and resources to help communities stay safe before, during, and after hurricanes. The Ready.gov hurricanes site provides guidance in 13 languages.
New products and services: For 2025, the National Hurricane Center’s cone graphic will also depict inland tropical storm and hurricane watches and warnings in effect. The NHC will also provide a national rip current risk map when active tropical systems are present. Check the National Hurricane Center Products and Services Update for 2025 Hurricane Season for details.
Risk screening: NOAA’s National Storm Surge Risk Maps can be used to assess risk in hurricane-prone coastal areas. FEMA’s National Risk Index maps hurricane risk levels for counties and census tracts in the contiguous U.S.
Here are more “ETs” recorded from around the planet the last couple of days, their consequences, and some extreme temperature outlooks, as well as any extreme precipitation reports:
Here is More Climate News from Wednesday:
(As usual, this will be a fluid post in which more information gets added during the day as it crosses my radar, crediting all who have put it on-line. Items will be archived on this site for posterity. In most instances click on the pictures of each tweet to see each article. The most noteworthy items will be listed first.)