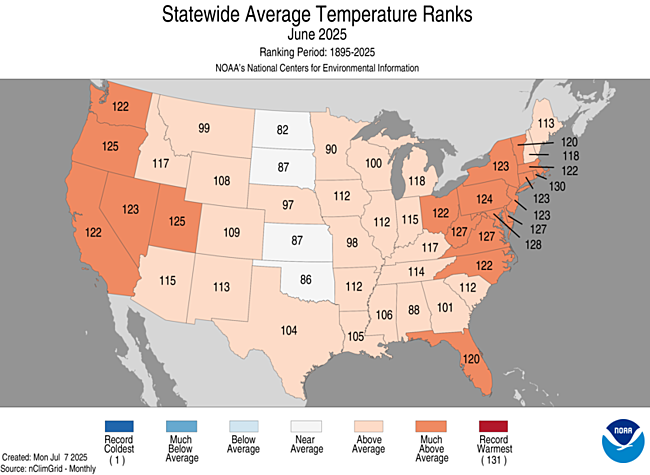
Dear Diary. Increasingly Climate Central is doing some wonderful intricate analysis of climate change trends for smaller regions of the planet, which I have wished for the last decade. Their Climate Shift Tool is unique in that it indicates probabilities of how likely an anomalous hot, dry or wet event was across the U.S. due to climate change. June was exceptionally hot across most of the continental United States, which ranked 7th warmest since 1895 with an overall average anomaly of +2.75°F. Historic eastern CAT4 Heatwave Shell played a big part in that ranking around the third week of June, while western CAT3 Heatwave Occidental affected averages during the first week of the month:
So, keeping all of this in mind, let’s post Climate Central’s results for June:
https://www.climatecentral.org/report/monthly-attribution-overview-june-2025
Report• July 1, 2025
Monthly Attribution Overview – June 2025
An analysis of how climate change boosted United States temperatures in June 2025
Using Climate Central’s Climate Shift Index (CSI) tool to measure the impact of climate change on daily temperatures across the United States, as well as NOAA’s Applied Climate Information System (ACIS) to find daily temperature information, we have compiled a high-level overview of how climate change has affected temperature trends in June in cities across the United States. (Dataset downloadable as Excel workbook here.)
1. High-Level Findings
- The U.S. saw elevated temperatures in June with an average anomaly of 1.5°F across 192 cities.
- 33 cities (17% of stations) experienced one of their top 10 warmest June monthly temperatures on record (average stations have data reaching back to 1893).
- Elevated Climate Shift Index values were notable across the Southwest, South, Southeast, Northeast, and Ohio Valley/Upper Midwest(regions defined by the NCEI climate regions). 78 Cities experienced at least a week’s worth of CSI values greater than or equal to 2, indicating a strong climate change influence.
- Long-term June warming trends show that nearly all cities analyzed have gotten warmer since 1970, consistent with findings from our 2025 Summer Package.
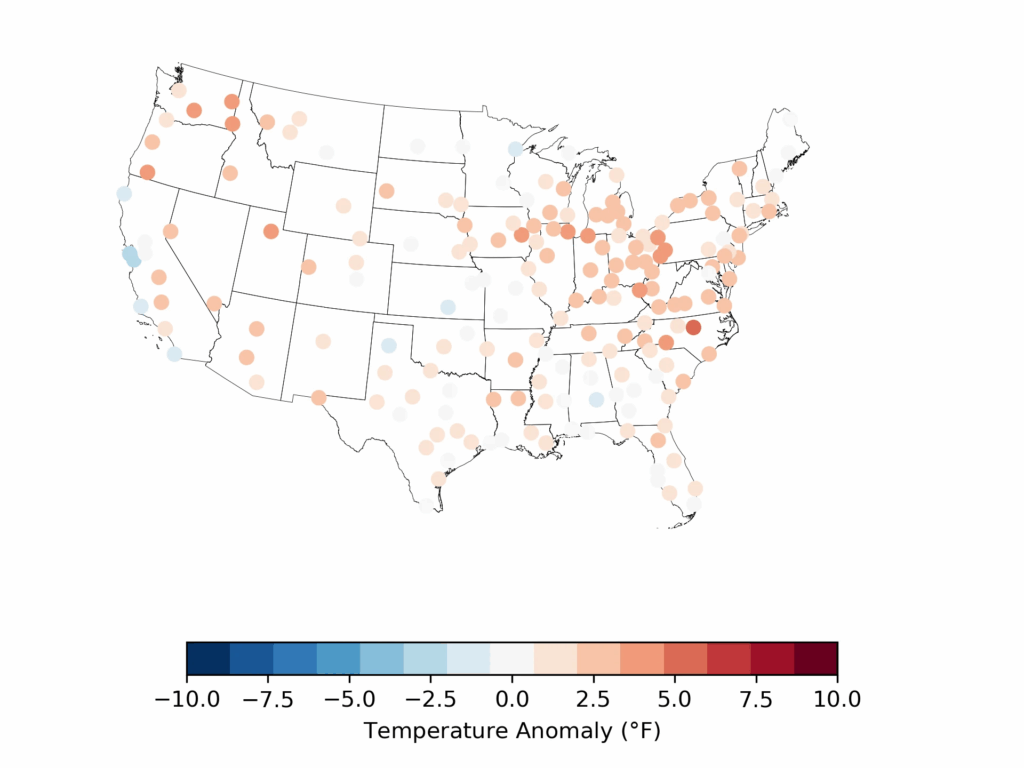
Figure 1. Threaded ACIS temperature anomalies for June 2025 relative to the 1991-2020 standard normal period. Analysis based on ACIS data.
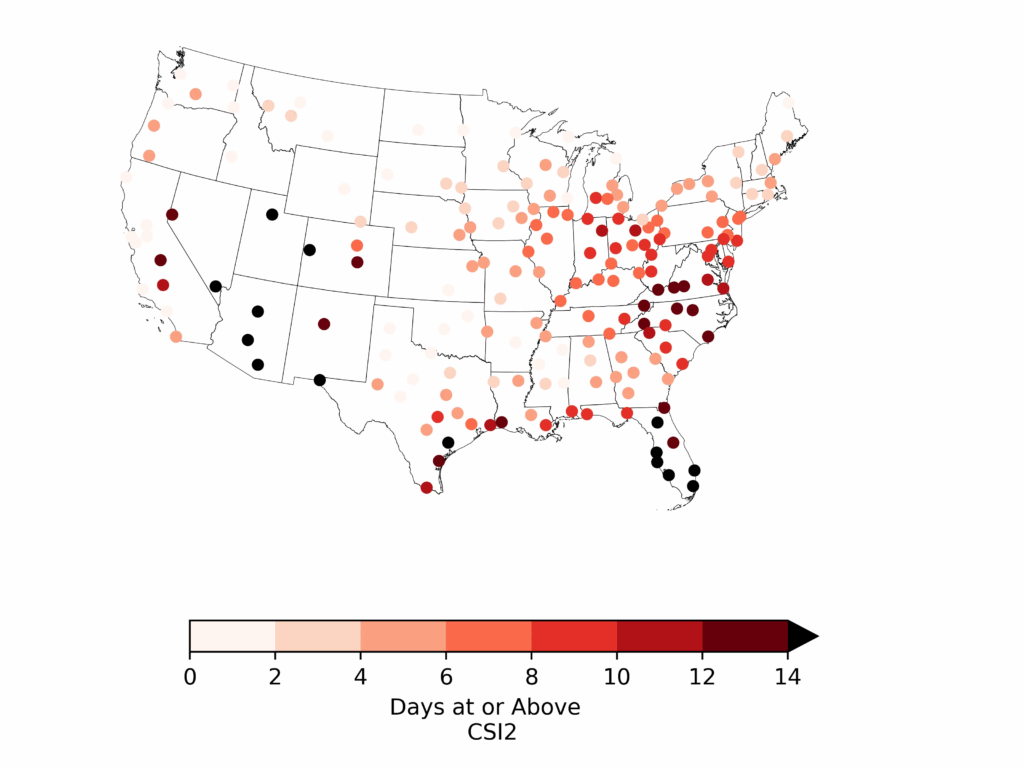
Figure 2. Days with a CSI of 2 or higher for June 2025 for ACIS threaded stations. Analysis based on ERA5 data (6/01 – 5/25) and GFS data (6/26-6/30).
2. Local Temperature Anomaly Analysis
- The average temperature anomaly across the 192 cities analyzed was 1.5°F, with a majority — 166 cities — having hotter-than-average temperatures.
- Temperatures were moderately elevated across the country, with every region experiencing positive temperature anomalies, or differences from normal. The region that was the most unusually hot was the Ohio Valley region (states in this region include West Virginia, Tennessee, Ohio, Illinois, Missouri, Indiana, and Kentucky), where the average temperature anomaly was 2.18°F. The region with the smallest difference from normal was the West, where temperature anomalies were 0.37°F hotter than average.
- The most unusually warm city this June was Raleigh, NC, which was 4.92°F warmer than usual.
- Of the 191 ACIS stations analyzed, 190 showed positive temperature trends for June, indicating that these cities have been warming on average since 1970.
- Reno, NV, warmed the most out of all the analyzed cities. The average June in Reno is 7.2°F warmer than it was in 1970.
| City | State | Temperature Anomaly (°F) | Average Temperature (°F) | Warming Since 1970 (°F) |
|---|---|---|---|---|
| Raleigh | NC | 4.92 | 81.62 | 5.2 |
| Lewiston | ID | 4.50 | 70.84 | 2.4 |
| Spokane | WA | 3.95 | 66.07 | 2.8 |
| Huntington | WV | 3.94 | 76.69 | 2.6 |
| South Bend | IN | 3.89 | 72.52 | 1.8 |
| Wheeling | WV | 3.79 | 72.59 | 5.3 |
| Pittsburgh | PA | 3.78 | 73.13 | 3.3 |
| Medford | OR | 3.75 | 70.48 | 4.2 |
| Cedar Rapids | IA | 3.63 | 73.45 | 1.1 |
| Salt Lake City | UT | 3.53 | 74.95 | 5.5 |
Table 1. Top 10 ACIS stations with the highest June 2025 temperature anomaly.
| City | State | Warming Since 1970 (°F) | Temperature Anomaly (°F) | Average Temperature (°F) |
|---|---|---|---|---|
| Reno | NV | 10.2 | 3.20 | 72.40 |
| El Paso | TX | 7.2 | 2.05 | 85.84 |
| Las Vegas | NV | 6.4 | 2.33 | 89.79 |
| Odessa | TX | 5.9 | 1.88 | 84.53 |
| Salt Lake City | UT | 5.5 | 3.53 | 74.95 |
| Tucson | AZ | 5.5 | 1.98 | 88.03 |
| Erie | PA | 5.3 | 1.93 | 70.07 |
| Fort Smith | AR | 5.3 | 1.98 | 80.72 |
| Albany | GA | 5.3 | 0.36 | 81.21 |
| Wheeling | WV | 5.3 | 3.79 | 72.59 |
Table 2. Top 10 ACIS stations with the fastest warming June since 1970.
3. Local Climate Shift Index Analysis
- Honolulu, Hawaii had 23 days at CSI 5 in June, indicating that temperatures on those days were made at least five times more likely because of climate change.
- 78 cities across the country experienced at least a week of days at or above a CSI of 2.
- On average, cities in the Southwest experienced the highest number of days (14) with a CSI of 2 or above.
- Even though San Juan had a negative temperature anomaly — meaning it was cooler than the 1991–2020 average — it still experienced one of the highest numbers of days with a Climate Shift Index (CSI) of 2 or higher.
- This is because temperature anomalies are measured relative to recent climate norms (1991–2020), while the CSI reflects how much warmer conditions are compared to pre-industrial times. So, while San Juan may have felt cooler relative to recent decades, it was still significantly warmer than a typical pre-industrial June.
| City | State | Days at CSI = 2 or higher | Days at CSI = 5 | Average Temperature (°F) | Temperature Anomaly (°F) |
|---|---|---|---|---|---|
| Honolulu | HI | 28 | 23 | 80.97 | 0.64 |
| San Juan | PR | 28 | 15 | 82.94 | -0.13 |
| Tampa | FL | 20 | 6 | 83.47 | 0.54 |
| Miami | FL | 20 | 11 | 83.16 | 0.38 |
| Victoria | TX | 20 | 7 | 82.67 | 0.00 |
| Sarasota | FL | 19 | 7 | 81.40 | -0.37 |
| West Palm Beach | FL | 19 | 12 | 83.43 | 1.81 |
| Gainesville | FL | 18 | 2 | 82.38 | 2.53 |
| Grand Junction | CO | 18 | 1 | 75.98 | 3.13 |
| Fort Myers | FL | 18 | 1 | 83.47 | 1.18 |
| Flagstaff | AZ | 17 | 9 | 63.52 | 2.86 |
Table 3. Top ACIS stations with the highest number of days at or above a CSI of 2 during June 2025.
METHODOLOGY
Calculating the Climate Shift Index
All Climate Shift Index (CSI) levels reported in this brief are based on daily average temperatures and ERA5 data. See the frequently asked questions for details on computing the Climate Shift Index, including a summary of the multi-model approach described in Gilford et al. (2022).
City Analysis
We analyzed 191 Applied Climate Information System (ACIS) stations associated with U.S. cities. For each city, we found the CSI time series from the nearest 0.25° grid cell. We calculated the number of days at CSI levels 2, 3, 4, and 5. We used ACIS data to find the average monthly temperatures, temperature anomalies, and precipitation information, and to derive average monthly warming trends for each city.
Here are more “ET’s” recorded from around the planet the last couple of days, their consequences, and some extreme temperature outlooks, as well as any extreme precipitation reports:
Here is More Climate News from Friday:
(As usual, this will be a fluid post in which more information gets added during the day as it crosses my radar, crediting all who have put it on-line. Items will be archived on this site for posterity. In most instances click on the pictures of each tweet to see each article. The most noteworthy items will be listed first.)