The main purpose of this ongoing blog will be to track planetary extreme, or record temperatures related to climate change. Any reports I see of ETs will be listed below the main topic of the day. I’ll refer to extreme or record temperatures as ETs (not extraterrestrials).😜
Main Topic: Risky Summer 2025 Heat Added by Climate Change
Dear Diary. Yesterday as our main topic we delved into the high cost of climate change affecting Europe this summer. Today I got a notice that Climate Central had prepared a report on excess heat the occurred across the U.S. during a very hot summer. Overall, at least this summer was not quite as hot as that of 2024, but many locations had life threatening record heat, especially because many high minimum records were close to 80°F in the South and East, so there was not much relief from heat waves at night.
Here is that report. (For a video that I did not include, hit the following link):
Risky Summer 2025 Heat Added by Climate Change | Climate Central
Climate Matters•September 16, 2025
Risky Summer 2025 Heat Added by Climate Change
KEY FACTS
- Climate Central’s latest global analysis shows where people felt the strongest influence of human-caused climate change on daily average temperatures between June and August 2025.
- Every day during the last three months, at least one in five people on the planet felt a strong climate change influence.
- In 193 (out of 247) U.S. cities, people experienced at least a week’s worth of days with temperatures strongly influenced by climate change.
- More than 21 million people in the U.S. experienced at least 30 days of risky heat driven by carbon pollution. Risky heat days are hotter than 90% of those recorded in a local area from 1991-2020.
- In 112 U.S. cities, climate change accounted for at least half of the risky heat days people experienced this summer.
Download local data
NEW: Social media toolkit
Read the report
Explore interactive maps
Billions experienced summer heat fueled by carbon pollution
According to Climate Central’s latest report, People Exposed to Climate Change: June to August 2025, the effects of carbon pollution (mainly from burning coal, oil, and methane gas) influenced temperatures in nearly all regions of the world during the past three months. This was especially true for locations in the Northern Hemisphere during their meteorological summer, including the U.S.
This Climate Central analysis used the Climate Shift Index (CSI) to quantify the influence of human-caused climate change on daily average temperatures experienced in 240 countries and 940 cities (including 247 U.S. cities) from June 1 to August 31, 2025. See Methodology for details.
- Explore interactive maps for more data on U.S. states and cities.
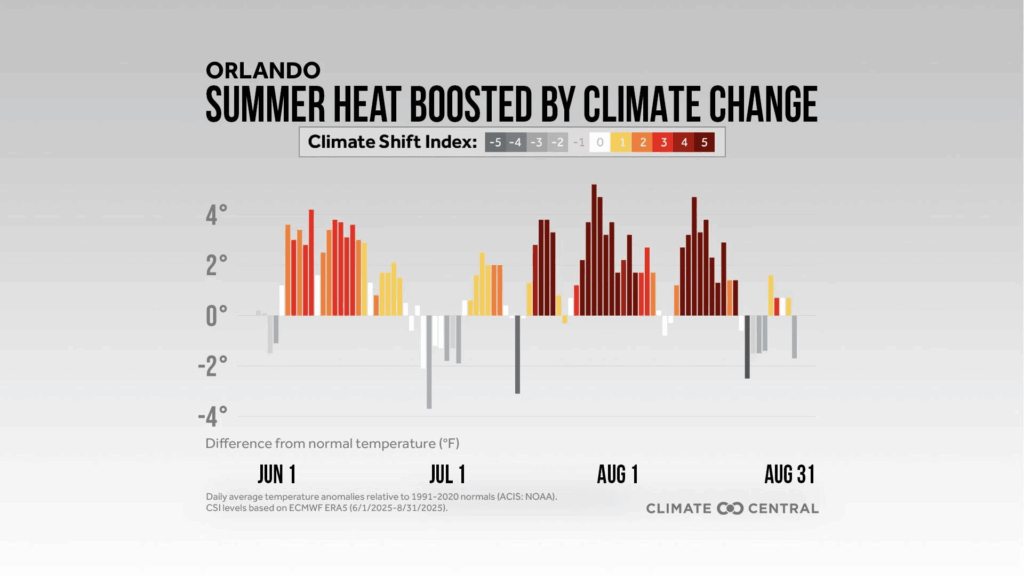
Click the downloadable graphic: Summer 2025 Daily Anomalies and CSI
Climate change strongly influenced daily temperatures
CSI levels, developed by Climate Central’s scientists, quantify the influence of climate change on local daily temperatures. Positive CSI levels 1 to 5 indicate temperatures that are increasingly likely because of climate change. A CSI level 2 means temperatures that day were made twice as likely by climate change. This analysis focuses on the average person’s experience of unusually warm conditions strongly influenced by climate change (CSI level 2 or higher).
- Each day during the last three months, at least 1.8 billion people (22% of the global population) experienced temperatures made at least twice as likely because of climate change (CSI level 2 or higher).
- Across the U.S., the average person experienced about 21 days with a strong influence of climate change (CSI 2 or higher) during meteorological summer (June-August).
- The average person in Hawaii experienced temperatures strongly influenced by climate change nearly every day this summer (90 out of 92 days).
- In 193 U.S. cities, people experienced at least a week’s worth of days at CSI 2 or higher.
Explore interactive maps for more data on U.S. states and cities.
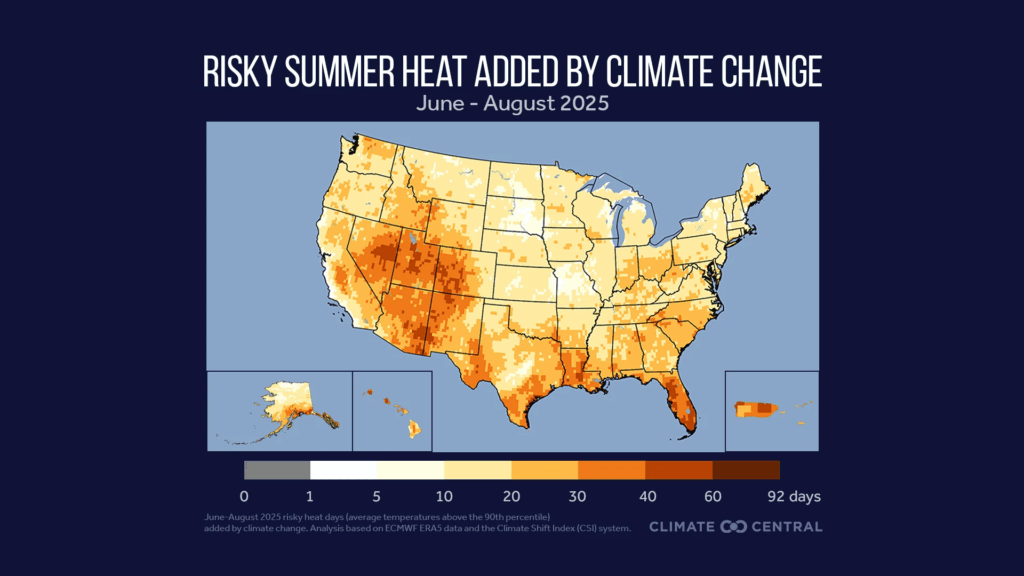
Click the downloadable graphic: Risky Heat Days Added By Climate Change
More risky heat added by climate change
Risky heat days are hotter than 90% of temperatures observed in a local area compared to the 1991-2020 period. Heat-related health risks rise when temperatures climb above this local threshold. Climate Central analyzed the number of risky heat days that were added by climate change globally, including in 247 U.S. cities and all U.S. states.
- Nearly 955 million people on the planet experienced 30 or more days of risky heat added by climate change in June to August 2025.
- In all 50 U.S. states, Puerto Rico, and Washington, D.C., the average person experienced at least one additional weeks’ worth of risky heat this summer because of climate change.
- Thirty-two U.S. cities — home to more than 21 million people collectively — experienced 30 or more risky heat days added by climate change.
- Locations that experienced the most days of risky heat because of climate change include: West Palm Beach, Fla. (49 risky heat days added by climate change); Anchorage, Alaska (48); Miami, Fla. (47); and San Juan, Puerto Rico (46).
- In 112 U.S. cities, climate change accounted for at least half of the risky heat days people experienced this summer.
- In some cities, climate change added all of the risky heat days experienced this summer, including: Honolulu, Hawaii (38 risky heat days, all added by climate change); McAllen, Texas (24); Houston, Texas (21); and Waco, Texas (9).
Explore interactive maps for more data on U.S. states and cities.
Exceptional summer heat
- On average, the U.S. was about 0.6°F warmer than normal during June to August (compared to the 1991-2020 average).
- Nearly 45% of U.S. cities (111 out of 247) saw temperatures that were at least 1°F warmer than normal this summer.
- Many U.S. cities that experienced at least a week’s worth of days at CSI 2 or higher also experienced exceptionally warm temperatures during the past three months (Table 1).
Table 1. Cities with the highest seasonal temperature difference from normal during June-August 2025.
| City | State | Seasonal temperature difference from normal (°F) | Days at CSI 2 or higher |
|---|---|---|---|
| Lewiston | Idaho | 3.4 | 15 |
| Spokane | Washington | 3.4 | 14 |
| Missoula | Montana | 3.3 | 14 |
| Fresno | California | 3 | 42 |
| Yakima | Washington | 2.7 | 25 |
| Salt Lake City | Utah | 2.6 | 51 |
| Grand Junction | Colorado | 2.6 | 41 |
| Bristol | Tennessee | 2.5 | 47 |
LOCAL STORY ANGLES
Is climate change influencing daily heat extremes in your local area?
Climate Central’s Climate Shift Index (CSI) system provides tools, data, custom maps, and local alerts to answer this question in real-time. Here are three ways to use the CSI:
- Use the tools. Climate Central’s Climate Shift Index map tool shows which parts of the world are experiencing high CSI levels, every day. Explore the global CSI map for today, tomorrow, and any day in the recent past.
- Access KML to create custom CSI maps. Get access using the panel links in the map tool.
- Sign up for alerts. Sign up here to receive custom email alerts when significant CSI levels are detected in your local area.
To request an interview with a Climate Central scientist about this analysis, please contact Abbie Veitch, aveitch@climatecentral.org.
FIND EXPERTS
Submit a request to SciLine from the American Association for the Advancement of Science or to the Climate Data Concierge from Columbia University. These free services rapidly connect journalists to relevant scientific experts.
Browse maps of climate experts and services at regional NOAA, USDA, and Department of the Interior offices.
Explore databases such as 500 Women Scientists, BIPOC Climate and Energy Justice PhDs, and Diverse Sources to find and amplify diverse expert voices.
Reach out to your State Climate Office or the nearest Land-Grant University to connect with scientists, educators, and extension staff in your local area.
METHODOLOGY
All Climate Shift Index (CSI) levels reported in this brief are based on daily average temperatures and ECMWF ERA5 data from June 1, 2025 to Aug. 31, 2025. See the frequently asked questions for details on computing the Climate Shift Index, including a summary of the multi-model approach described in Gilford et al. (2022).
For the set of local graphics included in this release, daily average temperature anomalies (relative to 1991-2020 normals) from June 1, 2025 to August 31, 2025 were obtained from the Applied Climate Information System, which is developed, maintained, and operated by NOAA’s Regional Climate Centers. Three locations do not have localized graphics due to incomplete data: Chico, Calif.; Clarksburg, W.Va; and Laredo, Texas.
Values shown in maps and tables across this website have been rounded for clarity. For exact data values, please download the full dataset above.
A detailed methodology can be found in the full report.
Here are more “ETs” recorded from around the planet the last couple of days, their consequences, and some extreme temperature outlooks, as well as any extreme precipitation reports:
Here is More Climate News from Wednesday:
(As usual, this will be a fluid post in which more information gets added during the day as it crosses my radar, crediting all who have put it on-line. Items will be archived on this site for posterity. In most instances click on the pictures of each tweet to see each article. The most noteworthy items will be listed first.)