The main purpose of this blog will be to track planetary extreme, or record temperatures related to climate change. Any reports I see of ETs will be listed below the main topic of the day. I’ll refer to extreme or record temperatures as ETs (not extraterrestrials).😜
Main Topic: 2026 and 2027 Global Average Temperature Forecasts From Zeke Hausfather
Dear Diary. A few days ago, we got our first global average temperature forecast for 2026 from U.K.’s Met Office, suggesting that it will be near that of 2025 at between +1.29C to +1.53C higher than preindustrial conditions. Let’s round that figure off to +1.4C. Today I noticed a second opinion from Dr. Zeke Hausfather in my Gmail in box.
Zeke Housefather’s forecast is similar with an addition of a forecast for 2027. These forecasts mostly depend upon ENSO behavior and similar global volcanic activity that we see during 2025. Here is his summary:
My 2026 and 2027 global temperature forecasts
The best thing about predicting the near future is you don’t need to wait long to be wrong

| Zeke Hausfather Dec 20, 2025 |
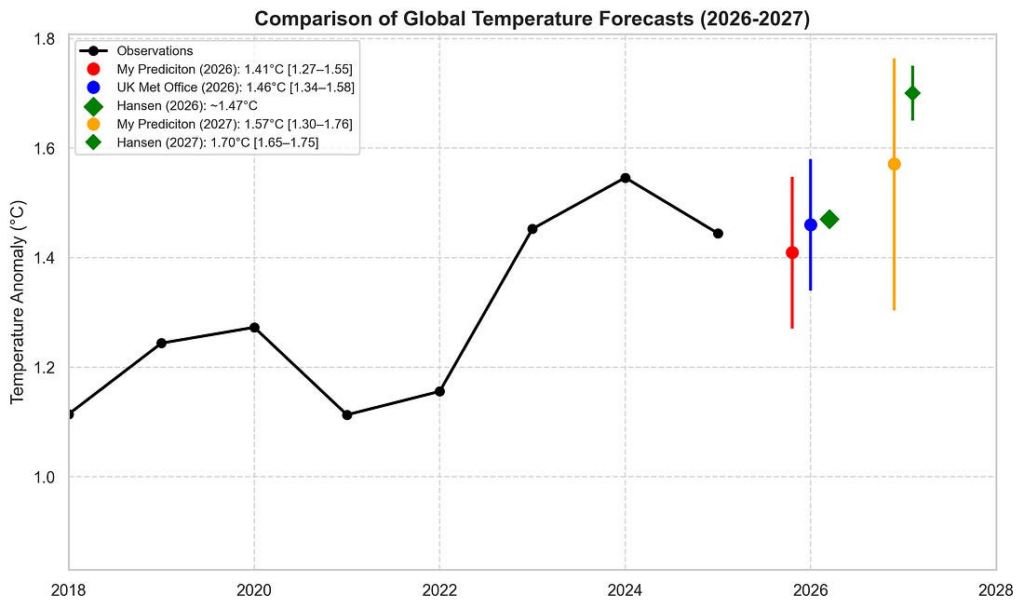
Tis the season for global temperature forecasts. The UK Met Office recently released their 2026 prediction, estimating that it is most likely to end up as the second warmest year on record at 1.46C (with a range of 1.34C and 1.58C) relative to the 1850-1900 preindustrial baseline period.¹ This is likely warmer than both 2023 and 2025² and with a small chance of being warmer than 2024.
Not to be outdone, James Hansen released his estimate that 2026 temperatures will also be around 1.47C in the GISTEMP dataset (albeit using a somewhat different 1880-1920 baseline)³, with the 12 month average dipping down to around 1.4C in the coming months before rising back up by year’s end.
Hansen also adds a prediction for 2027 at 1.7C (1.65C to 1.75C), albeit with the caveat that this refers to the peak 12-month warming during the year rather than the annual average. The prediction is based on an assumed El Nino developing in late 2026 – something that models have suggested is increasingly likely in recent weeks.
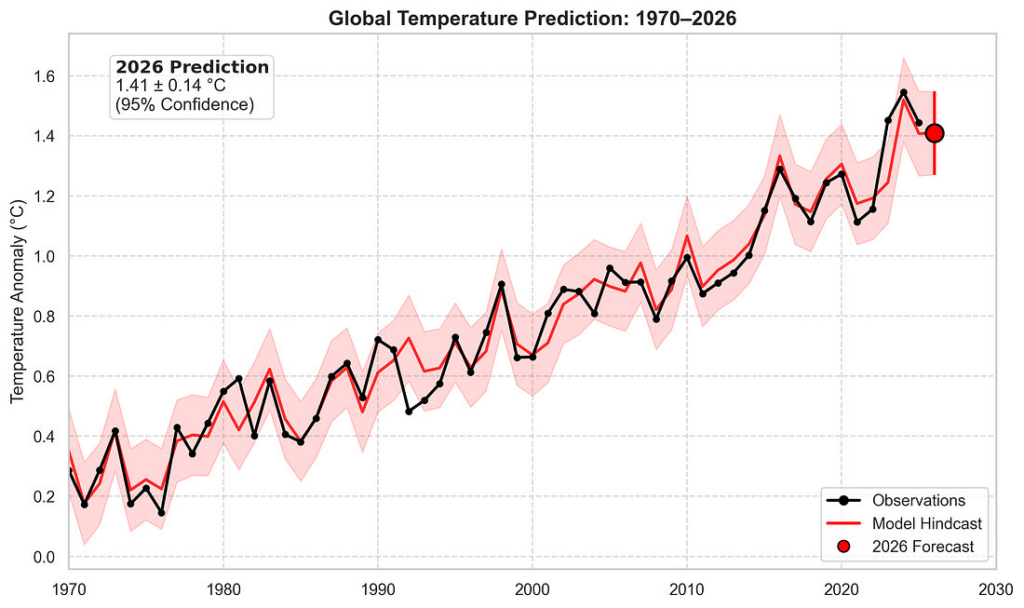
I’ve long done year-ahead predictions of global mean surface temperatures (included in the Carbon Brief annual state of the climate report). I base it on a linear regression model that uses a year count, the prior year’s temperature, the latest monthly temperature, and the predicted ENSO (El Nino / La Nina) conditions of the first three months of the coming year, as these factors tend to be the most predictive historically.
The model is fit on historical data since 1970⁴ using the WMO average of six datasets,⁵ and I’ve slightly tweaked the model this year to include a squared term for the year count to ensure it is not forced to be too linear (though the effects of this change are minor).
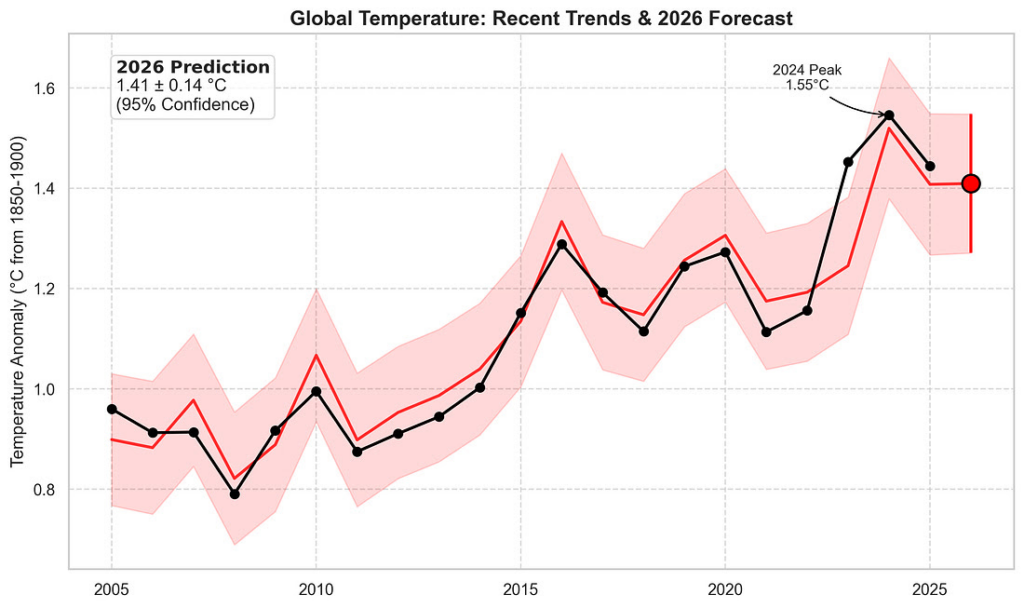
For 2026 I expect global temperatures to be around around 1.41C, with a 95% confidence interval of 1.27C to 1.55C. This means that it is almost certain to be one of the top-4 warmest years, but quite unlikely to exceed 2024’s record. Global temperatures in 2026 will be slightly suppressed by modest La Nina conditions in the tropical Pacific early in the year, while a late-developing El Nino (if it occurs) will primarily affect 2027 temperatures.
This model generally does a good job at predicting past calendar years using the same set of predictors (e.g. no actual data from the year except for Jan-March ENSO state). We can see this if we extend the hindcast back to 1970, where all years are within the model envelope with the exception of 1992 (when Pinatubo’s eruption resulted in significant unexpected cooling) and 2023 (which remains a bit of a mystery).
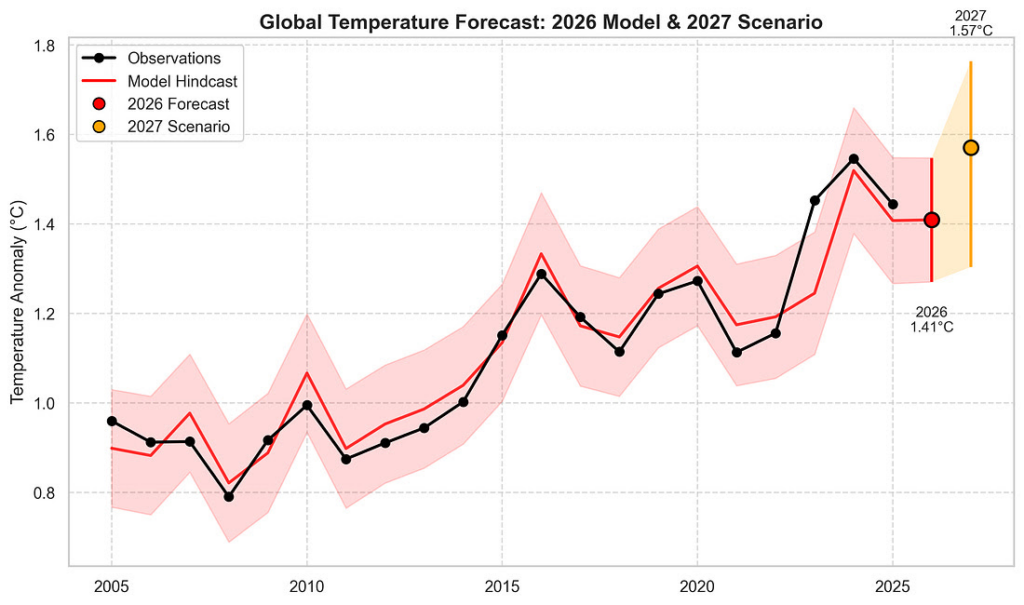
Predicting temperatures two years ahead is a bit more of a challenge. Here I’ve adopted a somewhat different approach of using the current warming level and the rate of warming (0.27C/decade) that we estimated in the Forster et al 2025 paper as a starting point. I’ve further assumed a boost of 0.1C in global mean surface temperatures from an assumed moderately strong El Nino event in the central estimate, though the error bars encompass no El Nino (0C boost) to a very strong El Nino (0.15C boost).
This gives a central estimate of 1.57C for 2027, albeit with error bars wide enough to ride an elephant though (1.30C to 1.76C!) given the difficulty of accurately predicting ENSO state that far into the future.
My central estimate of 1.57C is a bit lower than Hansen’s 1.7C, in part because I’m assuming a moderately strong El Nino and somewhat lower warming rates (0.27C/decade in Forster et al) then the 0.31C/decade that Hansen assumes. But his estimates remain within my (admittedly large) prediction error bars.
The fun part about making these short term forecasts is that we won’t have to wait that long to see how well they play out. The less fun part is that we are all forecasting a future rate of warming well above the ~0.2C per decade that has characterized the post-1970 period.
1 Here the Met Office is using the WMO average of six datasets rather than just HadCRU5.
2 Note that final 2025 temperatures are not available yet, so annual values are estimated based on data through November. You will have to wait until January 12th to see the final values.
3 Somewhat conveniently, Hansen’s GISTEMP-based estimate using an 1880-1920 baseline gives values quite similar to what the WMO average of datasets gets using an 1850-1900 baseline, so its comparable to all the other forecasts in this piece without requiring any fancy adjustments.
4 Excluding 1982 and 1992 from the training data due to large volcanic eruptions. I’m not trying to predict major volcanic eruptions.
5 The WMO average includes NOAA, NASA, Hadley, Berkeley Earth, ERA5, and JRA-3Q.
Here are some “ETs” recorded from around the planet the last couple of days, their consequences, and some extreme temperature outlooks, as well as any extreme precipitation reports:
Here is More Climate News from Saturday:
(As usual, this will be a fluid post in which more information gets added during the day as it crosses my radar, crediting all who have put it on-line. Items will be archived on this site for posterity. In most instances click on the pictures of each tweet to see each article. The most noteworthy items will be listed first.)