The main purpose of this ongoing blog will be to track planetary extreme, or record temperatures related to climate change. Any reports I see of ETs will be listed below the main topic of the day. I’ll refer to extreme or record temperatures as ETs (not extraterrestrials)😜
Main Topic: The Cities That Broke Heat Records Last Year
Dear Diary. Way to go! Europe’s Copernicus Climate Change Service has built a tool you can use to look up temperatures in your city and see how each month of 2025 stacked up against its historic average. I invite all to check it out.
Also, I’m reminding all that what Copernicus is doing stems from research I began on 1/1/2000 comparing numbers of heat with cold records: Relative increase of record high maximum temperatures compared to record low minimum temperatures in the U.S. – Meehl – 2009 – Geophysical Research Letters – Wiley Online Library The new research and portal via the New York Times stems from ideas encapsulated in that paper, which I am verifying as each month and year passes. Ratio trajectories of warm to cold records on all charts are up, unfortunately.
Here are more details from the New York Times:
The Cities That Broke Heat Records Last Year – The New York Times
The Cities That Broke Heat Records Last Year
Thousands of cities around the world saw their hottest year on record in 2025 as the planet has inched closer to a key temperature threshold.

Shanghai was one of thousands of cities that set records for average annual temperatures since 1950.Credit…Go Nakamura/Reuters

By Claire Brown
Jan. 15, 2026
Last year, thousands of places, from Shanghai to Moscow to Salt Lake City, saw their hottest average annual temperatures since at least 1950.
As for cities with record-breaking cold, there was just one last year: Manvi, in the Indian state of Karnataka. It’s the first time any city in the world has seen its coldest year since 2014, according to new data from scientists at Europe’s Copernicus Climate Change Service.
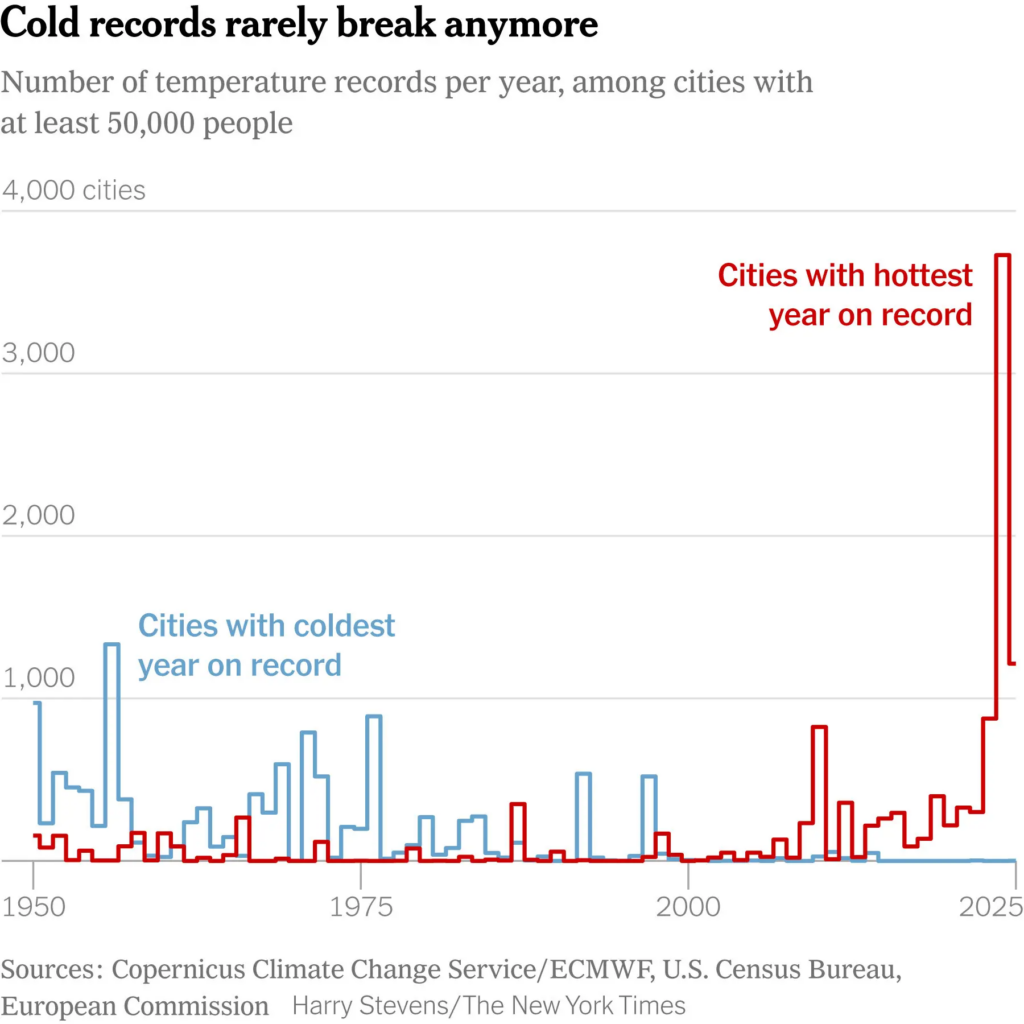
Record-low temperatures are becoming rarer and rarer as climate change brings hotter weather to virtually every corner of the globe.
As Harry Stevens and Eric Niiler put it: “Planet Earth isn’t cooling off anytime soon.”
They’ve built a tool you can use to look up temperatures in your city and see how each month of 2025 stacked up against its historic average.
Just shy of 1.5 degrees
Global temperatures in 2025 averaged 1.47 degrees Celsius, or 2.65 degrees Fahrenheit, above preindustrial levels, according to the data. Other estimates have put the number slightly lower, at 1.41 and 1.44 degrees Celsius.
Copernicus found that last year was the third-warmest year on record, after 2024 and 2023. The trend is clear: The last 11 years have been the 11 hottest since the organization began keeping records in 1950.
The 1.5-degree warming threshold looms large in climate science. As part of the 2015 Paris Agreement, nearly every country in the world agreed to try to avoid going past that level in an effort to head off the most severe effects of climate change.
That goal has been getting further out of reach. The Paris target is based on a long-term average. But in 2024, global temperatures exceeded 1.5 degrees Celsius above preindustrial averages for the first time. According to Copernicus, the three-year average now hovers above 1.5 degrees.
In the U.S. alone, disaster costs surpassed $100 billion, even though no hurricane struck U.S. shores.
The scale of climate-fueled disasters has added to a long-growing sense of urgency among vulnerable nations to scale up adaptation efforts. But according to a United Nations report in October, rich nations are sending less money to poorer countries to help out.
Predictions for 2026
That 2025 was cooler than the previous two years did not surprise scientists: La Niña conditions, which tend to lower global average temperatures, were present for much of the year.
For the same reason, researchers at Berkeley Earth Institute predicted this week that average temperatures in 2026 would most likely look similar and be slightly cooler than last year.
Stopping global warming would require a sweeping and global reduction of greenhouse gas emissions. But 2025 may herald another milestone in that category: Carbon dioxide emissions from burning fossil fuels have been on track to soar to record highs last year.
From:
How Hot Was Your Town Last Year? Look Up Where You Live. – The New York Times
How Hot Was Your Town Last Year? Look Up Where You Live.
(For graphics that I could not repost, hit the above link.)
By Harry Stevens and Eric Niiler Jan. 13, 2026
Planet Earth isn’t cooling off anytime soon.
Last year’s global average temperature was the third warmest since the preindustrial era, according to new data released Tuesday by scientists at Europe’s Copernicus Climate Change Service.
The past 11 years have been the hottest on record, and that warmth has fueled more powerful storms, floods, heat waves, droughts and wildfires across the globe.
From Moscow to Salt Lake City, thousands of cities around the globe experienced their hottest average temperatures since at least 1950, according to a New York Times analysis of data from Copernicus.
For example, where the Climate Guy lives:
In Smyrna, Ga., last year’s average temperature was 61.9°F, the 16th warmest year since 1950. The temperature here has increased at a rate of 0.3°F per decade.
The warming climate affects weather patterns. For every 1 degree Celsius rise in temperature, the atmosphere holds about 7 percent more moisture, which increases the likelihood of more intense rainfall and the risk of severe floods. A similar relationship can be found with heat waves and drought, according to Samantha Burgess, the deputy director of Copernicus.
“Climate change is effectively a threat multiplier,” she said. “An individual event may not be directly attributed to climate change, because we’ve always had flooding events and we’ve always had heat waves, but they are often made worse because of that long term climate change signal.”
But people don’t experience the average temperature for the whole year, they live through weather at a particular time. Record hot years are made up of shorter periods that can be both hotter and colder than average.
In Smyrna, Ga., eight months were hotter than normal in 2025. April was particularly hotter than normal, while January was particularly colder than normal.
Dr. Burgess said that emissions of carbon dioxide and other greenhouse gases and warm ocean temperatures were the driving forces behind 2025’s atmospheric warmth. Another factor is the reduction in sulfate aerosols, tiny particles formed when coal and other fossil fuels are burned.
They had been blocking sunlight and keeping parts of the Earth cooler, she said. But efforts to cut sulfur pollution from industry and commercial shipping have led to cleaner air and more sunlight hitting the earth’s surface, heating up parts of the land and ocean.
By contrast, much of India was cooler than normal because of a lingering La Niña weather phenomenon in the Pacific Ocean in early 2025 that resulted in more rainfall.
Cold records used to break all the time, but now they hardly ever do. Hottest records, on the other hand, break regularly. More than 1,200 cities had their hottest year on record this year. Only Manvi, a city of 71,000 in India, had its coldest year.
Long-term global warming is now expected to surpass 1.5 degrees Celsius (2.7 Fahrenheit) by 2029, Copernicus estimates. The planet is likely to breach that limit a decade earlier than predicted at the 2015 Paris climate summit. At that meeting, more than 190 nations agreed to the target to minimize the growing risks of catastrophic storms, droughts, wildfires, and species extinction.
Global emissions of carbon dioxide, methane and other greenhouse gases from factories, vehicles and power plants continue to rise. At the same time, natural carbon “sinks” such as the ocean, forests and soils are becoming less able to absorb them.
The only way to slow climate change – both overall warming of the atmosphere and the resulting extreme weather events – is to reduce greenhouse gas emissions, according to Carlo Buontempo, director of Copernicus.
Methodology
Historical and current temperature data is sourced from ERA5-Land, a reanalysis dataset provided by the Copernicus Climate Change Service and European Centre for Medium-Range Weather Forecasts. This dataset provides a global, consistent record of surface temperatures from 1950 to the present, at a resolution of roughly 6 miles (9 kilometers).
City boundaries are sourced from the U.S. Census Bureau (combining “Places” and “County Subdivisions”) for locations in the United States, and the European Commission’s Global Human Settlement Layer (GHS-UCDB) for international urban centers. This resulted in a list of 59,781 towns and cities.
For the temperature analysis, The Times journalists identified a representative point guaranteed to be within each city’s land boundary, and then extracted the monthly temperature time series for the specific ERA5-Land grid cell containing that point. Because ERA5-Land data covers only land surfaces, coastal or island cities where the representative point fell on a water pixel were matched to the average of valid land pixels within a 25-kilometer (or, for remote islands, 200-kilometer) radius.
Temperatures may appear slightly cooler than those reported by your local weather station or airport. This is expected and due to the nature of gridded data. A single ERA5-Land pixel represents the average temperature across an area of roughly 30 square miles (81 square kilometers). A weather station is a single thermometer often placed in a warm microclimate (like a tarmac). The grid cell naturally averages out these hot spots with surrounding cooler areas like parks or vegetation. Likewise, in mountainous regions, the elevation of the model’s grid cell may differ from the specific elevation of the weather station. If the grid cell averages a slope that is higher than the valley floor where the city center sits, the reported temperature will be cooler.
While the absolute temperatures may differ from a specific thermometer, the relative trends remain consistent. A record-breaking warm year at the airport is likely a record-breaking warm year for the surrounding climate grid.
Our Coverage of Climate and the Environment
- Britain’s Wind Farm Contracts: The British government provided guaranteed electricity prices to a group of wind farm developers in what it says is an effort to bring down power costs for consumers.
- Coal Power Rebound: U.S. greenhouse gas emissions increased by 2.4 percent in 2025 after two years of decline amid a resurgence of coal power, according to estimates published by the Rhodium Group, a research firm.
- Environmental Protection Agency: In a reversal, the agency plans to calculate only the cost to industry when setting pollution limits, and not the monetary value of saving human lives, documents show.
- Is Grass-Fed Beef Better for the Climate? The idea of cows grazing in a pasture seems idyllic. We asked experts how their emissions stack up compared to factory farms.
- Climate F.A.Q.: Do you have questions about climate change? We’ve got answers
Here are some “ETs” recorded from around the planet the last couple of days, their consequences, and some extreme temperature outlooks, as well as any extreme precipitation reports:
Here is More Climate News from Friday:
(As usual, this will be a fluid post in which more information gets added during the day as it crosses my radar, crediting all who have put it on-line. Items will be archived on this site for posterity. In most instances click on the pictures of each tweet to see each article. The most noteworthy items will be listed first.)