The main purpose of this ongoing blog will be to track global extreme or record temperatures related to climate change. Any reports I see of ETs will be listed below the main topic of the day. I’ll refer to extreme or record temperatures as ETs (not extraterrestrials).😜
Main Topic: China’s CO2 Emissions Have Now Been ‘Flat or Falling’ For 21 Months
Dear Diary. About nine out of ten of my daily posts present negative news when it comes to climate change. That’s just a sign of our times. Today for Valentines Day we will have a one in ten post with some loving good news.
Many people across the United States say that they won’t bother trying to fix our climate pointing out that China does nothing. Au contraire. Over the past few years China has rapidly built a green economy while the U.S. has remained nearly stagnant, and now due to the undoing of the critical Endangerment Finding, we could soon be going backward due to Trump. I’m delighted to report that China’s emissions have finally flatlined over the past 21 months. Here are more details:
Katharine Hayhoe
One of the most common objections I hear to climate action is: “But what about China?”
The person making this argument usually goes on to claim that China is doing nothing, while everyone else is making sacrifices. But that’s not what the data show.
Here’s the reality:
* As the U.S. doubles down on fossil fuels and blocks new wind and solar projects, its emissions are ticking up.
* In contrast, China’s emissions appear to have peaked — and may now be starting to decline.
* Last year, China installed a full half of all the world’s new wind and solar energy.
* Over the past two years, China installed more new solar power each year than the U.S. has installed in total across its entire history.
* China’s clean exports alone are cutting CO2 outside its borders by 1% year on year.
Of course no country can fix climate change on its own. But as it’s a global problem, progress in one place helps everyone.
Analysis: China’s CO2 emissions have now been ‘flat or falling’ for 21 months – Carbon Brief
12 February 2026
Analysis: China’s CO2 emissions have now been ‘flat or falling’ for 21 months

Lauri Myllyvirta
12.02.2026
China’s carbon dioxide (CO2) emissions fell by 1% in the final quarter of 2025, likely securing a decline of 0.3% for the full year as a whole.
This extends a “flat or falling” trend in China’s CO2 emissions that began in March 2024 and has now lasted for nearly two years.
The new analysis for Carbon Brief shows that, in 2025, emissions from fossil fuels increased by an estimated 0.1%, but this was more than offset by a 7% decline in CO2 from cement.
Other key findings include:
- CO2 emissions fell year-on-year in almost all major sectors in 2025, including transport (3%), power (1.5%) and building materials (7%).
- The key exception was the chemicals industry, where emissions grew 12%.
- Solar power output increased by 43% year-on-year, wind by 14% and nuclear 8%, helping push down coal generation by 1.9%.
- Energy storage capacity grew by a record 75 gigawatts (GW), well ahead of the rise in peak demand of 55GW.
- This means that growth in energy storage capacity and clean-power output topped the increases in peak and total electricity demand, respectively.
The CO2 numbers imply that China’s carbon intensity – its fossil-fuel emissions per unit of GDP – fell by 4.7% in 2025 and by 12% during 2020-25.
This is well short of the 18% target set for that period by the 14th five-year plan.
Moreover, China would now need to cut its carbon intensity by around 23% over the next five years in order to meet one of its key climate commitments under the Paris Agreement.
Whether Chinese policymakers remain committed to this target is a key open question ahead of the publication of the 15th five-year plan in March.
This will help determine if China’s emissions have already passed their peak, or if they will rise once again and only peak much closer to the officially targeted date of “before 2030”.
‘Flat or falling’
The latest analysis shows China’s CO2 emissions have now been flat or falling for 21 months, starting in March 2024. This trend continued in the final quarter of 2025, when emissions fell by 1% year-on-year.
The picture continues to be finely balanced, with emissions falling in all major sectors – including transport, power, cement and metals – but rising in the chemicals industry.
This combination of factors means that emissions continue to plateau at levels slightly below the peak reached in early 2024, as shown in the figure below.
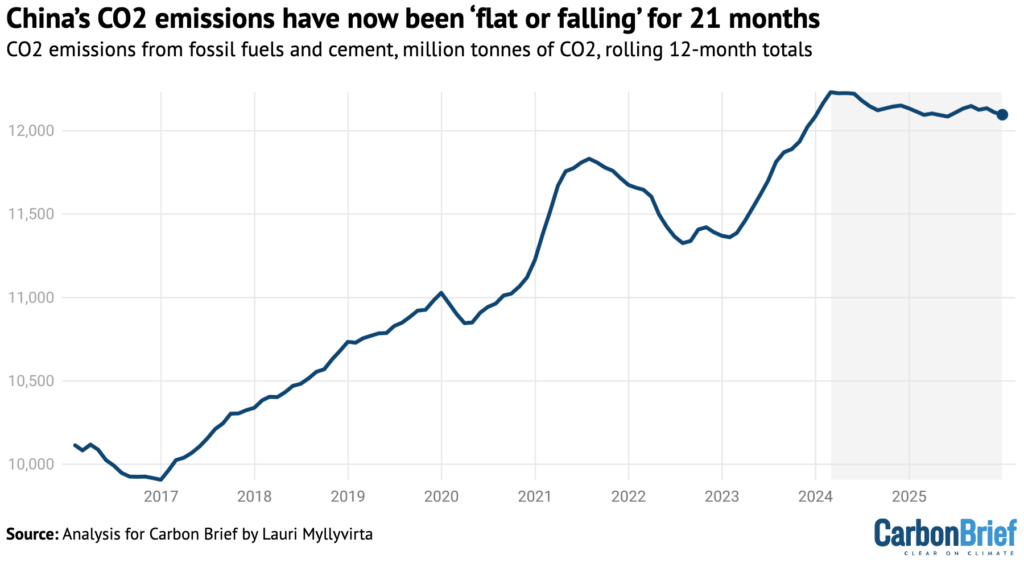
China’s CO2 emissions from fossil fuels and cement, million tonnes of CO2, rolling 12-month totals until September 2025. Source: Emissions are estimated from National Bureau of Statistics data on production of different fuels and cement, China Customs data on imports and exports and WIND Information data on changes in inventories, applying emissions factors from China’s latest national greenhouse gas emissions inventory and annual emissions factors per tonne of cement production until 2024. Sector breakdown of coal consumption is estimated using coal consumption data from WIND Information and electricity data from the National Energy Administration. The consumption of petrol, diesel and jet fuel is adjusted to match quarterly totals estimated by Sinopec.
Power sector emissions fell by 1.5% year-on-year in 2025, with coal use falling 1.7% and gas use increasing 6%. Emissions from transportation fell 3% and from the production of cement and other building materials by 7%, while emissions from the metal industry fell 3%.
These declines are shown in the figure below. They were partially offset by rising coal and oil use in the chemical industry, up 15% and 10% respectively, which pushed up the sector’s CO2 emissions by 12% overall.
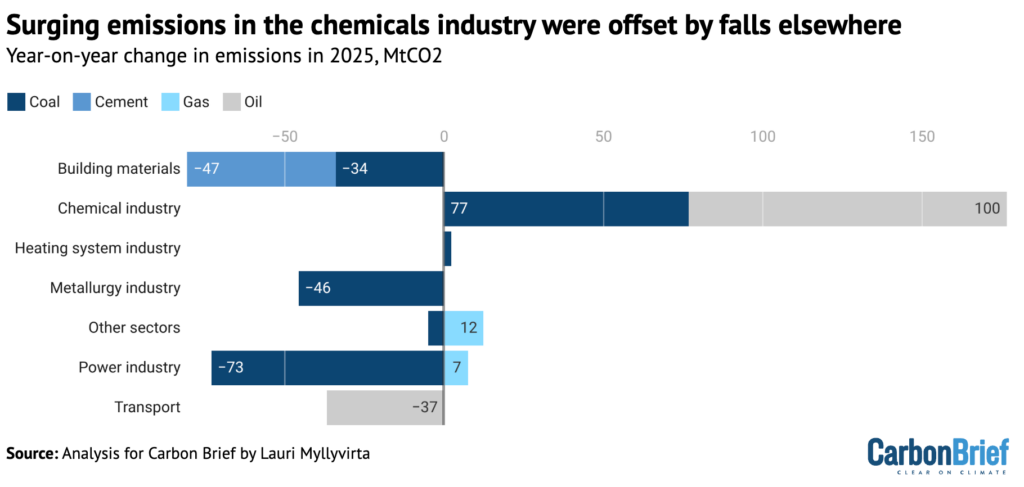
Year-on-year change in China’s CO2 emissions from fossil fuels and cement, for the period January-September 2025, million tonnes of CO2. Source: Emissions are estimated from National Bureau of Statistics data on production of different fuels and cement, China Customs data on imports and exports and WIND Information data on changes in inventories, applying emissions factors from China’s latest national greenhouse gas emissions inventory and annual emissions factors per tonne of cement production until 2024. Sector breakdown of coal consumption is estimated using coal consumption data from WIND Information and electricity data from the National Energy Administration. The consumption of petrol, diesel and jet fuel is adjusted to match quarterly totals estimated by Sinopec.
In other sectors – largely other industrial areas and building heat – gas use increased by 2%, more than offsetting the reduction in emissions from a 3% drop in their coal consumption.
Clean power covers electricity demand growth
In the power sector, which is China’s largest emitter by far, electricity demand grew by 520 terawatt hours (TWh) in 2025.
At the same time, power generation from solar increased by 43% and wind power generation by 14%, delivering 360TWh and 130TWh of additional clean electricity. Nuclear power generation grew 8%, supplying another 40TWh. The increased generation from these three sources – some 530TWh – therefore met all of the growth in demand.
Hydropower generation also increased by 3% and bioenergy by 3%, helping push power generation from fossil fuels down by 1%. Gas-fired power generation increased by 6% and, as a result, power generation from coal fell by 1.9%.
Furthermore, the surge in additions of new wind and solar capacity at the end of 2025 will only show up as increased clean-power generation in 2026.
On the other hand, the growth in solar and wind power generation has fallen short of the growth in capacity, implying a fall in capacity utilisation – a measure of actual output relative to the maximum possible. This is highly likely due to increased, unreported curtailment, where wind and solar sites are switched off because the electricity grid is congested.
If these grid issues are resolved over the next few years, then generation from existing wind and solar capacity will increase over time.
Developments in 2025 extended the trend of clean-power generation growing faster than power demand overall, as shown in the top figure below. This trend started in 2023 and is the key reason why China’s emissions have been stable or falling since early 2024.
In addition, 2025 saw another potential inflection point, shown in the bottom figure below. It was the first year ever that energy storage capacity – mainly batteries – grew faster than peak electricity demand in 2025 and faster than the average growth in the past decade.
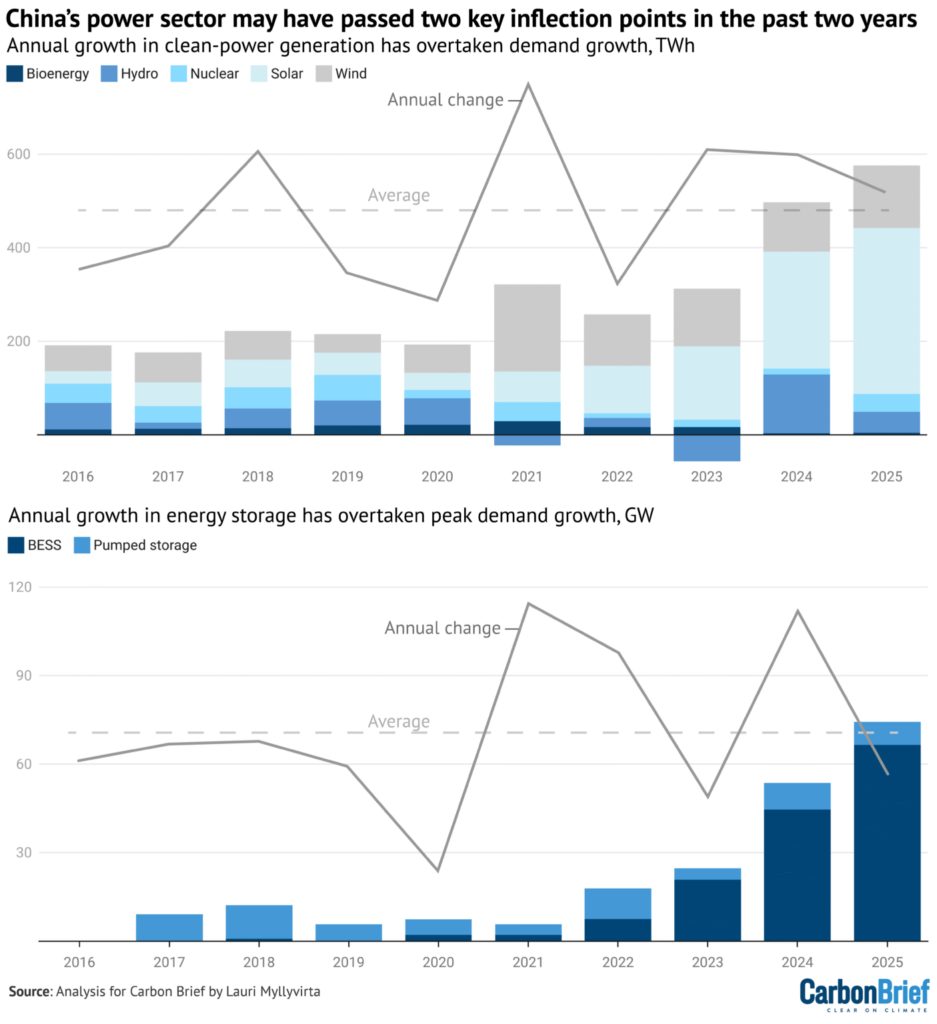
Top columns: Year-on-year change in annual electricity generation from clean energy excluding hydro, terawatt hours. Left solid and dashed line: Annual and average change in total electricity generation, TWh. Bottom columns: Year-on-year change in energy storage capacity, gigawatts. Right solid and dashed line: Annual and average change in peak electricity demand. Sources: Power generation and demand from Ember; peak loads from China Electric Power News since 2020; peak loads until 2019 and pumped hydro capacity from Wind Financial Terminal; battery storage capacity from China Energy Storage Alliance; analysis for Carbon Brief by Lauri Myllyvirta.
China’s energy storage capacity increased by 75GW year-on-year in 2025, while peak demand only increased by 55GW. The rise in storage capacity in 2025 is also larger than the three-year average increase in peak loads, some 72GW per year.
Peak demand growth matters, because power systems have to be designed to reliably provide enough electricity supply at the moment of highest demand.
Moreover, the increase in peak loads is a key driver of continued additions of coal and gas-fired power plants, which reached the highest level in a decade in 2025.
The growth in energy storage could provide China with an alternative way to meet peak loads without relying on increased fossil fuel-based capacity.
The growth in storage capacity is set to continue after a new policy issued by China’s top economic planner the National Development and Reform Commission (NDRC) in January.
This policy means energy storage sites will be supported by so-called “capacity payments”, which to date have only been available to coal- and gas-fired power plants and pumped hydro storage.
Concerns about having sufficient “firm” power capacity in the grid – that which can be turned on at will – led the government to promote new coal and gas-fired power projects in recent years, leading to the largest fossil-fuel based capacity additions in a decade in 2025, with another 290GW of coal-fired capacity still under construction.
Reforming the power system and increasing storage capacity would enable the grid to accommodate much higher shares of solar and wind, while reducing the need for new coal or gas capacity to meet rising peaks in demand.
This would both unlock more clean-power generation from existing capacity and improve the economics and risk profiles of new projects, stimulating more growth in capacity.
Peaking power CO2 requires more clean-energy growth
China’s key climate commitments for the next five-year period until 2030 are to peak CO2 emissions and to reduce carbon intensity by more than 65% from 2005 levels. The latter target requires limiting CO2 emissions at or below their 2025 level in 2030.
The record clean-energy additions in 2023-25 have barely sufficed to stabilise power-sector emissions, showing that if rapid growth in power demand continues, meeting the 2030 targets requires keeping clean-energy additions close to 2025 levels over the next five years.
China’s central government continues to telegraph a much lower level of ambition, with the NDRC setting a target of “around” 30% of power generation in 2030 coming from solar and wind, up from around 22% in 2025.
If electricity demand grows in line with the State Grid forecast of 5.6% per year, then limiting the share of wind and solar to 30% would leave space for fossil-fuel generation to grow at 3% per year from 2025 to 2030, even after increases from nuclear and hydropower.
Such an increase would mean missing China’s Paris commitments for 2030.
Similarly, China’s target of a non-fossil energy share of 25% in 2030 will not be sufficient to meet its carbon-intensity reduction commitment for 2030, unless energy demand growth slows down sharply.
This target is unlikely to be upgraded, since it is already enshrined in China’s Paris Agreement pledge, so in practice the target would need to be substantially overachieved if the country is to meet its other commitments.
If energy demand growth continues at the 2025 rate and the share of non-fossil energy only rises from 22% in 2025 to 25% in 2030, then the consumption of fossil fuels would increase by 3% per year, with a similar rise in CO2 emissions.
Still, another recent sign that clean-energy growth could keep exceeding government targets came in early February when the China Electricity Council projected solar and wind capacity additions of more than 300GW in 2026 – well beyond the government goal of “over 200GW”.
Chemical industry
The only significant source of growth in CO2 emissions in 2025 was the chemical industry, with sharp increases in the consumption of both coal and oil.
This is shown in the figure below, which illustrates how CO2 emissions appear to have peaked from cement production, transport, the power sector and others, whereas the chemicals industry is posting strong increases.
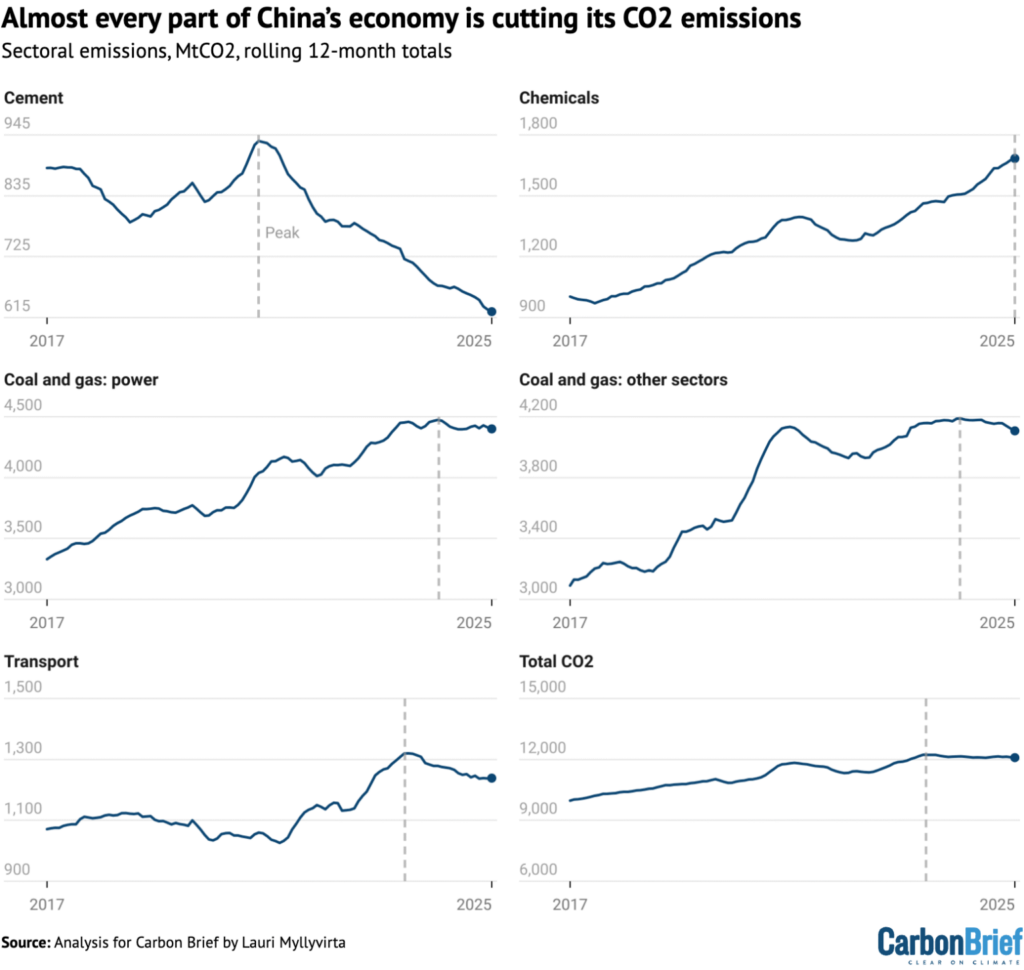
Sectoral emissions from fossil fuels and cement, million tonnes of CO2, rolling 12-month totals. Source: Emissions are estimated from National Bureau of Statistics data on production of different fuels and cement, China Customs data on imports and exports and WIND Information data on changes in inventories, applying emissions factors from China’s latest national greenhouse gas emissions inventory and annual emissions factors per tonne of cement production until 2024. Sector breakdown of coal consumption is estimated using coal consumption data from WIND Information and electricity data from the National Energy Administration.
Even though chemical-industry emissions are small relative to other sectors – at roughly 13% of China’s total – the pace of expansion is creating an outsize impact.
Without the increase from the chemicals sector, China’s total CO2 emissions would have fallen by an estimated 2%, instead of the 0.3% reported here.
Without changes to policy, emission growth is set to continue, as the coal-to-chemicals industry is planning major increases in capacity.
Whether these expansion plans receive backing in the upcoming five-year plan for 2026-30 will have a major impact on China’s emission trends.
Another key factor is the development of oil and gas prices. Production in the coal-based chemical industry is only profitable when coal is significantly cheaper than crude oil.
The current coal-to-chemicals capacity in China is dominated by plants producing higher-value – and therefore less price-sensitive – chemicals such as olefins and aromatics, as feedstocks for the production of plastics.
In contrast, the planned expansion of the sector is expected to be largely driven by plants producing oil products and synthetic gas to be used for energy. For these products, electrification and clean-electricity generation provide a direct alternative, meaning they are even more sensitive to low oil and gas prices than chemicals production.
Outlook for China’s emissions
This is the latest analysis for Carbon Brief to show that China’s CO2 emissions have now been stable or falling for seven quarters or 21 months, marking the first such streak on record that has not been associated with a slowdown in energy demand growth.
Notably, while emissions have stabilised or begun a slow decline, there has not yet been a substantial reduction from the level reached in early 2024. This means that a small jump in emissions could see them exceed the previous peak level.
China’s official plans only call for peaking emissions shortly before 2030, which would allow for a rebound from the current plateau before the ultimate emissions peak.
If China is to meet its 2030 carbon intensity commitment – a 65% reduction on 2005 levels – then emissions would have to fall from the peak back to current levels by 2030.
Whether China’s policymakers are still committed to meeting this carbon intensity pledge, after the setbacks during the previous five-year period, is a key open question. The 2030 energy targets set to date have fallen short of what would be required.
The most important signal will be whether the top-level five-year plan for 2026-30, due in March, sets a carbon intensity target aligned with the 2030 Paris commitment.
Officially, China is sticking to the timeline of peaking CO2 emissions “before 2030”, which was announced by president Xi Jinping in 2020.
According to an authoritative explainer on the recommendations of the Central Committee of the Communist Party for the upcoming five-year plan, published by state-backed news agency Xinhua, coal consumption should “reach its peak and enter a plateau” from 2027.
It says that continued increases in demand for coal from electricity generators and the chemicals industry would be offset by reductions elsewhere. This is despite the fact that China’s coal consumption overall has already been falling for close to two years.
The reference to a “plateau” in coal consumption indicates that in official plans, meaningful absolute reductions in emissions would have to wait until after 2030. Any increase in coal consumption from 2025 to 2027, before the targeted plateau, would need to be offset by reductions in oil consumption, to meet the carbon intensity target.
Moreover, allowing coal consumption in the power sector to grow beyond the peak of overall coal use and emissions implies slowing down China’s clean-energy boom. So far, the boom has continued to exceed official targets by a wide margin.
In addition, the explainer’s expectation of further growth in coal use by the chemicals industry indicates a green light for at least a part of its sizable expansion plans.
The Xinhua article recognises that oil product consumption has already peaked, but says that oil use in the chemicals industry has kept growing. It adds that overall oil consumption should peak in 2026.
Elsewhere, the article speaks of “vigorously” developing non-fossil energy and “actively” developing “distributed” solar, which has slowed down due to recent pricing policies.
Yet it also calls for “high-quality development” of fossil fuels and increased efforts in domestic oil and gas production, suggesting that China continues to take an “all of the above” approach to energy policy.
The outcome of all this depends on how things turn out in reality. The past few years show it is possible that clean energy will continue to overperform its targets, preventing growth in energy consumption from fossil fuels despite this policy support.
The key role of the clean-energy boom in driving GDP growth and investments is one key motivator for policymakers to keep the boom going, even when central targets would allow for a slowdown. It is also possible that the five-year plans of provinces and state-owned enterprises could play a key role in raising ambition, as they did in 2022.
About the data
Data for the analysis was compiled from the National Bureau of Statistics of China, National Energy Administration of China, China Electricity Council and China Customs official data releases, as well as from industry data provider WIND Information and from Sinopec, China’s largest oil refiner.
Electricity generation from wind and solar, along with thermal power breakdown by fuel, was calculated by multiplying power generating capacity at the end of each month by monthly utilisation, using data reported by China Electricity Council through Wind Financial Terminal.
Total generation from thermal power and generation from hydropower and nuclear power were taken from National Bureau of Statistics monthly releases.
Monthly utilisation data was not available for biomass, so the annual average of 52% for 2023 was applied. Power-sector coal consumption was estimated based on power generation from coal and the average heat rate of coal-fired power plants during each month, to avoid the issue with official coal consumption numbers affecting recent data.
CO2 emissions estimates are based on National Bureau of Statistics default calorific values of fuels and emissions factors from China’s latest national greenhouse gas emissions inventory, for the year 2021. The CO2 emissions factor for cement is based on annual estimates up to 2024.
For oil, apparent consumption of transport fuels – diesel, petrol and jet fuel – is taken from Sinopec quarterly results, with monthly disaggregation based on production minus net exports. The consumption of these three fuels is labeled as oil product consumption in transportation, as it is the dominant sector for their use.
Apparent consumption of other oil products is calculated from refinery throughput, with the production of the transport fuels and the net exports of other oil products subtracted. Fossil-fuel consumption includes non-energy use such as plastics, as most products are short-lived and incineration is the dominant disposal method.
Here are some “ETs” recorded from around the U.S. the last couple of days, their consequences, and some extreme temperature outlooks, as well as any extreme precipitation reports:
Here is More Climate News from Saturday:
(As usual, this will be a fluid post in which more information gets added during the day as it crosses my radar, crediting all who have put it on-line. Items will be archived on this site for posterity. In most instances click on the pictures of each tweet to see each article. The most noteworthy items will be listed first.)