The main purpose of this ongoing blog will be to track global extreme or record temperatures related to climate change. Any reports I see of ETs will be listed below the main topic of the day. I’ll refer to extreme or record temperatures as ETs (not extraterrestrials).😜
Main Topic: Scientific Atmospheric Proof That Climate Is Changing for Australia
Dear Diary. Over the past decade we have witnessed horrible heat waves with associated drought and bush or wildfires across portions of Australia. The climate is changing for the worse there, but is there proof that the jet stream is changing, which is causing drier and hotter conditions at the surface, particularly over southern Australia? The answer to that question is yes.
Here are details from the Conversation:
Dramatic changes in upper atmosphere are responsible for recent droughts and bushfires: new research
Dramatic changes in upper atmosphere are responsible for recent droughts and bushfires: new research
Published: February 19, 2026 2:12pm EST

Authors:
Lance M Leslie Professor, School of Mathematical And Physical Sciences, University of Technology Sydney
Milton Speer Visiting Fellow, School of Mathematical and Physical Sciences, University of Technology Sydney
Over the past decade, southern Australia has suffered numerous extreme weather and climate events, such as record-breaking heatwaves, bushfires, two major droughts and even flash flooding.
While Australia has always had these disasters, our research reveals these new extremes are the result of dramatic climate-driven changes in the upper atmosphere above Australia.
Eight to ten kilometres above the ground, the fast-flowing jet stream air currents have shifted further southwards, dragging rain-bearing winter weather systems away from Australia’s southern coastline.
This means southern Australia has experienced at least 25% less annual rainfall and is currently gripped by a continuing drought. Our findings should be a wake-up call for governments, primary producers and residents of some of Australia’s largest cities: the hotter, drier weather is here to stay.
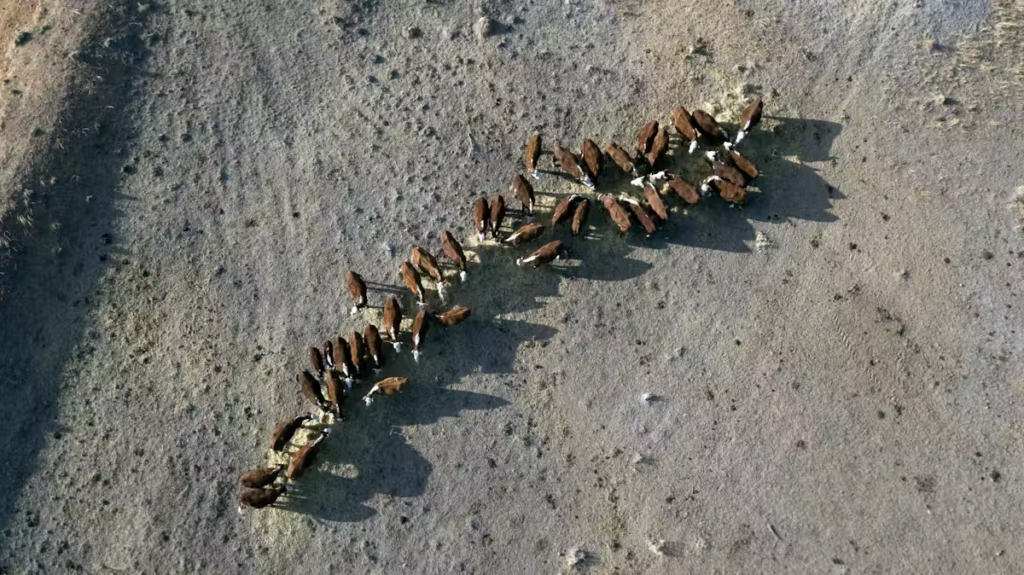
An aerial view of cattle eating from a fresh hay bale at a farm near Cootamundra, NSW, which is officially in drought. Mick Tsikas/AAP
Drought in the south, wet in the east
Southern Australia comprises the coastal and adjacent areas in the south of the continent, stretching about 4,000 kilometres from Perth to east of Melbourne. This region is home to ten million people, or about 35% of Australia’s population.
The two most recent droughts in southern Australia were the Tinderbox drought, from 2017 to 2019, and the present drought, which has not been named. It began in 2023 and is continuing into February 2026.
Drought is primarily a meteorological, or weather-related, phenomenon. It is defined by intense rainfall deficiencies over three months or longer, which severely impact agricultural production, water supplies and ecosystems.
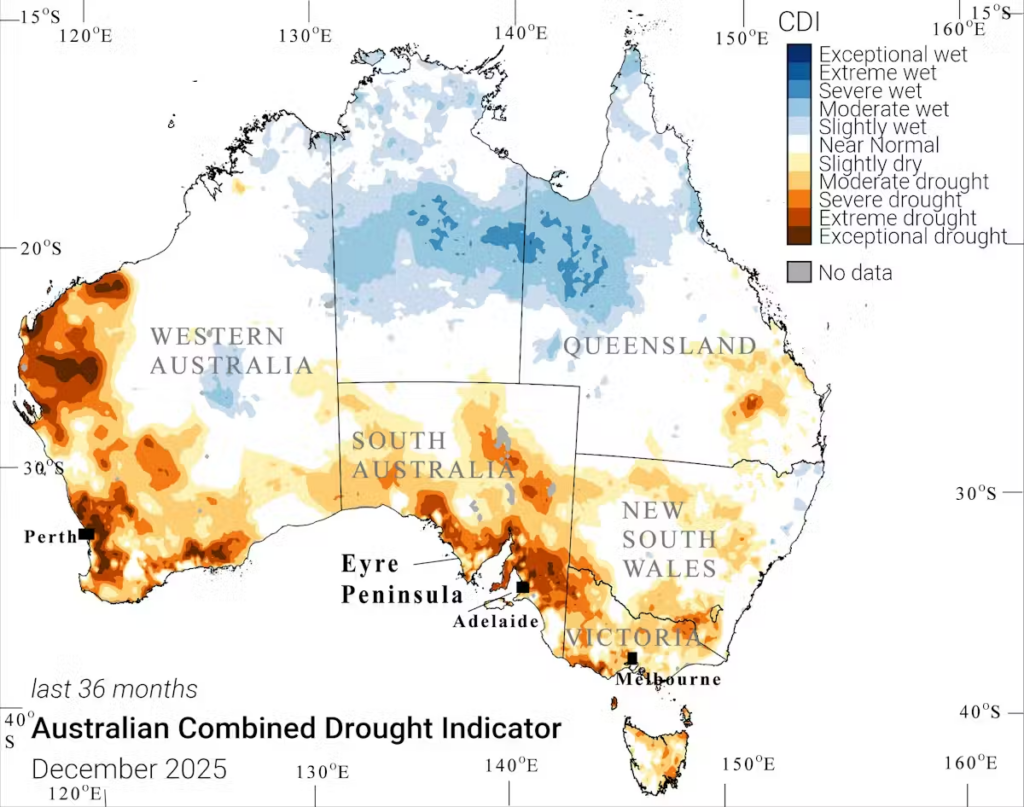
Notably, six of the past ten years were dry, tipping much of southern Australia into drought. In marked contrast, eastern Australia, including Sydney and Brisbane, experienced moderate to extreme wet conditions, including flash flooding. The map below shows drought in southern Australia in 2023–25.
The meteorological factors that drive drought in southern Australia, and the shift from dry to wet conditions in eastern Australia, can be explained by shifts in the upper atmospheric jet streams. These are fast-flowing, narrow air currents high in the atmosphere, about 8–10km above Earth.
Major changes to the jet streams
Our research reveals dramatic changes to the jet streams in the Australian region, particularly in the past decade. Put simply, jet streams are fast-moving belts of westerly winds in the upper atmosphere. They steer cold fronts and low-pressure systems across southern Australia, from west to east, determining rainfall and temperature patterns.
In the Australian region there is a subtropical jetstream over northern Australia and a polar jet stream in the mid-latitude westerly winds south of Australia. Historically, the jetstreams have steered the rain-bearing systems over southern Australia.
We discovered the subtropical jet stream, which brings rainy weather systems, has shifted about 10 degrees of latitude (roughly 1,000km) southwards towards the pole, since 2015.
This shift has caused traditional rain-producing weather systems to track south of the continent, completely missing southern Australia. Our previous research comparing 1965 to 1992, and 1993 to 2020, also showed the jet streams had shifted towards Antarctica.
This shift is due to climate change from increased greenhouse gas emissions that continues to warm the oceans and atmosphere. As the world keeps warming, the jet streams will be pushed further poleward.
Hence the jet stream changes are responsible for both the current drought, and the Tinderbox Drought (2017–19). Each drought was caused by below-average winter rainfall from April to October. And the greatest relocation of Australian region jet streams occurred in the past decade.
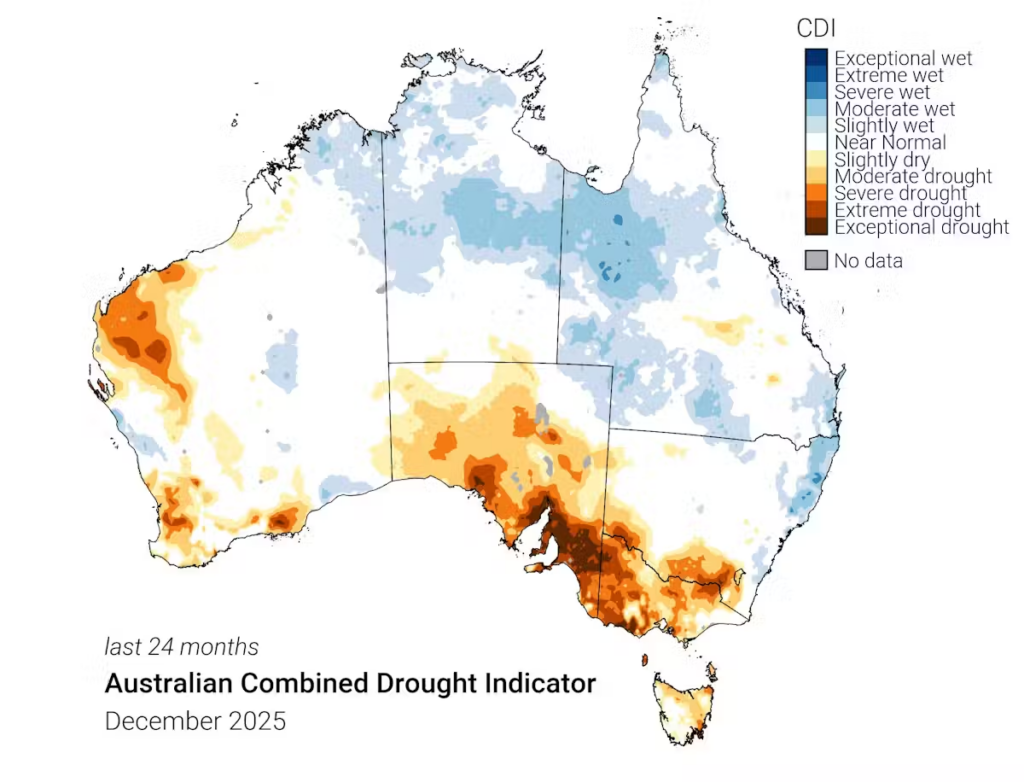
This map shows the past 24 months of drought. Northern Australia Climate Program
Where were the droughts?
Between 2023 and 2025, almost all of southern Australia experienced a serious to extreme lack of rain, causing severe to exceptional drought conditions. Drought has affected Melbourne, Adelaide and Perth, straining existing water supplies.
Brief winter rainfall in July 2025 provided some local relief, however, the impact was short-lived. Recently, the summer months from December 2025 to February 2026 brought extreme heat and record low rainfall. Consequently, drought continues into January and February 2026. In striking contrast, parts of eastern and northern Australia received record rainfall and flash floods.
In southern Australian, coastal and inland areas, river systems and dams are experiencing greatly reduced water supplies. This reflects the continuing long-term impacts of global warming.
In Adelaide, three extremely dry years have reduced water inflows to reservoirs. The city’s single desalination plant quadrupled its output from January last year, to meet demand. Perth has experienced a long-term rainfall decline since 1970. It has two desalination plants and is building a third.
After briefly recovering during the La Niña years from 2021 to 2023, Melbourne’s dams are at their lowest levels since the Tinderbox Drought. Melbourne received well below average rainfall through to October 2025. Its desal plant was activated briefly in 2022, and was reactivated in April 2025. A second Melbourne plant is planned, but will take almost a decade to complete.
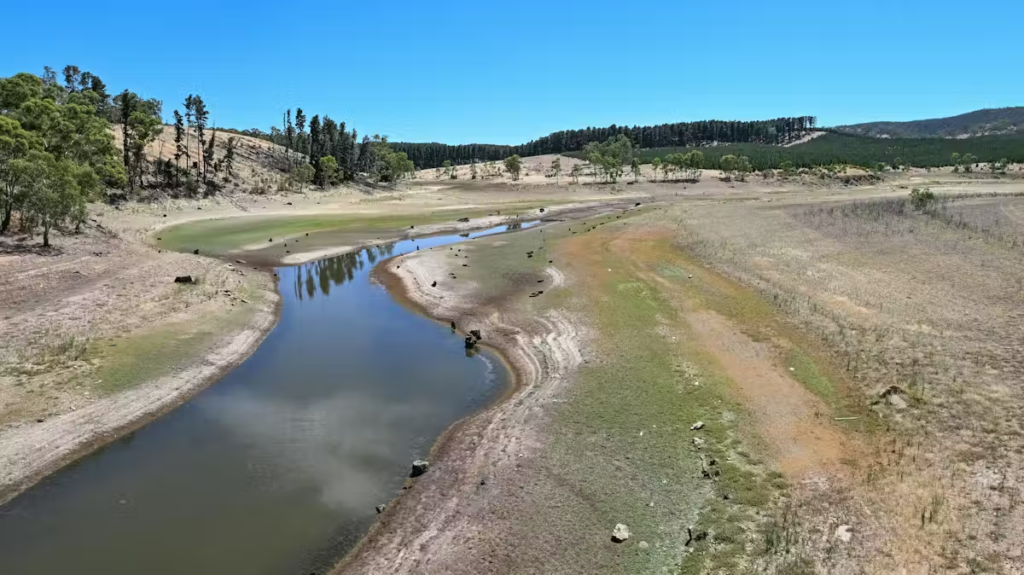
Low water levels in South Australia’s second largest reservoir, the South Para Reservoir, northeast of Adelaide. Michael Errey/AAP
Primed to burn
Droughts and low winter rainfall means southern Australia is very susceptible to bushfire. Heatwaves and dry vegetation at the beginning of this summer brought catastrophic bushfire conditions, bolstered by dry, westerly wind changes. This caused catastrophic bushfires in southern Australia. More than 430,000 hectares have been burned in Victoria.
These conditions should be a jolting wakeup call. A possible El Niño, or warming climate pattern, later in 2026 is likely to worsen existing drought conditions in southern Australia. Melbourne’s water storage is at 70% capacity and is in danger of falling much lower. Southern Australia needs to ready itself for a hot, dry year
Here are some “ETs” recorded from around the U.S. the last couple of days, their consequences, and some extreme temperature outlooks, as well as any extreme precipitation reports:
Here is More Climate News from Tuesday:
(As usual, this will be a fluid post in which more information gets added during the day as it crosses my radar, crediting all who have put it on-line. Items will be archived on this site for posterity. In most instances click on the pictures of each tweet to see each article. The most noteworthy items will be listed first.)