The main purpose of this ongoing blog will be to track planetary extreme, or record temperatures related to climate change. Any reports I see of ETs will be listed below the main topic of the day. I’ll refer to extreme or record temperatures as ETs (not extraterrestrials).😜
Main Topic: 2026 So Far Has Been the Hottest and Driest in U.S. History
Dear Diary. Before moving into other items, it’s time to put the cherry on top of our rancidly hot cake due to climate change. Not only has 2026 been the warmest year so far (with March being extremely warm as shown in yesterday’s post), but it has been the driest as well. Warmth and drought do go hand in hand.
You can see the warmth through one of my record ratio charts:
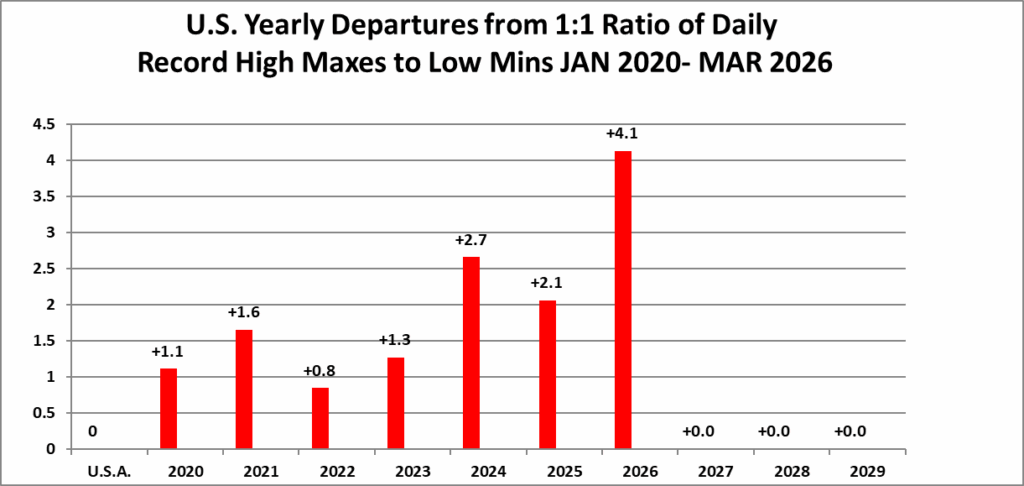
Prior to 2026 the year with the highest ratio of DHMX to DLMN was 2024, which was the last year influenced by a strong El Niño. That ratio is spiking in 2026 so far. Will this trend continue? More than likely but stay tuned.
Here is another great summary from my friend Bob Henson with specifics on 2026’s warm and dry conditions:
The year so far: hottest and driest in U.S. history » Yale Climate Connections
The year so far: hottest and driest in U.S. history
After a season-defying March heat wave pushed things into overdrive, it’s an open question – and a crucial one – how soon more generous moisture might arrive.

by Bob Henson
April 8, 2026
People walk among the cherry blossom trees in the Tidal Basin of Washington, D.C., on March 30, 2026. Peak bloom arrived on March 26 and has ranged between March 15 (1990) and April 18 (1958). Despite some sharp cold spells, last month ended up as the eighth warmest March in 155 years of D.C. recordkeeping. (Photo by Anna Moneymaker/Getty Images)
Last month was the warmest March in records for the contiguous United States in national-scale data going back 132 years, according to NOAA’s monthly U.S. climate summary issued on April 8. The crowning event was a two-week heat wave that smashed thousands of daily and monthly heat records at hundreds of locations around the country.
March’s average 48-state temperature of 50.85 degrees Fahrenheit (10.47°C) came in ahead of the 50.40°F set in March 2012 – a month that itself featured an unprecedented March “warm wave.” The main difference was that March 2012’s warmth was centered toward the Midwest and Northeast, whereas the heat in 2026 was focused toward the Southwest. So even though the departures from average (anomalies) were comparable in both events, the hotter starting-point climate of the Southwest allowed readings to soar well above 90°F in many places and above 100°F in more than a few spots. (See our detailed post of April 3, where we ranked these heat waves as two of the six most astounding global climate events of this century thus far.)
Astonishingly, the 48-state U.S. average temperature was not only the hottest on record for March: the average is also the hottest on record for all intervals (2-month, 3-month, etc.) going all the way back to the 12-month period from April 2025 through March 2026. The same holds true for the past 18-, 24-, 36-, and 48-month periods, as depicted in the Climate at a Glance plotting tool from NOAA’s National Centers for Environmental Information.
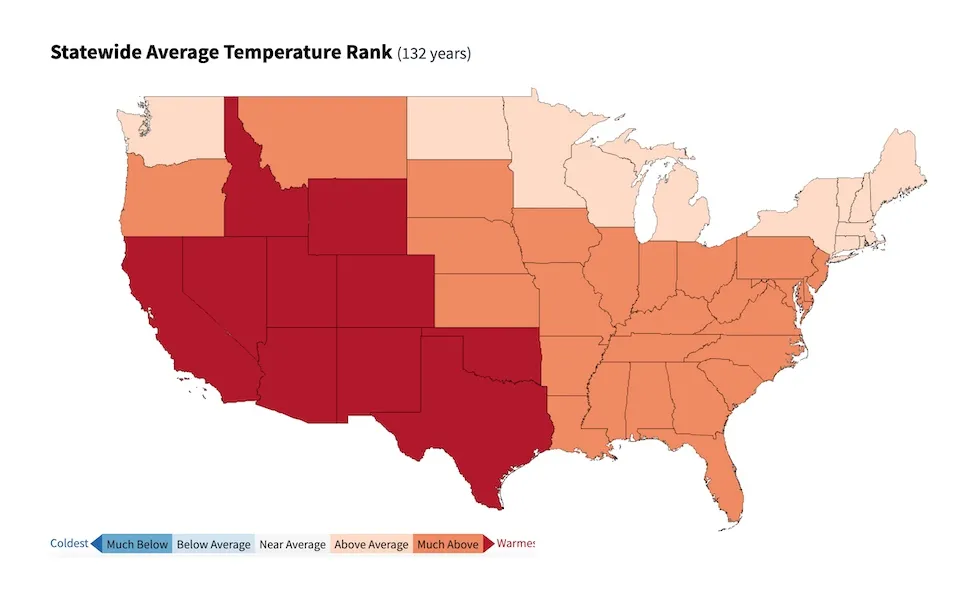
Figure 1. Statewide average temperature rank for March 2026 across the 132 years of national data going back to 1895. States in dark red had their warmest March on record. (Image credit: NOAA/NCEI)
Ten U.S. states from the Southern Plains across the Rockies to California and the Desert Southwest had their warmest March averages on record (see Fig. 1 above). Each of those states also had its hottest single-location, single-day March temperature on record, as did seven other states in the Plains and Midwest, as shown in Fig. 2 below.
In 35 of the 48 contiguous states, the statewide average reading was among the top-ten warmest for any March. Not a single contiguous state was cooler than average. (Much of this winter’s cold in North America has stayed bottled up in Canada and Alaska. Though not included in the contiguous U.S. report, Alaska had its fourth coldest March on record and its 14th coldest Jan-to-Mar period.)
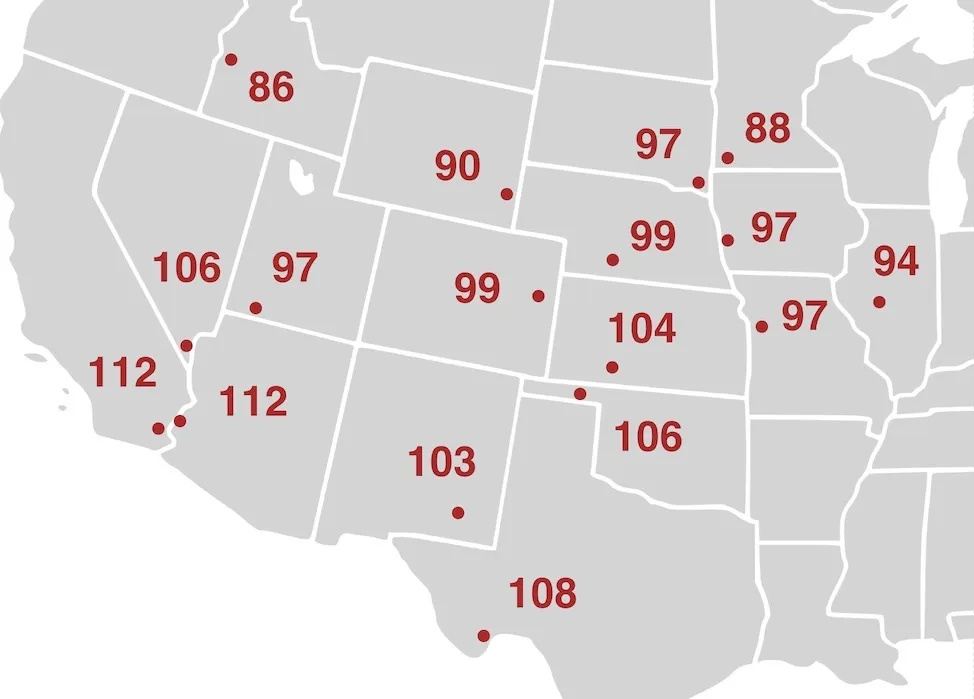
Figure 2. The 17 states where March 2026 tied or exceeded the highest single-location daily high temperature ever officially observed in any March in that state.
Below is how the heat records from U.S. observing sites, based on daily highs (maxima) and lows (minima) stacked up for March 2012 and March 2026, based on data from NOAA’s U.S. Daily Records website compiled and analyzed by meteorologist Guy Walton (guyonclimate.com). According to Walton, last month produced more monthly heat records for both maxima and minima than any other month in the NOAA database.
Since it takes a while for all reports to come in for a month just ended, notes Walton, “I wouldn’t be surprised if daily totals for March 2026 end up surpassing daily totals for March 2012.”
Record type March 2012 March 2026
Daily warm-max records: 13,208 12,347
Daily warm-min records: 12,867 10,197
Monthly warm-max records: 1066 2596
Monthly warm-min records: 1016 1263
The widespread U.S. warmth has given plants across much of the country a startlingly early start. Trees and shrubs have been leafing out three to four weeks ahead of average over parts of the Central Plains, including Denver, and much of the South has seen blossoms emerging 10 to 20 days earlier than usual.
A distressingly dry March and year to date
Last month was the sixth driest March in 48-state U.S. history, according to NOAA, with a national average of 1.83 inches (46.5 millimeters). The only drier March in this century so far was in 2013.
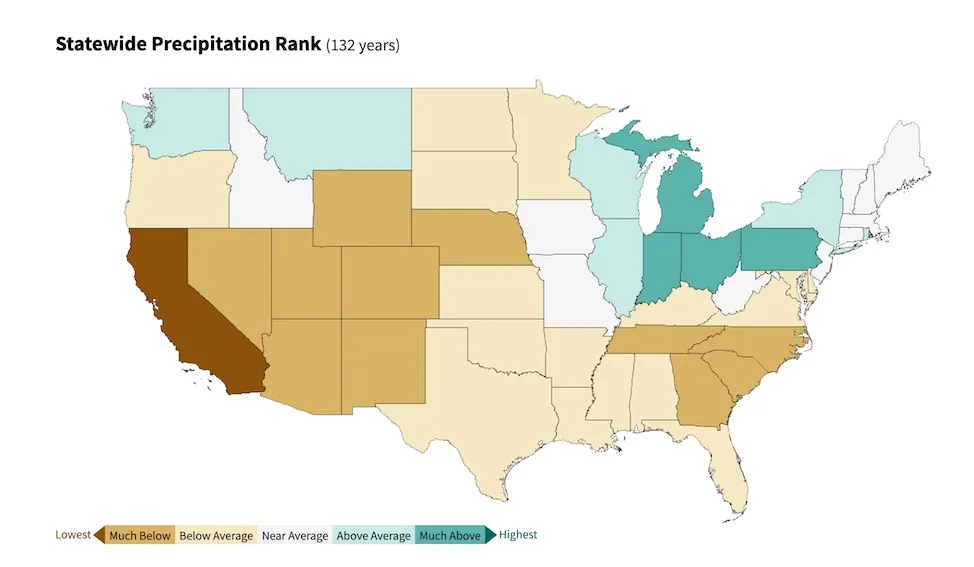
Figure 4. Statewide average precipitation rank for March 2026 across the 132 years of national data going back to 1895. (Image credit: NOAA/NCEI)
As is often the case, the precipitation map for March is quite varied. California was record-dry, and eight other states had a top-ten-driest March (Colorado, Nebraska, Nevada, New Mexico, North Carolina, Tennessee, and Utah). The only wetter-than-average states were Washington and Montana, along with a handful of others from the Great Lakes to the Northeast. Michigan had its third-wettest March on record, but no other states had a top-ten wettest March.
The nationally averaged precipitation total for 2026 to date (see Fig. 5 below) is an ominous one: a mere 4.79 inches. That’s the lowest value on record for any January-to-March interval, including such notoriously dry periods as the Dust Bowl of the 1930s. The previous record low was 5.27 inches, set in Jan.-Mar. 1910.
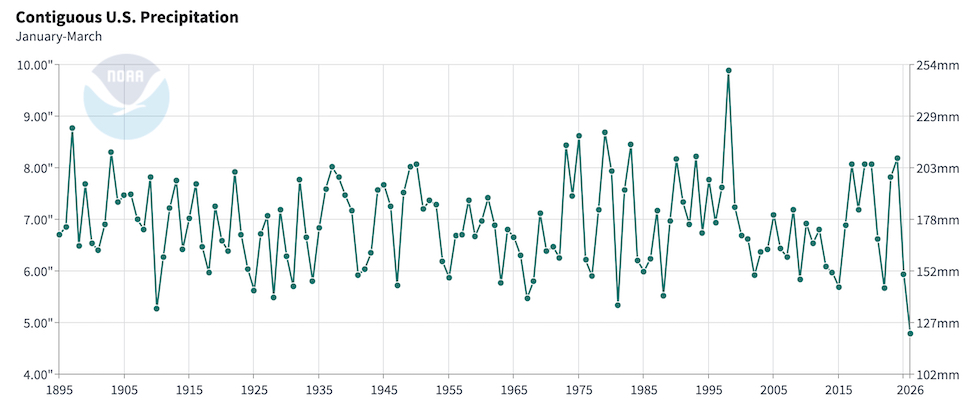
Figure 5. Precipitation averaged across the contiguous U.S. for the first quarter of each year (Jan.-Mar.) going back to 1895. (Image credit: NOAA/NCEI)
The combined effects of the record warmth and record-low precipitation for the year thus far have pushed more than 80% of the contiguous U.S. into abnormal dryness or drought, according to the U.S. Drought Monitor. Across the 26 years since the Drought Monitor began, only 12 other weeks have seen this extent of national dryness (D0-D4 on the Drought Monitor scale). As of April 7, more than a third of the country (34.68 percent) was in severe to exceptional drought (D2-D4) – a jump of 5 percent in just one week.
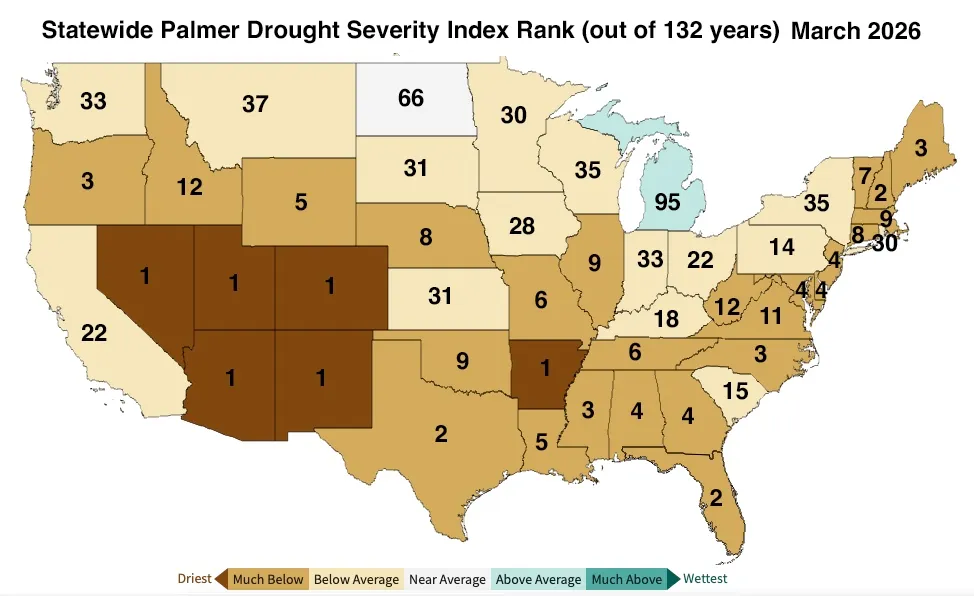
Figure 6. Palmer Drought Severity Index (PDSI) by state in March 2026. Six states experienced their most severe March droughts on record, with 22 others experiencing a top-10 worst March drought on record. Only Michigan had an above-average lack of drought. The Palmer index incorporates both temperature and precipitation to estimate the overall moisture deficit affecting agriculture, ecosystems, and water storage. PDSI is an integrative measure of drought, so the numbers take into account dryness over multiple months. (Image credit: NOAA).
Wetter times may lie ahead – but how soon?
There are increasing signs that a strong El Niño event will be taking shape over the next few weeks and months (see our post from April 6). If so, that could help bring much-needed moisture across the U.S. Sunbelt, especially toward fall and into winter. El Niño’s effects on U.S. climate are more muted during summer, but the April seasonal forecasts from the North American Multi-Model Ensemble models (NMME) project above-average precipitation spreading across much of the United States by late summer (August-October). Shorter-range models depict some hope of moisture for California over the next week or two.
Seasonal forecasting skill remains limited, especially during the summer months, but this at least offers some hint of potential relief – albeit not soon enough to address what could be major wildfire, agriculture, and water-supply problems from later this spring into early summer.
Jeff Masters contributed to this post.

Bob Henson
Bob Henson is a meteorologist and journalist based in Boulder, Colorado. He has written on weather and climate for the National Center for Atmospheric Research, Weather Underground, and many freelance… More by Bob Henson
Bob Henson’s “The year so far: hottest and driest in U.S. history” was first published on Yale Climate Connections, a program of the Yale School of the Environment, available at: http://yaleclimateconnections.org. This work is licensed under a Creative Commons Attribution-Noncommercial-No Derivative Works 2.5 license (CC BY-NC-ND 2.5).
Here are some “ETs” recorded from around the U.S. the last couple of days, their consequences, and some extreme temperature outlooks, as well as any extreme precipitation reports:
Here is More Climate News from Thursday:
(As usual, this will be a fluid post in which more information gets added during the day as it crosses my radar, crediting all who have put it on-line. Items will be archived on this site for posterity. In most instances click on the pictures of each tweet to see each article. The most noteworthy items will be listed first.)