The main purpose of this ongoing blog will be to track planetary extreme, or record temperatures related to climate change. Any reports I see of ETs will be listed below the main topic of the day. I’ll refer to extreme or record temperatures as ETs (not extraterrestrials).😜
Main Topic: U.S. Average Temperature Forecast for Fall 2026
Dear Diary. It will be the start of meteorological fall by September 1st, so once again as we do on this blog, it is time to make a forecast for the coming season. As forecast, Summer 2026 had well above average temperatures for the lower 48 states, another sign of anthropogenic climate change.
At the very start of fall, it’s time for me to make another attempt at a forecast for average seasonal temperatures in the U.S. This forecast will be very broad and not specific for any one state, comprising the continental United States (or lower 48 states).
So how did the forecast work out for Summer 2026? Here is a link to the post for that forecast:
By September 10th the National Center for Environmental Information will finish their climatological assessment for Summer 2026, so our verification is not complete as of August 30th. Let’s do fill in ranking numbers with 1 being the coldest and 132 warmest for a verification for months during 2026, which have already been assessed:
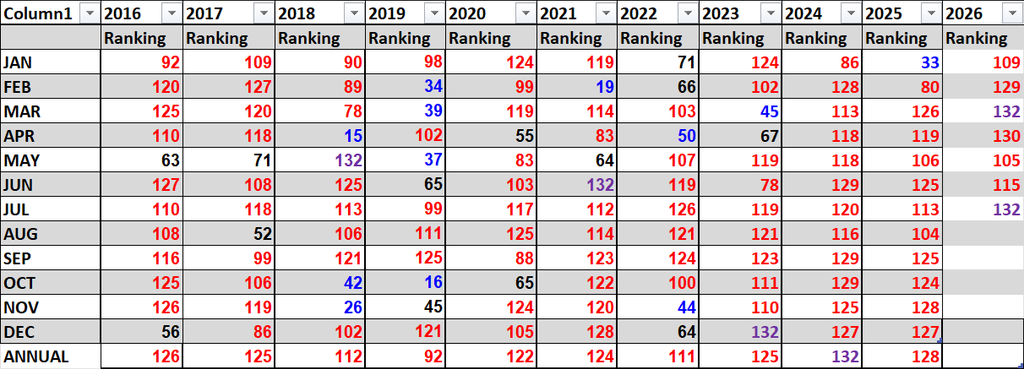
Summer 2026 will be at least a top 5 ranked summer since 1895 looking at numbers coming for June and July and the fact that August has been well above average so far. July was the hottest month in U.S. history. I suspect that Summer 2026 will get pegged as the hottest on record. A raking of 132 would be the warmest ranking out of 132 years of lower 48 rankings since 1895.
Here are my two cents for a broad, rough forecast for the U.S. for Fall 2026, which I guarantee to be cooler than this past summer, of course, as the amount of daylight decreases across the Northern Hemisphere.
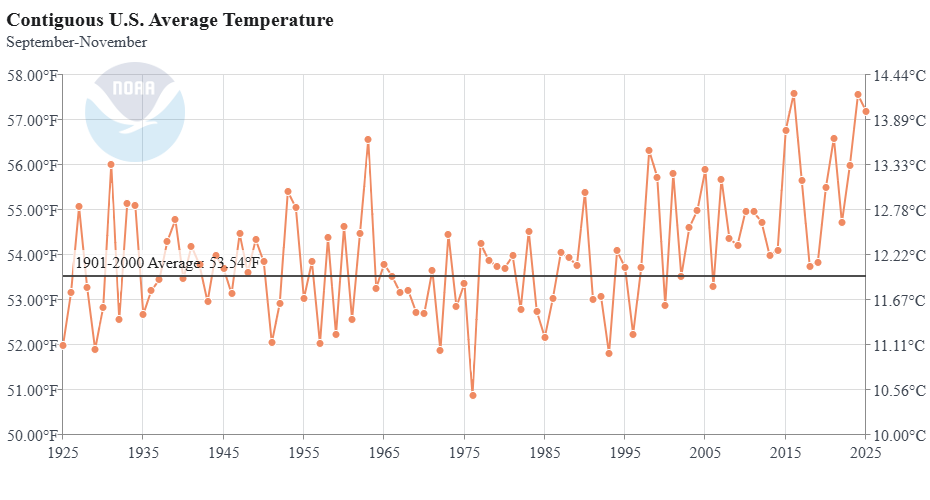
First, I like to look at spikes on graphs because they can tell us something. Last year we had a slight downtick in temperature averages last fall, but as one can see, the overall trend is for warmth. Looking at trends, there should be a very slight uptick from 2026:
Second, I like to look at water temperature anomalies surrounding North America just before the start of a season to get a sense of how much potential anomalous heat can be added to the atmosphere across the continent. Here is what we see:
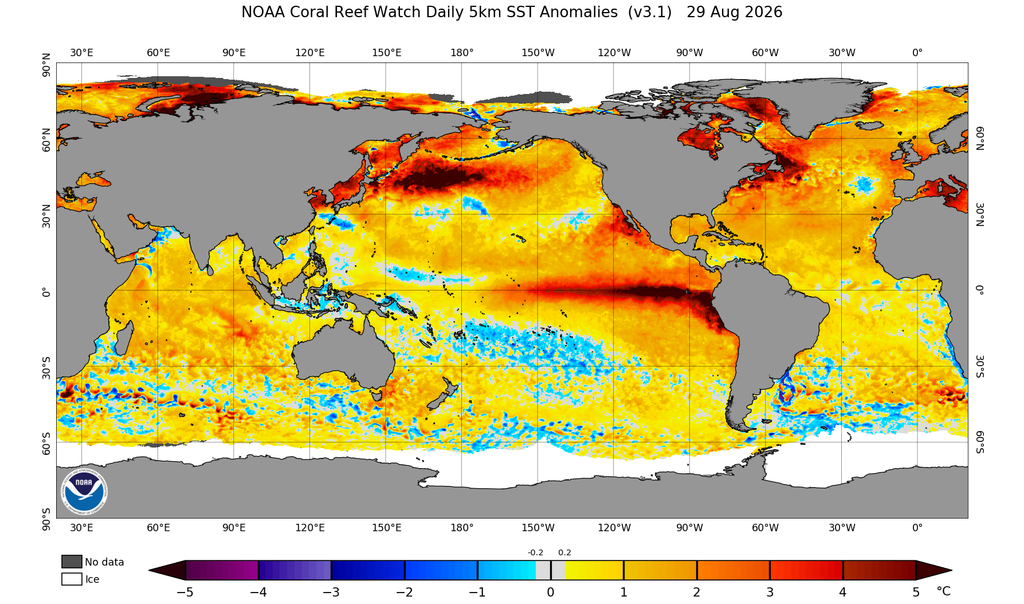
Anomalously warm seas surround all of North America. This leads me to think that SST influence will be a positive factor for this coming season. Also, looking at the current ENSO in the Pacific, we now have a very strong El Niño. That will definitely warm global temperatures. This also usually means that the polar vortex over Canada will get weaker relative to average with time. This should be a warming factor this season.
We do note that the first two weeks of September will be warm across most of the United States except the far West, so fall will get off to a very warm start.
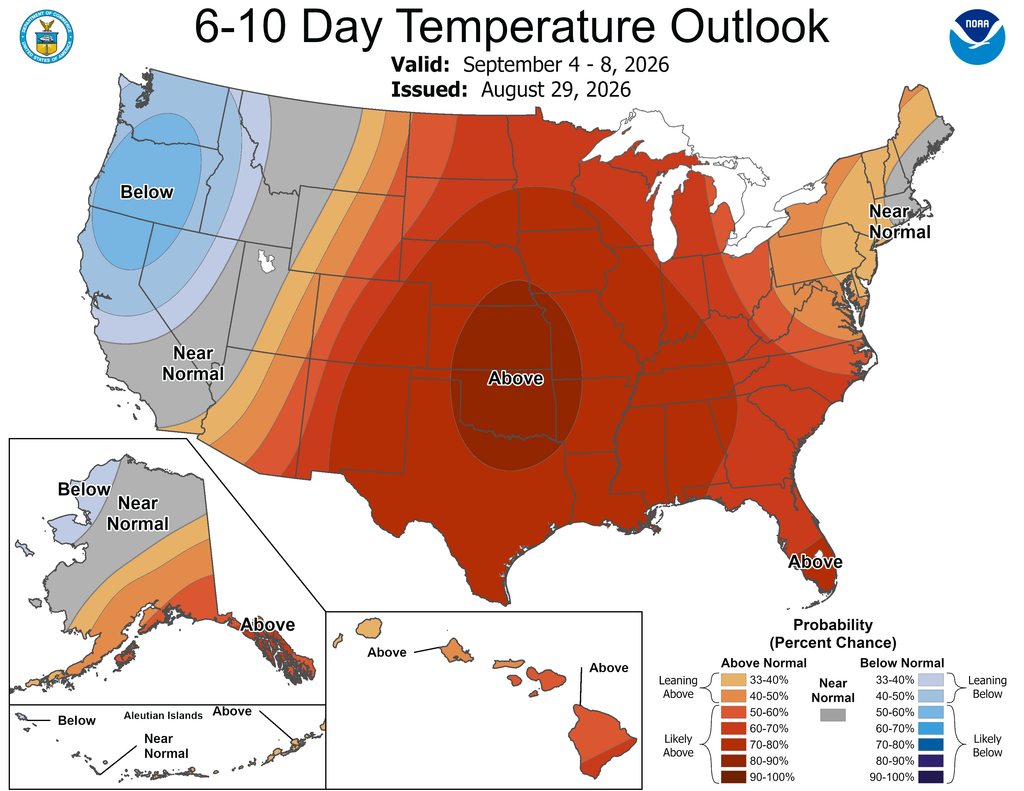
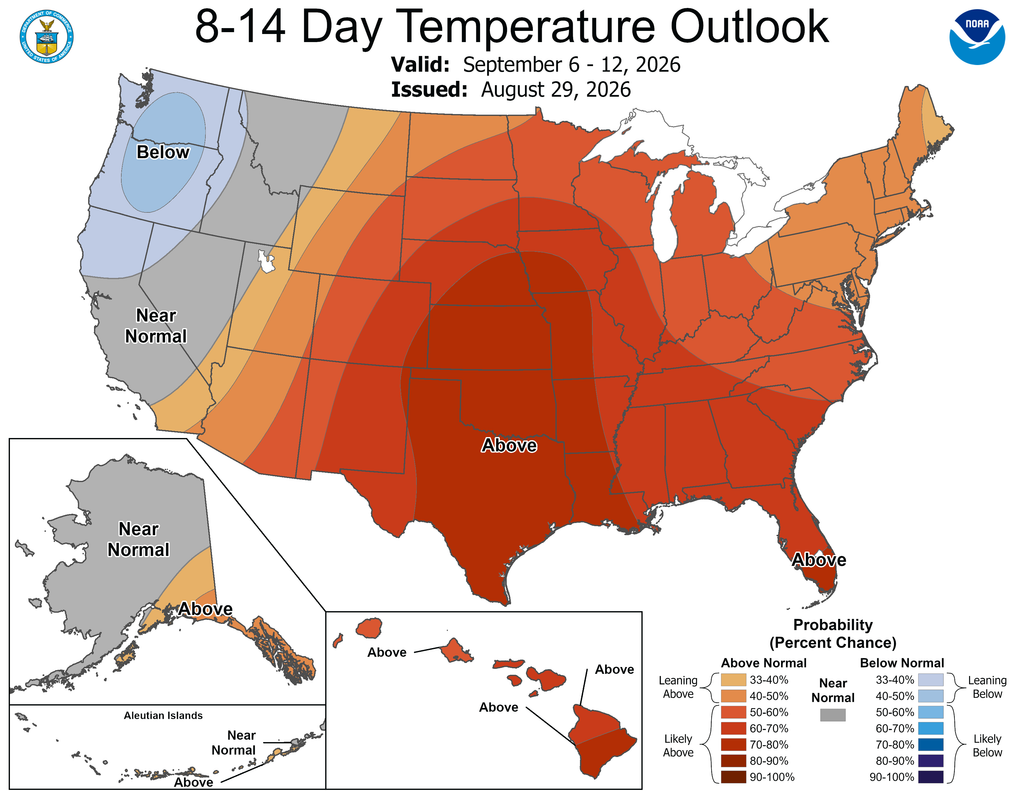
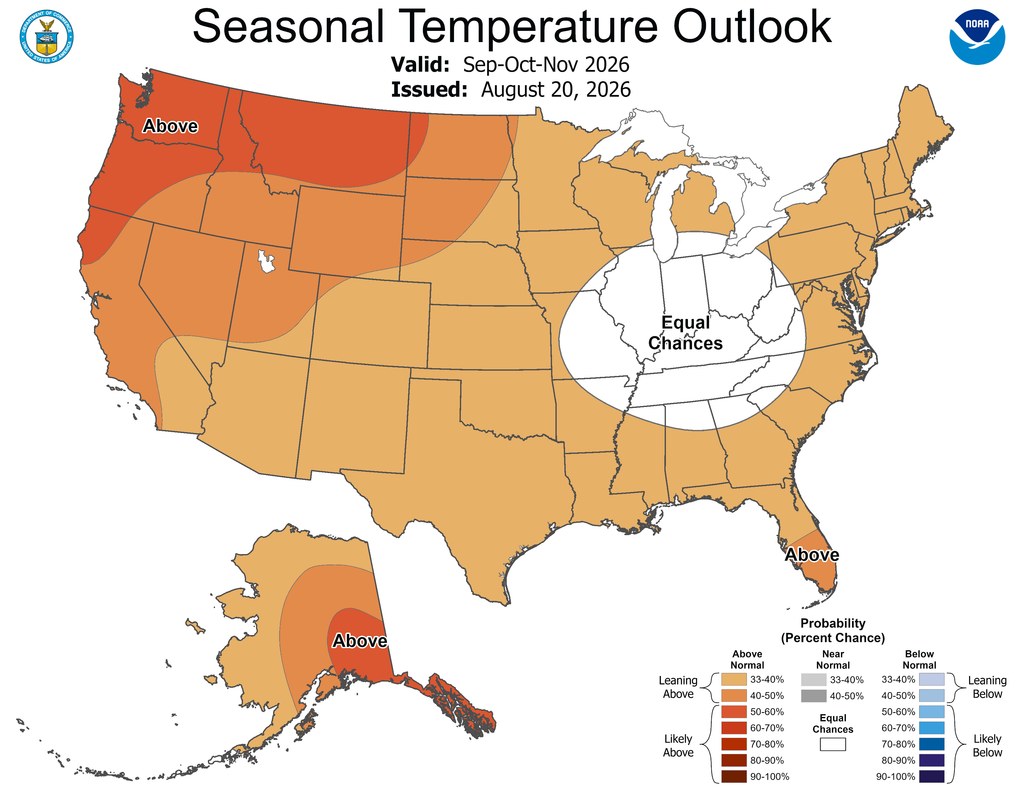
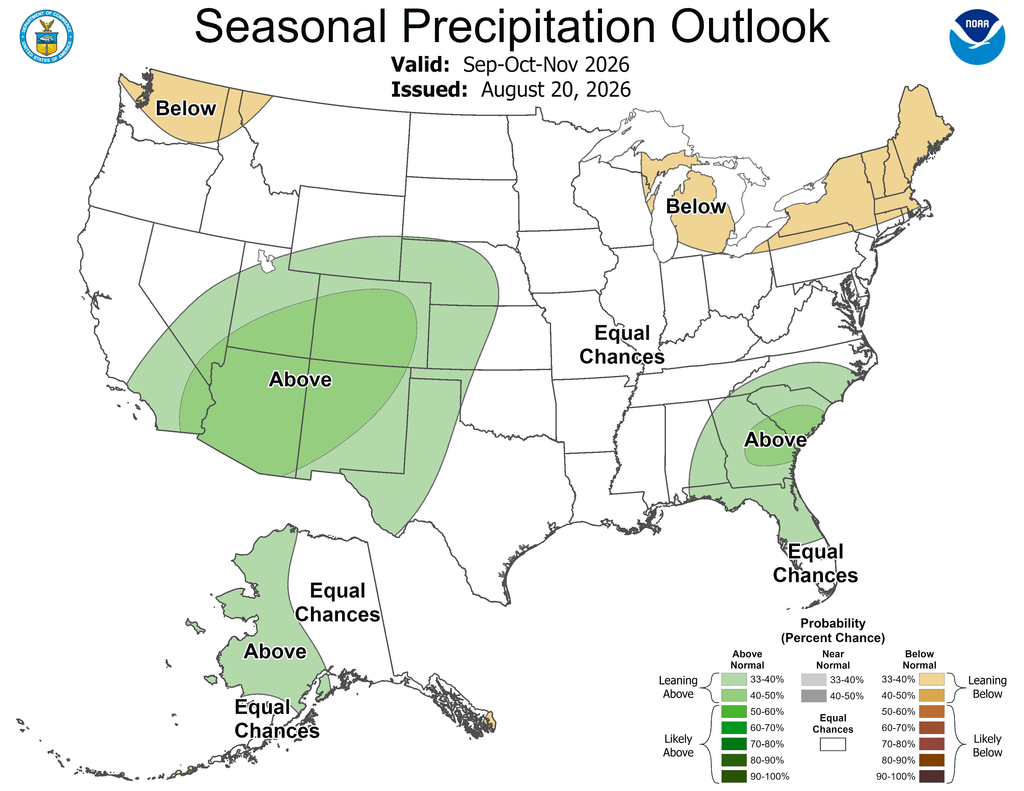
I can’t disagree with the NWS forecast much here except that we might not see an average hole over the Midwest.
Next, we can get another clue looking at prior National Center for Environmental Information ranking and temperature record count data. For this I like to drag out my “Record Scoreboard” (updated through 08/25/2026):
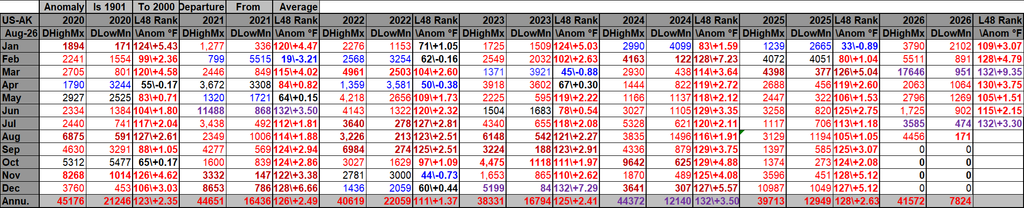
For these data sets all monthly ratios of > 10 to 1 DHMX to DLMN or > 10 to 1 DLMN to DHMX are in bold type. The rankings are for the lower 48 states with the warmest ranking since 1895 of average temperatures being 132 and 1 being the coldest as of 2026. Blue colors represent cold months and red warm. Those months and years with counts close to a 1 to 1 ratio of highs to lows are colored black. Boldly red-, blue-, or purple-colored months, such as January 2020 and October 2024, have ratios of >10 to 1 daily record highs to lows or <1 to 10 daily record highs to lows, and are either historically hot or cold, most of which have made news. All-time record hot or cold ranked months are highlighted in purple. I’ve subtracted Alaska record counts so we can better compare apples to apples with record totals and rankings for the lower 48 states.
Looking at trends, warm months should continue. During and after the last strong El Niño in 2015/16 there was a record 37 month string of months with more DHMX than DLMN records. We are in the middle of another such streak in association with the record strong El Niño of 2026/27.
I’m predicting that September 2026 will be well above average with October and November 2026 also being above average. Here is the link to avg. rankings per year for the lower 48 states since 1895:
https://www.ncdc.noaa.gov/cag/national/rankings
Just about every season in the future will see above average temperatures, so seasonal forecasters are beginning to “chuck it,” discounting colder than average scenarios due to carbon pollution.
Here are all seasons ranked for the last decade:

The last time we had an above average fall season ranked below 100 was in 2019. An average ranking on the above chart would be 66 as of 2026. Will Fall 2026 buck this trend? I think not.
Here is my bottom-line forecast for Fall 2026:
“I think that Fall 2026 will be ranked well above average. I’m going to forecast that the Fall 2026 ranking will be around 125 but possibly as low as 115 and as high as 132, with above average confidence given all of the factors written within this post. It should be about as warm as Fall 2025, which came in as 4th warmest with a ranking of 129.
My forecast for Spring 2026 was for a ranking of 120 + or – 10 rankings was 11 rankings too cool and 1 ranking outside my range. That verification was at 131, or the 2nd warmest spring on record. The warmest was that of Spring 2012.
We will see how well my forecast ranking of near 120 + or – 10 rankings for Summer 2026 worked out in a few days.
As of 2026 the top ranking for any month or season would be 132 since climatological rankings for the United States started in the year 1895. Carbon pollution is definitely making below average seasons so rare that they are about to be a thing of the past. As stated, I’m going to guess that Fall 2026 gets ranked around 125 but possibly as low as 115 and as high as 132, and with above average confidence given all of the factors in this post.
Have a fantastic fall.
Here are more “ET’s” recorded from around the planet the last couple of days, their consequences, and some extreme temperature outlooks, as well as any extreme precipitation reports:
Here is More Climate News from Sunday:
(As usual, this will be a fluid post in which more information gets added during the day as it crosses my radar, crediting all who have put it on-line. Items will be archived on this site for posterity. In most instances click on the pictures of each tweet to see each article. The most noteworthy items will be listed first.)