Wednesday October 16th… Dear Diary. The main purpose of this ongoing blog will be to track United States extreme or record temperatures related to climate change. Any reports I see of ETs will be listed below at the very end of this daily blog. I’ll refer to extreme or record temperatures as ETs (not extraterrestrials).😉
Renewable Energy Weather Power Tool Graphic Updates From Climate Central
Climate Central is a wonderful organization that began branching out into forecasting optimal weather conditions for getting maximum renewable energy in 2018. I just received an email from them showing their strides into this branch of combating climate change during 2019. On Camera Meteorologists, some of whom read from this site, are encouraged to use these new Climate Central tools. I would also like all reading to insist that your local TV markets have their OCMs use these tools during climate and weather segments. Lastly, for those in Europe, Australia, and Latin America reading, I hope that those presenting weather can take up the Climate Central mantle and do something similar to what is presented on today’s post. The Climate Guy will thank you for doing so:
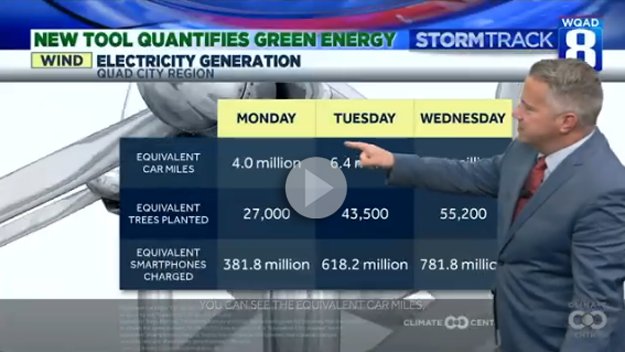
Video featuring Eric Sorensen (Quad Cities – WQAD/ABC) and Amelia Draper (Washington, D.C. – WRC/NBC)Use WeatherPower
See how much electricity is generated from wind and solar energy in your area—based on actual weather forecasts for today and tomorrow:
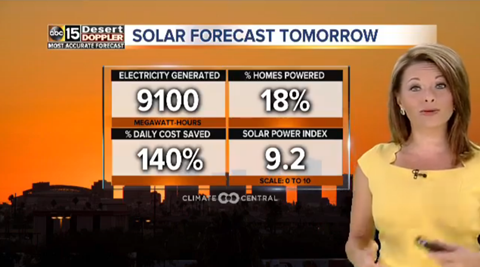
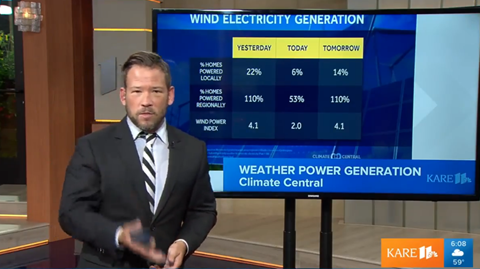
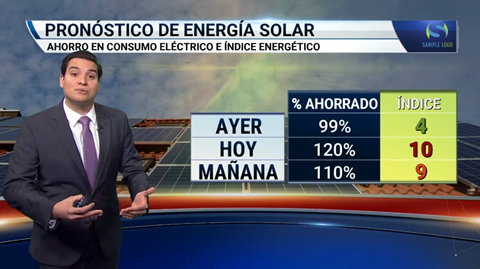
Our updated WeatherPower tool has even more ways to show the power of renewable energy. The tool still forecasts the wind and solar electricity that is already being generated, based on weather predictions and local energy installations. It also provides customizable, production-ready graphics, with options to show cost saved or a Power Index (from 0-10, where 10 indicates perfect sun or wind conditions). Now, there’s more:
- New geographies: including graphics by media market, state, county, and congressional district
- New metrics: calculating the CO2 emissions avoided by the generation and use of wind and solar electricity—as well as:
- The amount of car travel that would emit that much CO2
- The number of trees planted that would absorb that much CO2
- The number of smartphones that could be charged with the clean electricity
- Updated installations: incorporating new wind and solar facilities that continue to come online
Though solar potential dips a bit as the days get shorter, wind speeds typically pick up in the active transitional weather of October. And year-round, wind and solar use is accelerating across the country. Renewables generated a record 17.6% of U.S. electricity in 2018, and are expected to be the fastest growing source of electricity generation in 2019-2020 (according to the U.S. Energy Information Administration). Of the additional energy capacity planned for 2019, nearly two thirds come from renewables.
This rapid growth of renewable energy is both reducing greenhouse gas emissions and creating local jobs. Economy-wide, wind and solar service jobs are projected to be the two fastest-growing occupations in the next decade. Solutions stories like these can capture viewers’ attention for longer and are more likely to be shared, according to testing by the Solutions Journalism Network. They also heighten feelings of optimism, knowledge gained, and involvement in the issue itself (see more in our recent webinar).
WeatherPower is a way to connect with your audiences daily on a topic that they overwhelmingly support. For examples of how to incorporate this material into your weathercast or digital offerings, here are some examples:
- Jesse Guinn’s long-form story (Peoria – WEEK/NBC)
- Ava Marie’s engagement with Facebook followers (Baltimore – WBAL/NBC)
- David Yeomans’s morning solarcast—like a pollen, UV, or boating forecast (Austin – KXAN/NBC)
Amber Sullins —
Phoenix (KNXV/ABC)
Sven Sundgaard —
Minneapolis (KARE/NBC)
Ariel Rodríguez —
Miami (WSCV/Telemundo)
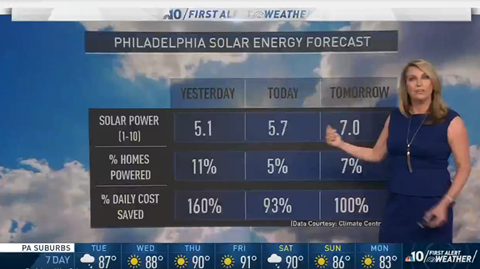
Tammie Souza —
Philadelphia (WCAU/NBC)
METHODOLOGY
Our WeatherPower page gives a brief explanation for each metric available. For the full 30-page methodology, click here.
SUPPORTING MULTIMEDIA
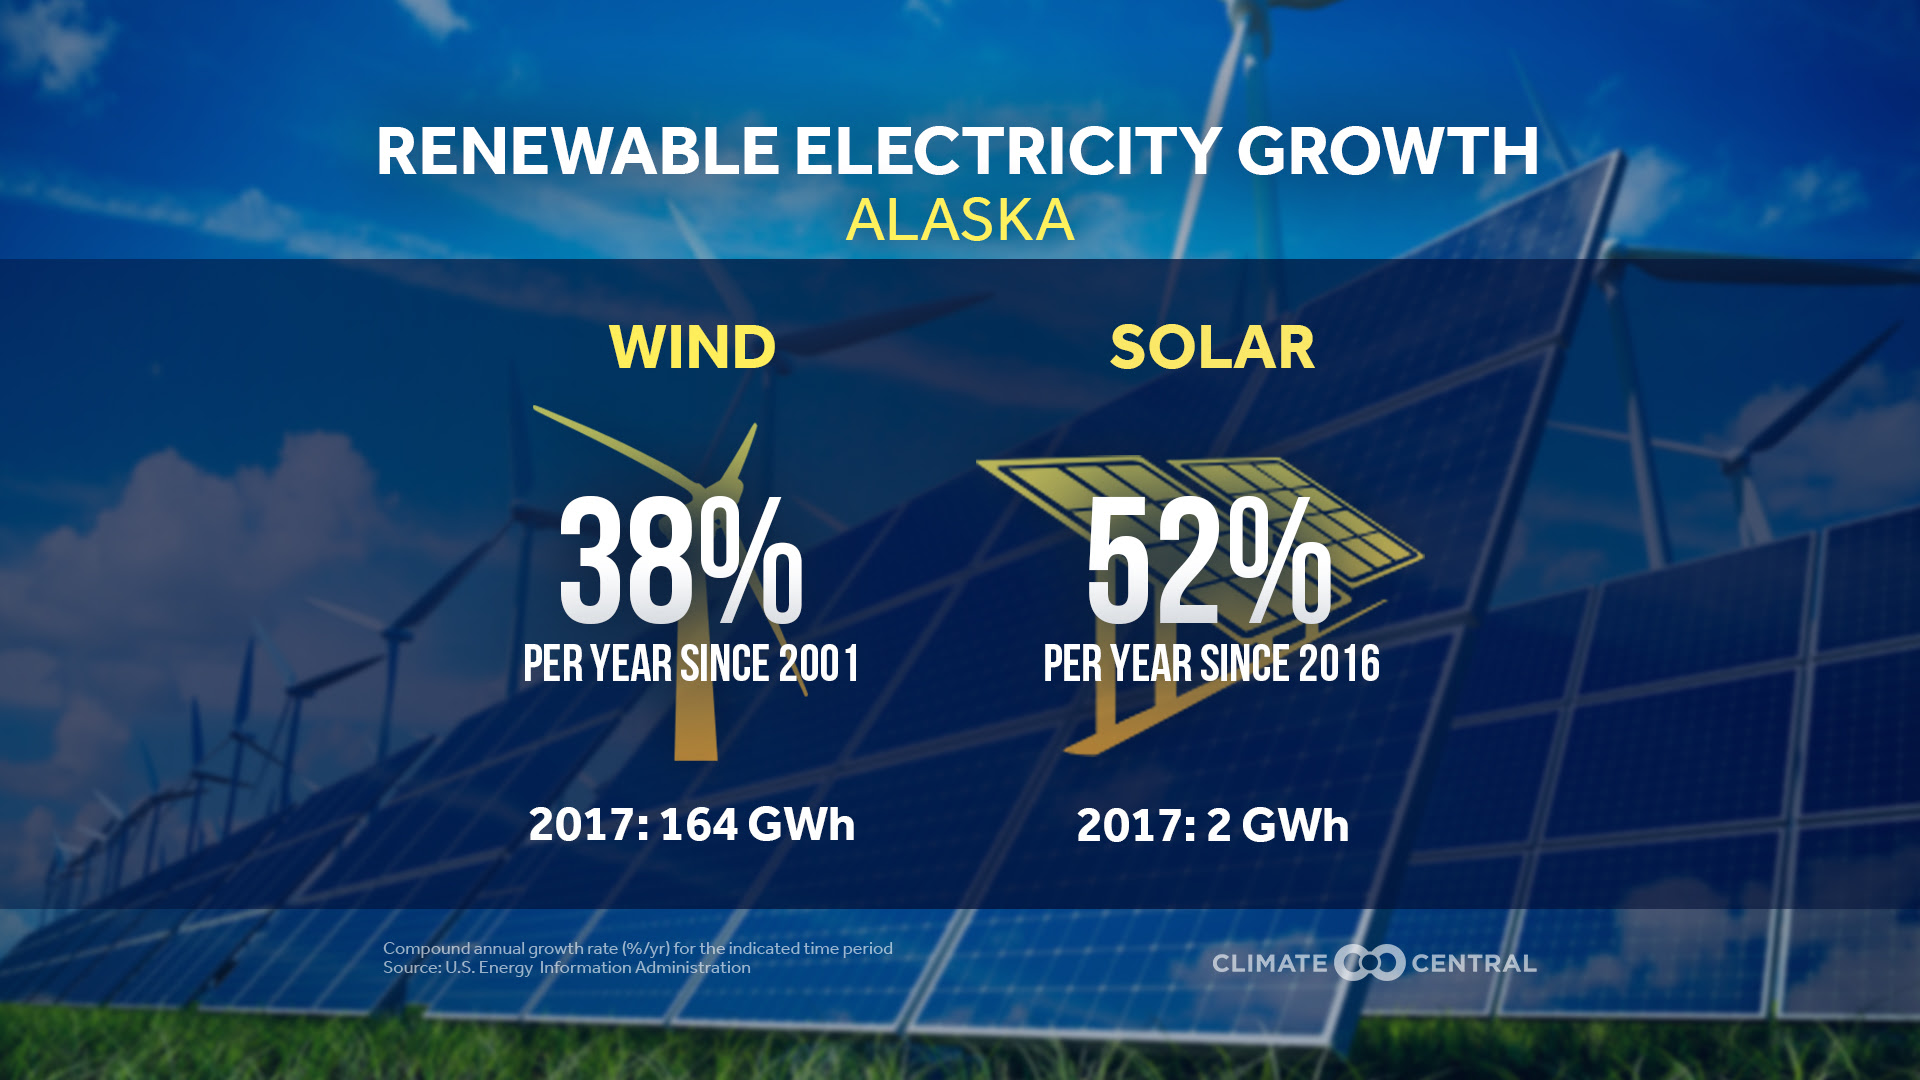
The Rise of Renewables
(Newsroom version here)

Daily Climate Tools
Worth Celebrating
Also from Climate Central released today, Dear Diary:
Here is more climate and weather news from Wednesday:
(As usual, this will be a fluid post in which more information gets added during the day as it crosses my radar, crediting all who have put it on-line. Items will be archived on this site for posterity. In most instances click on the pictures of each tweet to see each article.)
(If you like these posts and my work please contribute via the PayPal widget, which has recently been added to this site. Thanks in advance for any support.)
Guy Walton- “The Climate Guy”