Tuesday October 15th… Dear Diary. The main purpose of this ongoing blog will be to track United States extreme or record temperatures related to climate change. Any reports I see of ETs will be listed below at the very end of this daily blog. I’ll refer to extreme or record temperatures as ETs (not extraterrestrials).😉
Where Are We?…NASA Update On Global Temperature Averages And A Dire Warning
It’s now the middle of the month so it’s time for NASA and NOAA to complete their global assessments for the prior month. NASA has determined that September was the second warmest September since records began in 1880, coming in second to that of 2016:
https://data.giss.nasa.gov/gistemp/

The above chart is base on 1951-1980 averages, so we can add about .2°C to what is shown. We are currently standing near +1.0°C above preindustrial conditions. United Nations recommendations via the Paris Accords have made a proverbial line in the sand for us as a species to not cross more than +2.0°C above preindustrial conditions.
Why is this important as we have asked over and over again? Here is yet one more reason:
If warming exceeds 2°C, Antarctica’s melting ice sheets could raise seas 20 meters in coming centuries
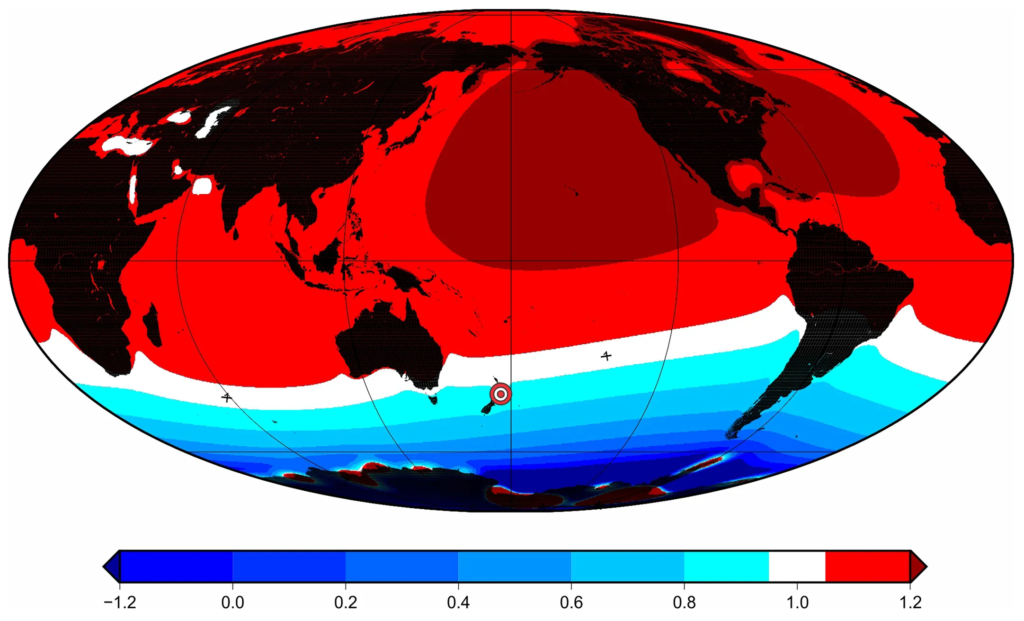
Calculated global relative sea-level (RSL) change produced by instantaneous ice-sheet melting of 15-m eustatic sea level (ESL). Shown is RSL (normalized with respect to ESL) according to scenario 1 (AIS only) after 10 kyr of viscous relaxation (mantle viscosity profile a; Extended Data Table 2) following an instantaneous melting. The white band denotes RSL from 0.8 to 1.2 of the ESL signal. The GIA-driven RSL fingerprints are more evident if compared to Fig. 4a (10-kyr-long linear melting). The Whanganui site is highlighted by the red and white bullseye. Graphic: Grant, et al., 2019 / Nature
By Georgia Rose Grant and Timothy Naish
2 October 2019
(The Conversation) – We know that our planet has experienced warmer periods in the past, during the Pliocene geological epoch around three million years ago.
Our research, published today, shows that up to one third of Antarctica’s ice sheet melted during this period, causing sea levels to rise by as much as 20 metres above present levels in coming centuries. [See also the press release, New research on past sea levels reveals potential for widespread melting of Antarctica. –Des]
We were able to measure past changes in sea level by drilling cores at a site in New Zealand, known as the Whanganui Basin, which contains shallow marine sediments of arguably the highest resolution in the world.
Using a new method we developed to predict the water level from the size of sand particle moved by waves, we constructed a record of global sea-level change with significantly more precision than previously possible.
The Pliocene was the last time atmospheric carbon dioxide concentrations were above 400 parts per million and Earth’s temperature was 2°C warmer than pre-industrial times. We show that warming of more than 2°C could set off widespread melting in Antarctica once again and our planet could be hurtling back to the future, towards a climate that existed three million years ago. […]
But of course climate change doesn’t magically stop after the year 2100.
At the current rate of global emissions we may be back in the Pliocene by 2030 and we will have exceeded the 2°C Paris target. One of the most critical questions facing humanity is how much and how fast global sea levels will rise.
According to the recent special report on the world’s oceans and cryosphere by the Intergovernmental Panel on Climate Change (IPCC), glaciers and polar ice sheets continue to lose mass at an accelerating rate, but the contribution of polar ice sheets, in particular the Antarctic ice sheet, to future sea level rise remains difficult to constrain.
If we continue to follow our current emissions trajectory, the median (66% probability) global sea level reached by the end of the century will be 1.2 metres higher than now, with two metres a plausible upper limit (5% probability). But of course climate change doesn’t magically stop after the year 2100. […]
Our study also shows that most of the sea-level rise during the Pliocene came from Antarctica’s ice sheets. During the warm Pliocene, the geography of Earth’s continents and oceans and the size of polar ice sheets were similar to today, with only a small ice sheet on Greenland during the warmest period. The melting of the Greenland ice sheet would have contributed at most five metres to the maximum 25 metres of global sea-level rise recorded at Whanganui Basin.
Of critical concern is that over 90% of the heat from global warming to date has gone into the ocean. Much of it has gone into the Southern Ocean, which bathes the margins of Antarctica’s ice sheet. [more]
The amplitude and origin of sea-level variability during the Pliocene epoch
ABSTRACT: Earth is heading towards a climate that last existed more than three million years ago (Ma) during the ‘mid-Pliocene warm period’1, when atmospheric carbon dioxide concentrations were about 400 parts per million, global sea level oscillated in response to orbital forcing2,3 and peak global-mean sea level (GMSL) may have reached about 20 metres above the present-day value4,5. For sea-level rise of this magnitude, extensive retreat or collapse of the Greenland, West Antarctic and marine-based sectors of the East Antarctic ice sheets is required. Yet the relative amplitude of sea-level variations within glacial–interglacial cycles remains poorly constrained. To address this, we calibrate a theoretical relationship between modern sediment transport by waves and water depth, and then apply the technique to grain size in a continuous 800-metre-thick Pliocene sequence of shallow-marine sediments from Whanganui Basin, New Zealand. Water-depth variations obtained in this way, after corrections for tectonic subsidence, yield cyclic relative sea-level (RSL) variations. Here we show that sea level varied on average by 13 ± 5 metres over glacial–interglacial cycles during the middle-to-late Pliocene (about 3.3–2.5 Ma). The resulting record is independent of the global ice volume proxy3 (as derived from the deep-ocean oxygen isotope record) and sea-level cycles are in phase with 20-thousand-year (kyr) periodic changes in insolation over Antarctica, paced by eccentricity-modulated orbital precession6 between 3.3 and 2.7 Ma. Thereafter, sea-level fluctuations are paced by the 41-kyr period of cycles in Earth’s axial tilt as ice sheets stabilize on Antarctica and intensify in the Northern Hemisphere3,6. Strictly, we provide the amplitude of RSL change, rather than absolute GMSL change. However, simulations of RSL change based on glacio-isostatic adjustment show that our record approximates eustatic sea level, defined here as GMSL unregistered to the centre of the Earth. Nonetheless, under conservative assumptions, our estimates limit maximum Pliocene sea-level rise to less than 25 metres and provide new constraints on polar ice-volume variability under the climate conditions predicted for this century.
The amplitude and origin of sea-level variability during the Pliocene epoch
Now, let’s look at the latest CO2 trends:
https://www.co2.earth/daily-co2
Daily CO2
Mauna Loa Observatory | Atmospheric CO2 Concentrations

daily mean concentrations | ppm = parts per million
I’m just shaking my head here. Ever since I have been following CO1 trends during the 1990s there has not been much of s change. CO2 levels have been rising at the rate of approximately 2.5 parts per million per year.
I have another dire warning. It’s this simple: Either stop CO2 pollution in its tracks before the year 2030 or what we hold precious on coastlines will be gone worldwide. Period.
Here is more climate and weather news from Tuesday:
(As usual, this will be a fluid post in which more information gets added during the day as it crosses my radar, crediting all who have put it on-line. Items will be archived on this site for posterity. In most instances click on the pictures of each tweet to see each article.)
(If you like these posts and my work please contribute via the PayPal widget, which has recently been added to this site. Thanks in advance for any support.)
Guy Walton- “The Climate Guy”