Up to this point with my posts I have been relaying general information in association with my record temperature research trends using NCEI data. In this post I will attempt to begin to put that research to the test aiding climate scientist’s and meteorologist’s quests for warning the general public of the chances for dangerous heat. I would like this post to be fluid, updating the charts presented here as suggestions come to me and more data gets processed. I am very open to more ideas on how to forecast dangerous summer heat in late spring.
Obviously, dangerous heat occurs in the northern hemisphere during the summer months of June, July and August with some exceptions in late spring and early autumn. What we need to concentrate on are the traditional summer months, as far as record temperatures go. I keep on reiterating that not many people would mind a record high of 70 in New York City in January, but 103 in July, not so much. We all know that due to carbon pollution the probabilities for record heat at any one location across the world and in the United States are going up. Just exactly what are those probabilities in the U.S. during future summers?
Initially, let’s concentrate on the summers in the U.S. from 2017 to 2030. I did make a summer 2017 forecast for the U.S. We will see how that pans out: https://guyonclimate.com/2017/05/24/forecasting-a-hot-summer/
In order to forecast probabilities for say at least a week of near record hot temperatures at any given U.S. location we first need to take a detailed look at past summer trends. This might be my wonkiest looking chart yet, but it has detailed summer record tally information. At the very least, I hope that those in the scientific community can glean more information from the chart. Keep in mind that each tally could be a set or tied record for any station in the United States:
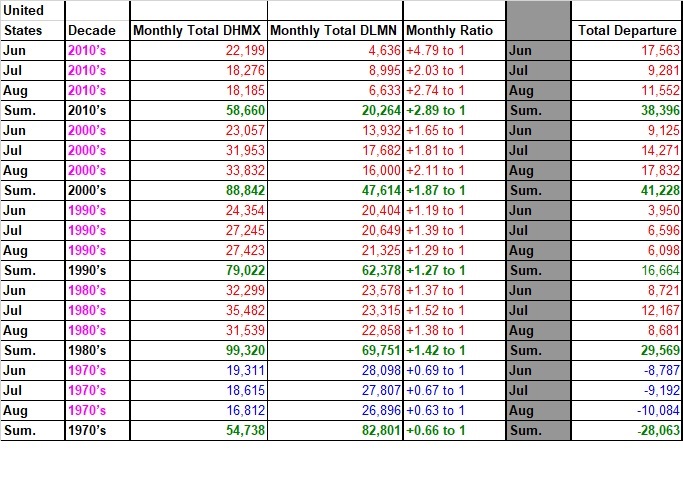
What I have presented in the above chart is hard data, or numbers that have occurred in the past. One can note that the ratios of DHMX to DLMN during the summer months are generally getting higher since the 1970’s. The 1990’s are an exception, which I will blame on the eruption of Mt. Pinatubo producing cool summers in 1992 and 1993. The next step is to come up with some sort of comparison tool to judge one set of data with another to get a warning scale. In an e-mail I came up with this:
I believe that given X (the average surface temperature of the Earth) we can, on a handy sliding scale, predict Y (the high and low end of average yearly records ratios for a given country). If we know X and Y then we may be able to predict Z (the probability of getting dangerous record high maxes in a given country during their summer). This principle would involve floating averages (I know you guys will correct me if I am wrong). 😊
So for the next chart I used the following UC Berkeley graph from Zeke Hausfather to estimate average surface temperatures per decade to come up with X:

Here is my chart per decade to come up with a forecast for Y and Z:

*Of course the 2010’s have three summers to go. Somewhat surprisingly there have been relatively cool summers despite the overall warming trend through the 2010’s, so I would expect one or two more during the 2020’s.
Again, I hope that the scientific community will find the data in this chart for past minimum and maximum ratios of DHMX to DLMN useful. My forecasts for the 2020’s are based off trends from the past five decades and are not set in stone. What’s most alarming to me is that it does not take much of a rise in global average temps to see ratios rise… that ongoing 29 month streak of more DHMX than DLMN is a good example. A huge volcanic eruption or meteor strike can throw a big monkey wrench into my forecasts, but that would be the only two events to slow the rate of global warming down.
I look forward to comments leading to improvements on any methodology presented here.
Next I will begin those diary posts of how much heat occurs across the U.S. this summer.
The Climate Guy