Wednesday March 7th… Dear Diary. The main purpose of this ongoing post will be to track United States extreme or record temperatures related to climate change. Any reports I see of ETs will be listed below the main topic of the day. I’ll refer to extreme temperatures as ETs (not extraterrestrials)😊. Here is today’s main climate change related topic: (If you like these posts and my work please contribute via the PayPal widget, which has recently been added to this site. Thanks in advance for any support.)
Official NCEI U.S. Winter 2017/18 Climatology
Another season’s worth of statistics has been processed by the National Center for Environmental Information indicating that due to climate change temperature averages are skewed towards warmth for the United States. Yes, as each month, season and year passes more nails get driven into climate change denier’s coffins. Folks, the planet isn’t cooling off. Before getting into the nitty gritty of the winter stats generally one can see from this chart that a vast majority of seasons since the start of this decade have had above average rankings. The rankings began by NCEI in 1895 so the warmest season ranked would be 123 with the coldest at 1:

Notice that only 4 seasonal rankings out of 33 are color coded blue with below average temperatures for the lower 48 states. The winter of 2007/08 comes in raked at an even 100. It’s been a warm decade so far. Now let’s break down those NCEI winter ranking statistics. Here are both the temperature and precipitation state rankings for December 2017:


Overall December 2017 got ranked 93rd warmest and was much drier than average for much of the country. My home state of Georgia was ranked warm at 100 despite having a record early December snow storm.
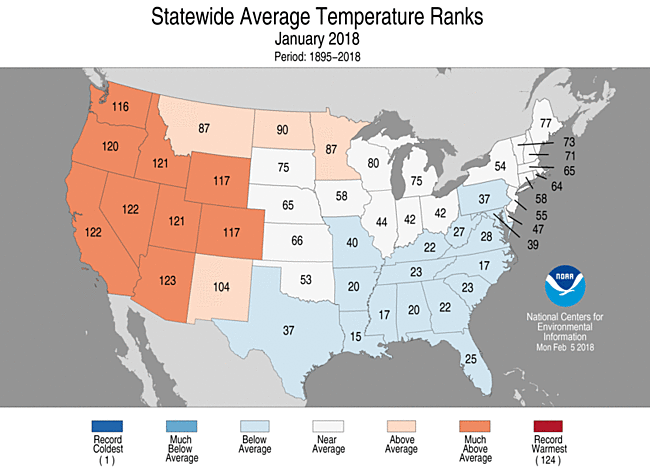
January 2018 was the month of the dipole with a stubborn, deep trough persisting in the East and a trough in the West. Interestingly there were more daily record low minimums smashed than record highs breaking a string of 37 consecutive months of more record DHMX than DLMN dating back to November 2014. Despite the disparity in record numbers January 2018 got ranked 90 since the western warmth was more significant than the southern chill. January 2018 was another dry month for most states:
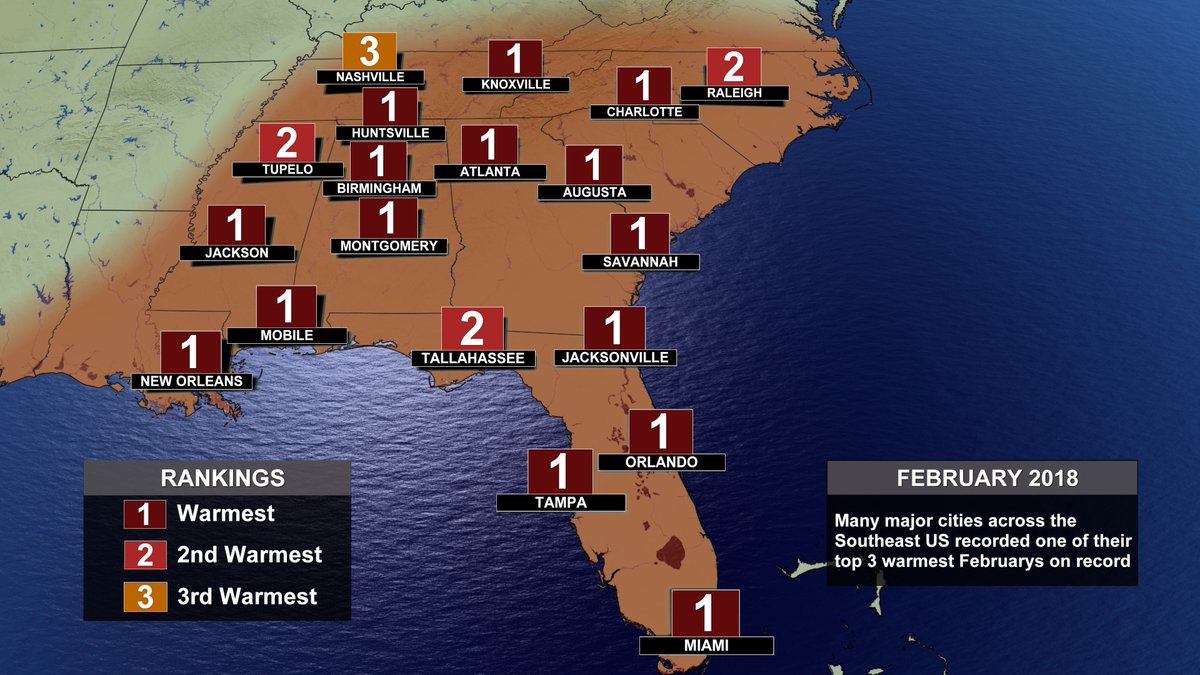
In February 2018 the dipole pattern broke down such that near average temperatures predominated the West, but a massive upper ridge produced a mid-winter “warm wave” in the East:
The change in the weather pattern brought flooding to the nation’s mid section where six states recorded their wettest Februarys in history. There was a strong link between the record warmth in the Southeast and record flooding in the Mid-Atlantic and Midwest.
And…

Thanks @JohnMoralesNBC6. Wow! No wonder that outdoor attire by Atlantans during FEB looked similar to what I saw in TLH when going to school at #FloridaState during the early 1980s. Now this is #climatechange. @BernadetteWoods @MichaelEMann @bhensonweather http://www.guyonclimate.com/2018/03/02/extreme-temperature-diary-march-2-2018-spring-2018-forecast/ …
Yep, I was doing a double take watching people do outdoor activates in shorts in February.
Overall the lower 48 stars had it’s 24th warmest Winter:
My friend Bob Henson added record stats to his Category 6 post in U.S. Winter 2017/18 climatology here:
https://www.wunderground.com/cat6/us-winter-ended-dry-mild-side-says-noaa
50% more record highs than record lows
Based on data compiled by meteorologist Guy Walton, the nation saw 6886 daily record highs and 4557 daily record lows from December through February. January was the first month since November 2014 that saw more daily record lows (2857) than highs (2357). The sharp cold of late December into January didn’t manage to set all that many monthly cold records, though. As a whole, the winter produced 356 monthly record highs versus just 119 monthly record lows.
After catching a break in 2017 the drought reared its ugly head again for much of the West.
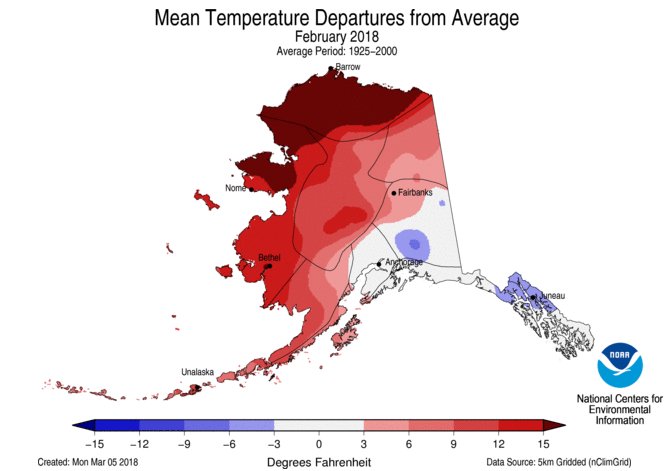
Let’s not forget about “baked” Alaska:

You can follow how trends are going for spring 2018 by playing “The Climate Lottery” linked here:
https://guyonclimate.com/the-climate-lottery/
……………………………………………………………………………………………………………………..
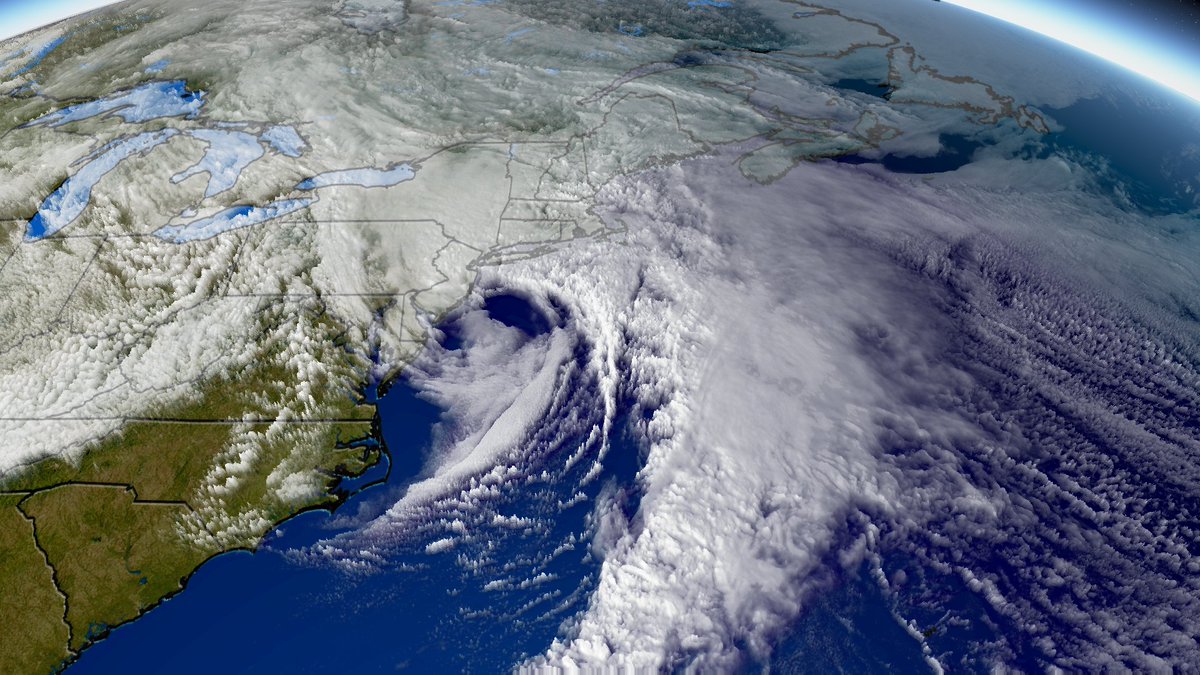
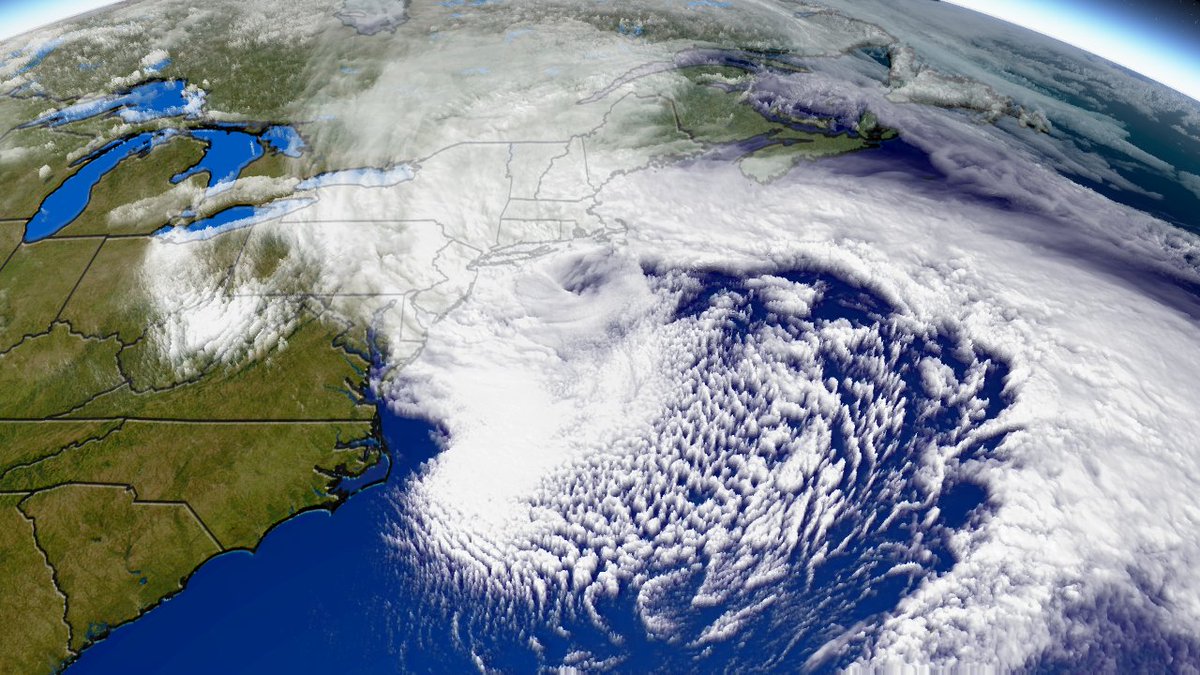
As far as Quinn goes:
[510 pm] Very impressive radar imagery with a fire hose of moisture coming off the Atlantic ocean. Comma-head signature over/near NYC indicative of cyclone/coastal storm intensifying rapidly. Heavy #snow this evening with hourly rates of 1-3" possible along with #thundersnow! pic.twitter.com/aqlmg1a4eF
— NWS Boston (@NWSBoston) March 7, 2018

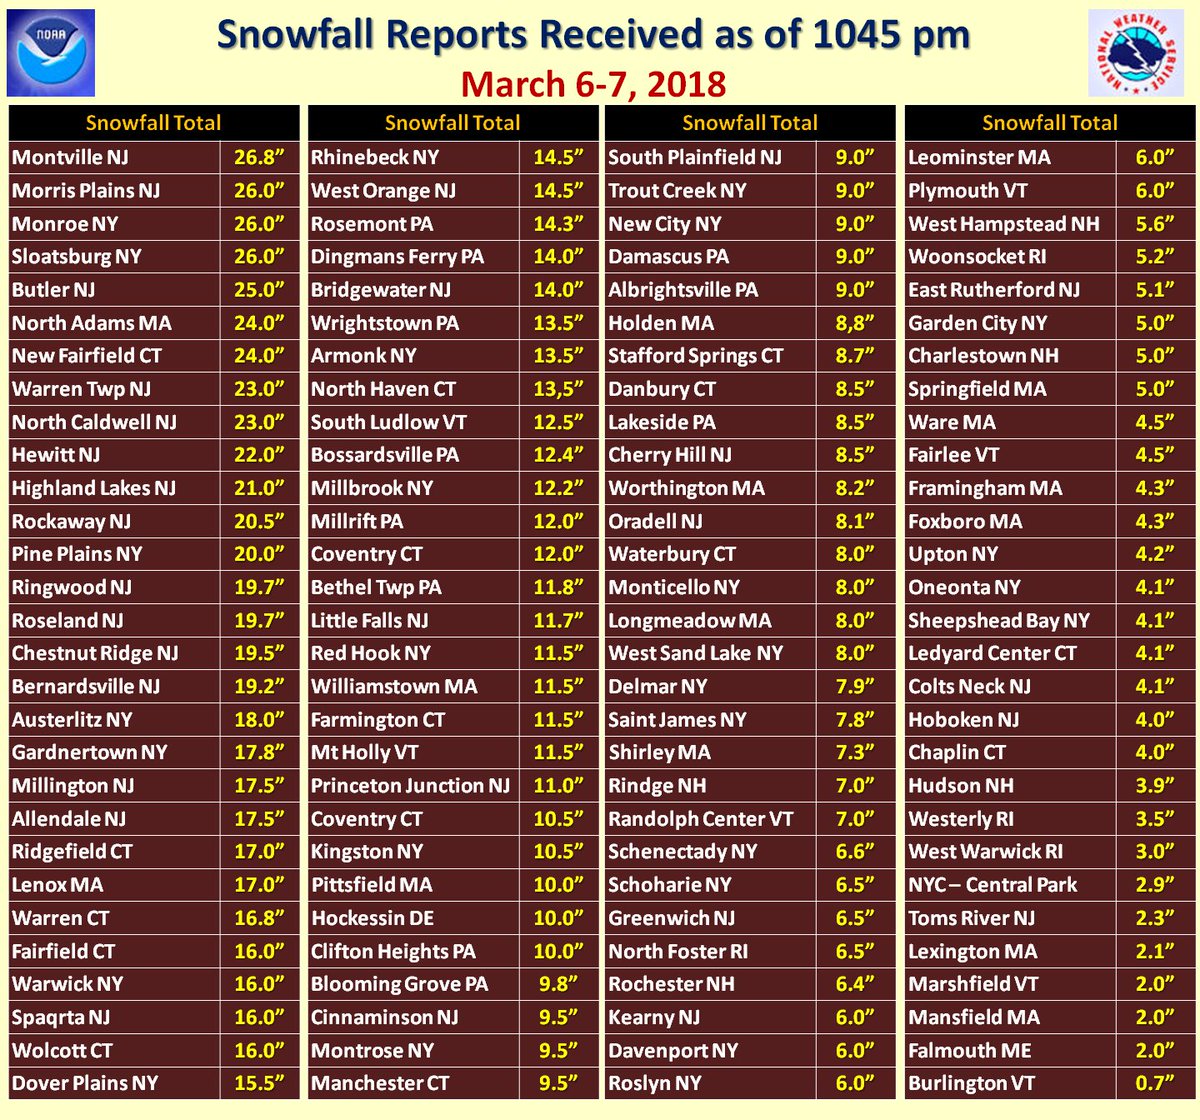
 Brian DoneganVerified account @WxBrianD
26.8 inches in Montville, NJ, is the top total from #Quinn late this evening.
 Andrew FreedmanVerified account @afreedma
Worcester, MA has seen better nights! Winter storm #Quinn is a real pain, and VERY dangerous. pic.twitter.com/dT6T2zDvZK
— Justin Michaels (@JMichaelsNews) March 8, 2018


The Climate Guy