Thursday May 3rd… Dear Diary. The main purpose of this ongoing post will be to track United States extreme or record temperatures related to climate change. Any reports I see of ETs will be listed below the main topic of the day. I’ll refer to extreme or record temperatures as ETs (not extraterrestrials)😊. Here is today’s main climate change related topic:
After some tedious research I’ve finally completed National Center for Environmental Information report counts for Alaska going back to January 1920 for daily surface records of high maximums, low minimums, high minimums and low maximums. I chose Alaska to be the first individual state that I have researched since a) it is large and isolated away from the lower 48 states b) I wanted to help prove that areas closer to the pole are warming faster than those at lower latitudes as other climate scientists are finding, and c) in the future I or someone might want to subtract Alaskan counts from U.S. counts to get a better statistical handle on lower 48 state trends. The following is an end result of weeks of plugging in record numbers to the same Excel Files I use for the U.S. and other countries:
Here are the two main decadal charts for the United States, which also include the counts for Alaska:


Now let’s look at the same charts for Alaska, which are a subset, of course, of the U.S. data:
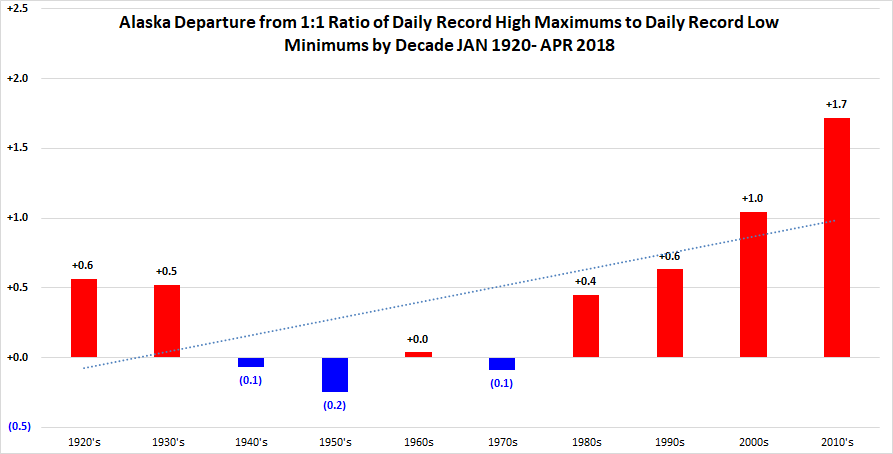
At first glance we can see a starker warming trend in Alaska since 1960 than in the U.S. as a whole, especially since 1990. Also, the warming trend starts in 1960 in Alaska, a couple of decades earlier than for the U.S. The numbers fit what we now know, the Arctic is warming faster than lower latitudes.
Here is why we should discount the Alaska data prior to about 1940 looking at the number of counts making up these four charts:


In the lower 48 states eligible reports after 30 years of record keeping fall off sharply prior to 1922. That date is either 1935 or 1936 in Alaska because it was more recently settled. If we lop off the 1920s and 1930s for Alaska we nearly see a continuous warming trend (higher ratios of warm to cold records) since 1940.
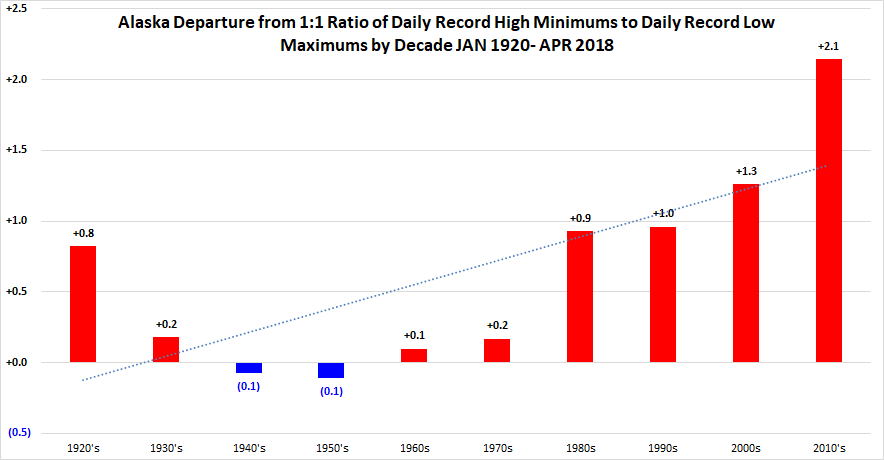
What happens when we mix and match these counts to see if another climate change trend of nights warming faster than days is happening in Alaska? Here are those charts:
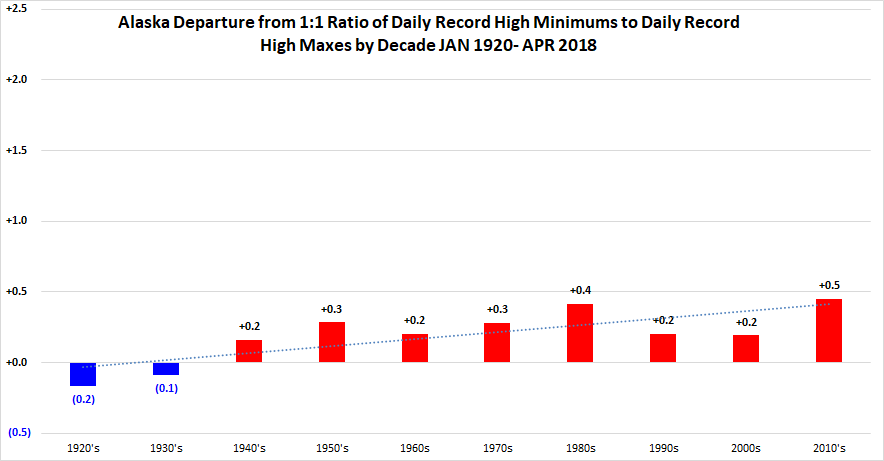

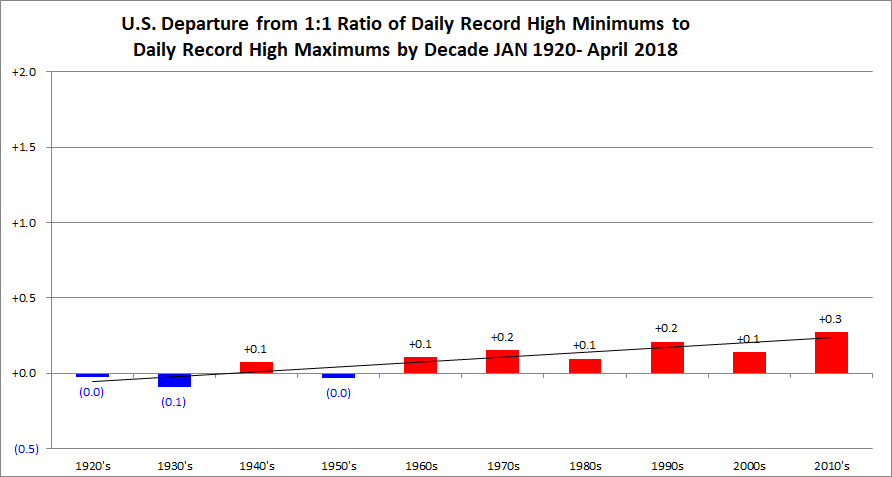
Sure enough there have been more counts of warm night records and cool day records than warm day records and cold night records, respectively over the last several decades in Alaska. For reference here is what we see for the U.S. as a whole:

Alaskan climatologists are seeing some of the same trends:
 Brian Brettschneider @Climatologist49

Once I add average temperature raking data, which starts in 1925 for Alaska, I will add this data to the archive section of this site.
……………………………………………………………………..
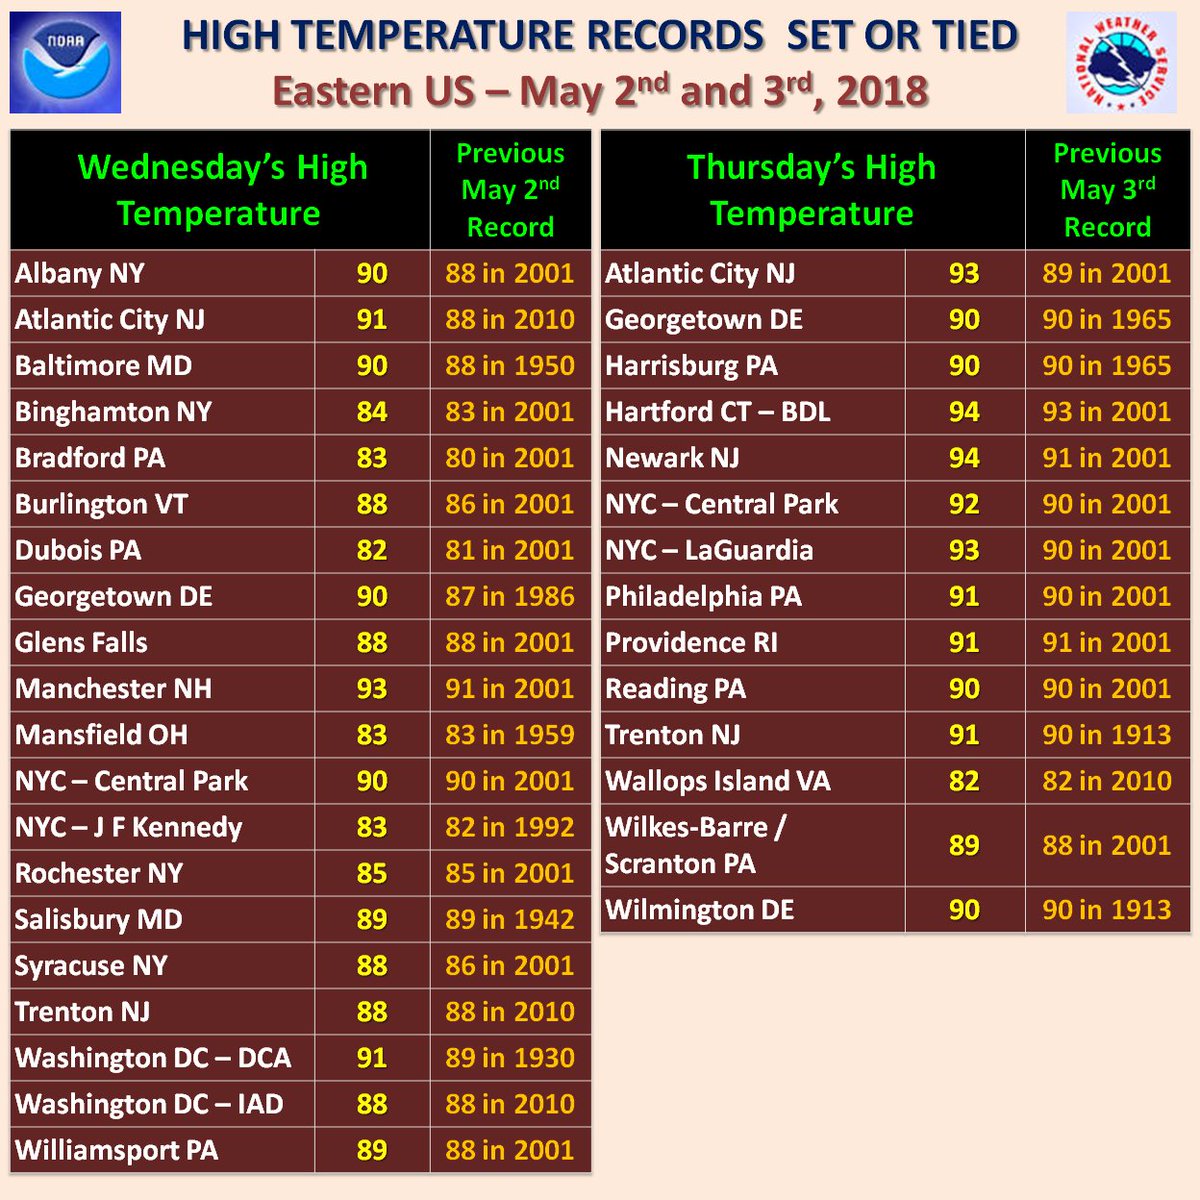
As far as those “ET”s go the warm team has been racking up some points this week in the Northeast. Here is a fairly complete NWS list:
 NWS Eastern RegionVerified account @NWSEastern
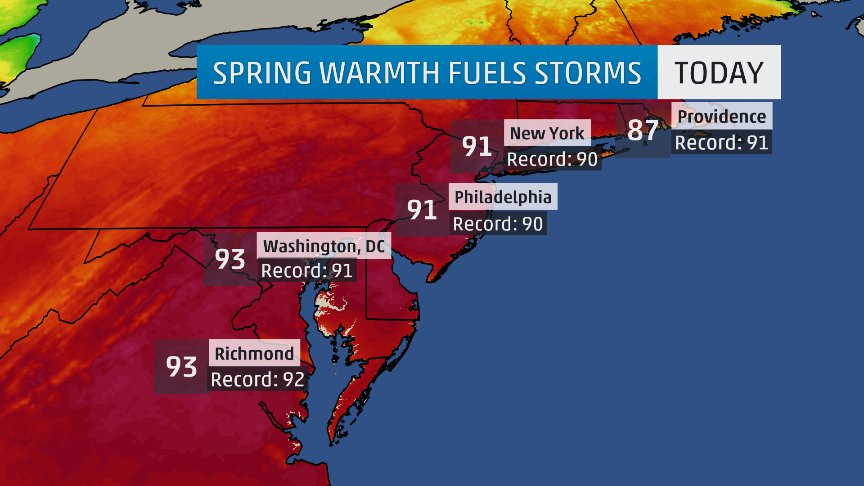
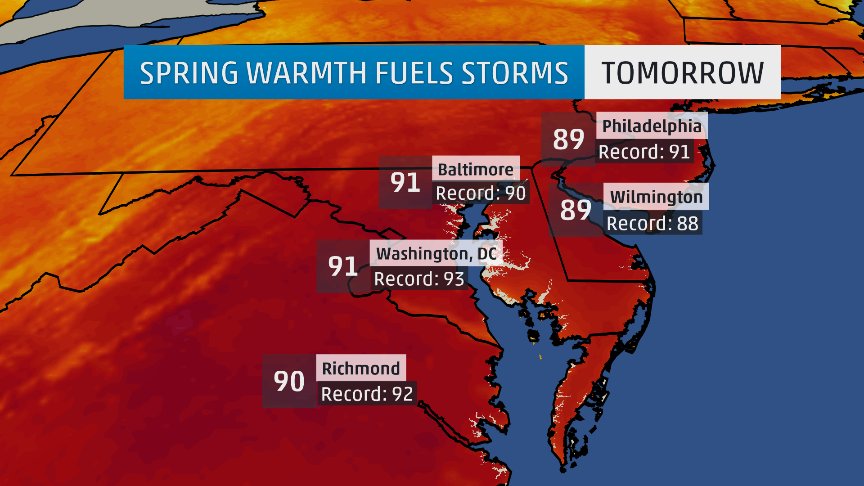
Sprummer Alex? I like it.😉

Hey @MerriamWebster, @twcMariaLaRosa just made up a word…#Sprummer It’s when it’s Spring but it feels like Summer! Can we officially make this a word??? 😉
(If you like these posts and my work please contribute via the PayPal widget, which has recently been added to this site. Thanks in advance for any support.)
The Climate Guy