The main purpose of this ongoing blog will be to track planetary extreme, or record temperatures related to climate change. Any reports I see of ETs will be listed below the main topic of the day. I’ll refer to extreme or record temperatures as ETs (not extraterrestrials).😉
Main Topic: U.S. April 2024 Record Scoreboard and Climatological Review
Dear Diary. It’s time once again for our monthly climatological review. Here on this site, we usually present monthly summaries near the 8th of each month, and each is available by clicking the link below:
https://guyonclimate.com/category/record-scoreboard-climatological-reviews
I’m repeating this mantra every month:
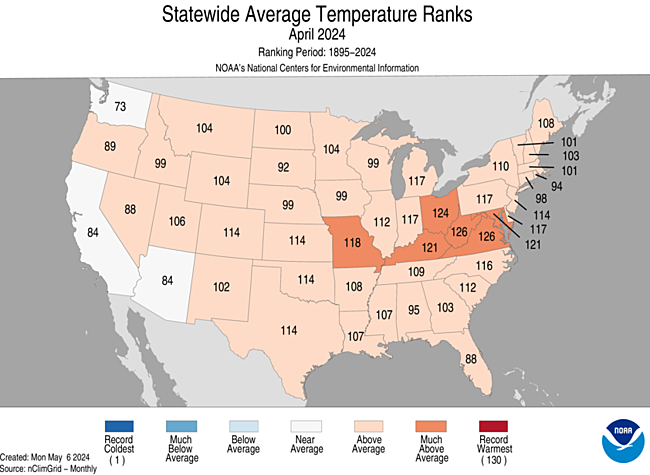
April 2024 using 1901-2000 mean data got ranked by the National Center for Environmental Information for the lower 48 states as 12th warmest, or 119th coolest since records began being kept in 1895 at +2.72°F(+1.51°C) above average.
The above data was from:
https://www.ncdc.noaa.gov/cag/national/rankings
March 2024 was relatively mild to warm from start to finish across the entire country with the exception of the Southwest and northern Rockies. Most record warmth was reported from the Midwest and Northeast.
Above average warmth occurred just about everywhere in the U.S. Most reports of record warmth came from the Midwest and Northeast throughout the month. Most reports of record chill came from the West throughout the month and Northeast late in the month.
You can check out record totals for yourself on my NCEI record archives:
NCEI Record Count Archive – Guy On Climate
Here are my two U.S. Daily Record Scoreboards updated through 4/22/2024 (data compiled from the following NCEI site):
https://www.ncdc.noaa.gov/cdo-web/datatools/records
I’m also keeping tabs on record report totals to verify a scientific study I helped to complete in the decade of the 2000s. We’ll eventually see how skewed ratios of record warm to cold reports get by the year 2100, which the study mentions as 50-1 for DHMX vs. DLMN:
Brand new for 2024: I’ve started to add NCEI anomalies (F° departure from 1901-2000 data) on my record scoreboards. I’d like these record scoreboards to be a quick and dirty reference tool and a template for future NCEI record site graphics.
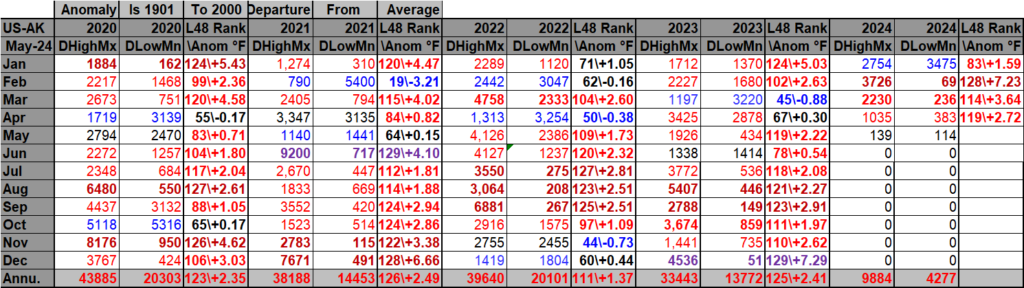

DHMX= Daily High Max Reports. DLMN= Daily Low Min Reports. DHMN= Daily High Min Reports. DLMX=Daily Low Max Reports.
Bold red, blue, or purple colored months, such as December 2023 and June 2021, that have ratios of >10 to 1 daily warm low records or <1 to 10 daily warm to low records are either historically hot or cold, most of which have made news. NCEI rankings are for the lower 48 states with the warmest ranking since 1895 of average temperatures being 129 and 1 being the coldest as of 2023. Blue colors represent cold months and red warm. Those months and years with counts close to a 1 to 1 ratio of highs to lows are colored black. All-time record hottest or coldest months and years are boldly colored in purple. NCDC rankings have been color coded (under tabs in each file) such that values of 54 to 74 are black representing neutral months or years (+ or – 10 from the average ranking of 64).
Totals are record reports for the entire United States including all territories minus those from Alaska. I’ve subtracted those from Alaska to get a better representation of what has occurred across the lower 48 states in association with lower 48 state rankings.
April 2024 had approximately a 5 to 2 ratio of record DHMX to DLMN individual record counts, so the color I used for this month was red on the top chart.
April 2024 had approximately a 3 to 1 ratio of record DHMN to DLMX individual record counts, so the color I used for this month was red on the bottom chart.
Due to climate change, we are seeing fewer blue colors on these Record Scoreboards with time.
As stated, the average temperature lower 48 state ranking for April 2024 was 119, which was colored red since it was warmer than average.
I color rankings of +10 to -10 from the average ranking for the lower 48 states of 65 black, indicating that these are near average temperature wise. The top warmest ranking for 2024 would be 130 since rankings began in 1895.
We are seeing that May 2024 has been near average for most of the country so far. Meteorological models forecast this trend through the third week of the month. I do expect to see another above average month in May 2024, but one that is not historically warm and closer to the median ranking of 65.
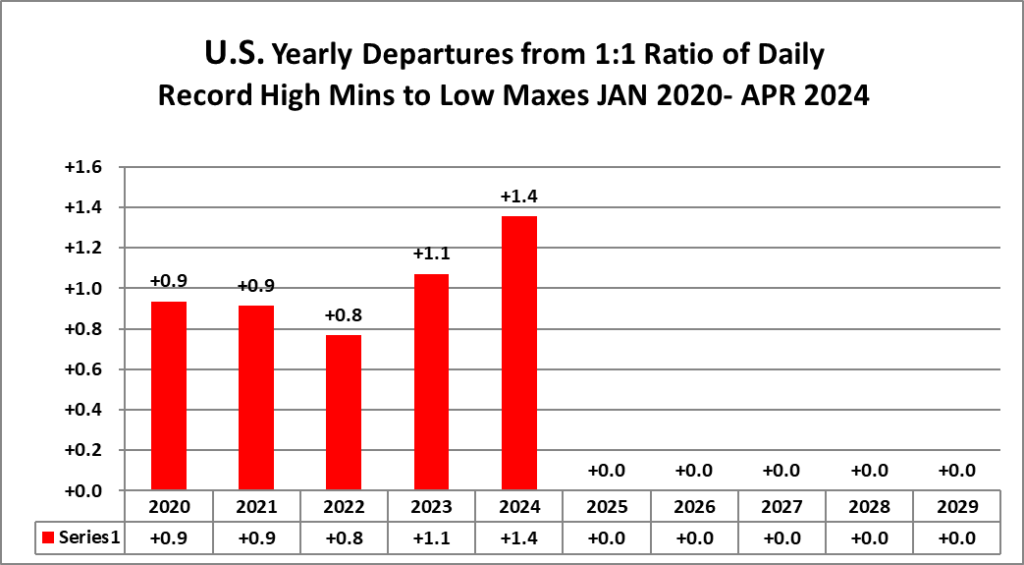
Interestingly, overall ratios for 2024 are now in line with historic yearly ratios for the 2020s as shown here…something to keep in mind for seasonal forecasts:

Here is much more detailed climatology for April 2024 as complied by NOAA:
Assessing the U.S. Climate in April 2024
Severe storms devastated the nation’s heartland during late April; spring snowstorm pummeled New England with up to two feet of snow

Courtesy of Canva.com
PUBLISHED
MAY 8, 2024
Key Points:
- A severe weather outbreak generated more than one hundred tornadoes, including one EF-4, across the Midwest and Great Plains on April 25–28, causing significant damage and loss of life and becoming the worst tornado outbreak to date for the year.
- During early April, a spring snowstorm brought heavy snow and powerful winds to much of New England, downing trees and knocking out power to hundreds of thousands in the region.
- January to April 2024 was the fifth-warmest such four-month period on record for the nation and precipitation ranked in the wettest third of the historical record for the month of April 2024.
Other Highlights:
Temperature
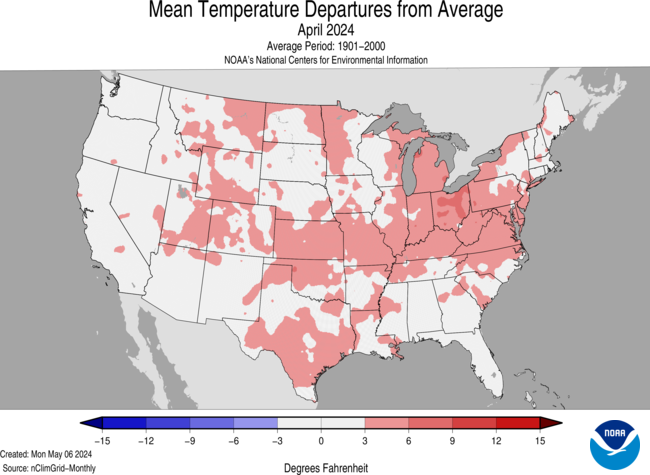
The average temperature of the contiguous U.S. in April was 53.8°F, 2.7°F above average, ranking 12th warmest in the 130-year record. April temperatures were above average across much of the contiguous U.S., while near- to below-average temperatures were observed in parts of the West, northern Plains, Upper Midwest, Southeast and in small pockets of the Northeast. Virginia and West Virginia each had their fifth-warmest April on record.
The Alaska statewide April temperature was 27.2°F, 3.9°F above the long-term average, ranking in the warmest third of the 100-year period of record for the state. Above-average temperatures were observed across most of the state with near- to below-normal temperatures in parts of the Southwest and in parts of the Panhandle.
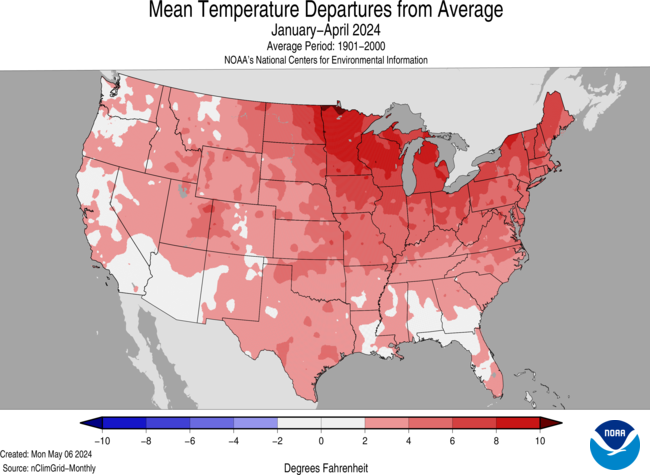
For January–April, the average contiguous U.S. temperature was 43.0°F, 3.8°F above average, ranking fifth warmest on record for this period. Temperatures were above average across nearly all of the contiguous U.S., while record-warm temperatures were observed in parts of the Northeast and Great Lakes. Wisconsin, Michigan, New York, Vermont, New Hampshire and Maine each ranked second warmest for the January–April period.
The Alaska January–April temperature was 13.9°F, 3.6°F above the long-term average, ranking in the warmest third of the historical record for the state. Much of the state was above normal for this four-month period while temperatures were near average across parts of the East, Southeast and parts of the Panhandle.
Precipitation
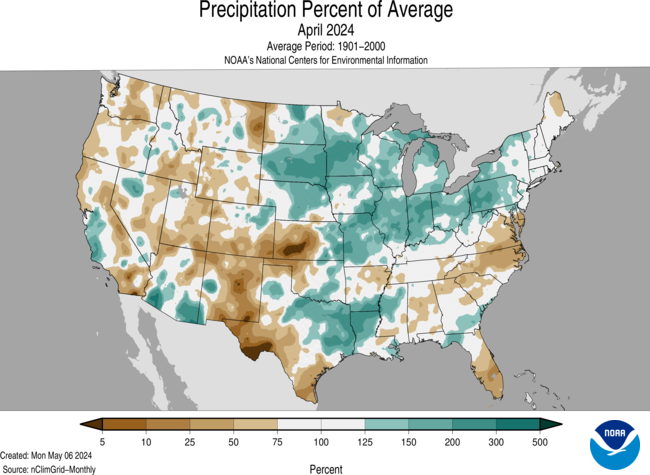
April precipitation for the contiguous U.S. was 2.77 inches, 0.25 inch above average, ranking in the wettest third of the historical record. Precipitation was below average across much of the West, Southeast, and parts of the central and southern Plains. Conversely, precipitation was above normal from portions of the Plains to the Northeast, and in parts of the Southwest. Indiana and Pennsylvania each had their fifth-wettest April on record.
Alaska’s average monthly precipitation ranked in the driest third of the historical record. Precipitation was above average in parts of the North Slope and West Coast, while below-normal precipitation was observed in parts of the Southeast Interior and Panhandle during the month.
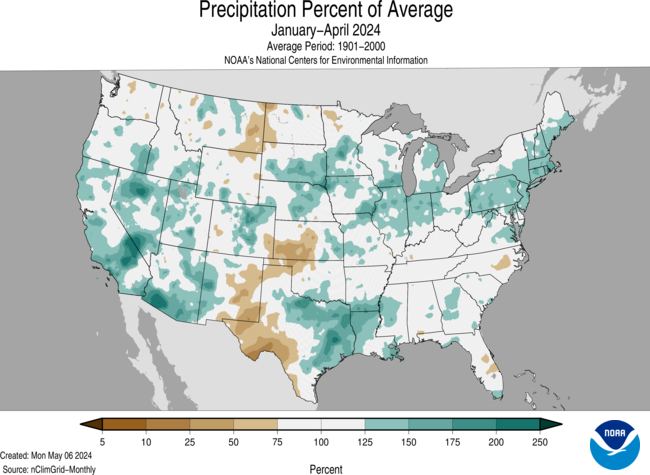
The January–April precipitation total for the contiguous U.S. was 10.95 inches, 1.48 inches above average, ranking 11th wettest in the 130-year record. Precipitation was above average across much of the contiguous U.S., with Pennsylvania having its second-wettest year-to-date period on record. Conversely, precipitation was below average across parts of the Northern Tier and western and southern Plains, and in a small portion of the Southeast during the January–April period.
The January–April precipitation for Alaska ranked in the middle third of the 100-year record, with above-average precipitation observed across much of the state, while near-normal precipitation was observed in parts of the northeast Interior and along parts of the Gulf of Alaska coast. Below-average precipitation were observed in portions of Interior and south-central Alaska and parts of the southern Panhandle during this period.
Billion-Dollar Disasters
Five new billion-dollar weather and climate disasters were confirmed in April 2024, including three severe storm events that impacted the central, southern and eastern U.S. in mid-February and early April. There were also two winter storms that impacted the northwest and central U.S. in mid-January.
There have been seven confirmed weather and climate disaster events this year, each with losses exceeding $1 billion. These disasters consisted of five severe storm events and two winter storms.
The U.S. has sustained 383 separate weather and climate disasters since 1980 where overall damages/costs reached or exceeded $1 billion (including CPI adjustment to 2024). The total cost of these 383 events exceeds $2.720 trillion.
Other Notable Events
A spring storm brought rain, heavy snow, damaging winds and thunderstorms across much of the Great Lakes on April 2, knocking out power to over 100,000 people across the region during the height of the storm.
Severe weather across the Southeast produced a hailstorm that caused over $5 million in damages in Rock Hill, SC on April 20.
On April 26, severe weather across the central Plains resulted in the National Weather Service in Omaha, Nebraska issuing 48 tornado warnings—the most the office has ever issued in a single day.
Drought
According to the April 30 U.S. Drought Monitor report, about 17% of the contiguous U.S. was in drought, down about 1% from the beginning of April. Drought conditions expanded or intensified in much of the central and southern Plains, and parts of the Northwest and Southeast this month. Drought contracted or was reduced in intensity across much of the central Mississippi Valley and Upper Midwest, and in parts of the Southwest, northern Plains, Hawaii and Puerto Rico.
Monthly Outlook
Above-average temperatures are favored to impact areas from the southern Plains to the East Coast in May while above-average precipitation is likely to occur from much of the central Plains to the Mid-Atlantic and parts of the Upper Midwest. Drought is likely to persist along portions of the Northern Tier, the Southwest and Hawaii. Visit the Climate Prediction Center’s Official 30-Day Forecasts and U.S. Monthly Drought Outlook website for more details.
Significant wildland fire potential for May is above normal across the Hawaiian Islands and in portions of the Southwest and Florida Peninsula. For additional information on wildland fire potential, visit the National Interagency Fire Center’s One-Month Wildland Fire Outlook.
This monthly summary from NOAA’s National Centers for Environmental Information is part of the suite of climate services NOAA provides to government, business, academia and the public to support informed decision-making. For more detailed climate information, check out our comprehensive April 2024 U.S. Climate Report scheduled for release on May 13, 2024. For additional information on the statistics provided here, visit the Climate at a Glance and National Maps webpages.
Related Links
April U.S. Climate Report (Available May 13, 2024)
National Temperature and Precipitation Maps
Climatological Rankings Explained
State of the Climate Summaries
Here are more “ET’s” recorded from around the planet the last couple of days, their consequences, and some extreme temperature outlooks, as well as any extreme precipitation reports:
Here is some more April 2024 climatology:
Here is More Climate News from Wednesday:
(As usual, this will be a fluid post in which more information gets added during the day as it crosses my radar, crediting all who have put it on-line. Items will be archived on this site for posterity. In most instances click on the pictures of each tweet to see each article. The most noteworthy items will be listed first.)