Monday December 24th… Dear Diary. The main purpose of this ongoing post will be to track United States extreme or record temperatures related to climate change. Any reports I see of ETs will be listed below the main topic of the day. I’ll refer to extreme or record temperatures as ETs (not extraterrestrials)😊.
Christmas Global Surface Record Check
Happy Holidays everyone. The year 2018 only has a week left, so it is time to begin to assess some annual climate statistics. Since I specialize in researching the ratios of hot to cold surface records across the planet as a marker for climate change, let’s look at what the National Climatic Center for Environmental Information has catalogued pertaining to all global records for 2018 and how that stacks up with averages above preindustrial conditions. Here is the link: https://www.ncdc.noaa.gov/cdo-web/datatools/records
Now here is one of their main graphics I stripped off the site then processed making the thing more legible for this discussion with counts updated through 12/24/18:

As a reminder each count can be either a set or tied record. Global records include all reported U.S. records. All hot records are under the red columns and cold blue.
Now let’s divide all hot records by cold for each category. Doing so gives us the following ratios at the end of 2018:
Global Daily Records: 99,060/48,486 = 2.04
Global Monthly Records: 5,508/1,376 = 4.00
Global All Time Records: 567/ 36 = 15.75
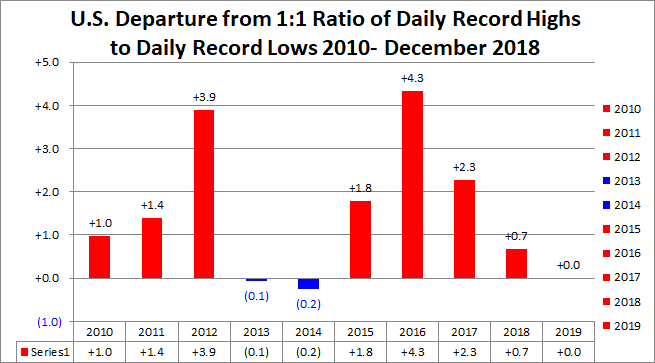
Notice that the more “rare” monthly and all time record data sets have higher ratios than those for daily records. This statistic is what we would expect to see in a warning world due to carbon pollution. At some point in the next few decades it maybe nearly impossible for all-time cold records to be set anywhere on the planet. We will see. The latest research from Dr. Jerry Meehl forecasts the ratio of daily maximum to minimum records across the United States to go up to 15-1 by the end of this century:
We are a long ways from this figure as of 2018, but I am seeing increasing signs of higher ratios with each passing decade since the 1970s:

What we see on this post is a clear sign of climate change with associated dangerous summer record heat becoming more likely for both hemispheres.
Now let’s use the same graphics for United States records through 12/24/18:
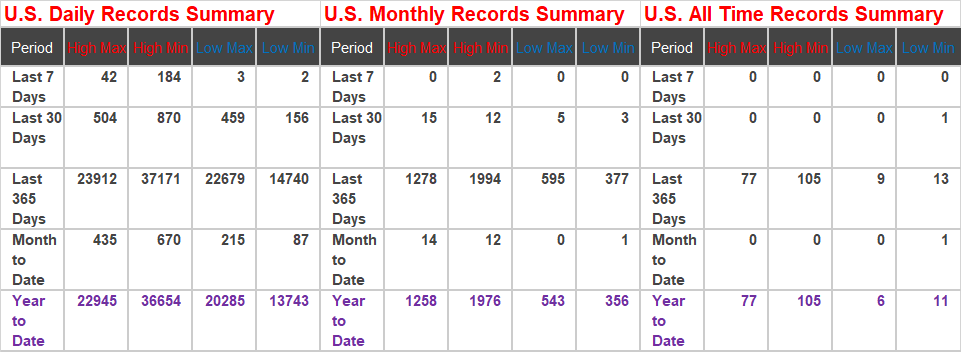
U.S. Daily Records: 59,599/34,028 = 1.75
U.S. Monthly Records: 3,324/899 = 3.60
U.S. All-Time Records: 182/17 = 10.70
The United States ratios are lower than those of Earth overall mainly because of cold North American weather in April and November of this year.
Now let’s compare these ratios with global average departures. Here is a graphic I saw from this morning:
This is an important figure, which is why I share it updated every month.
The temperature graph highlights global climate variability (bumps & noise) and forced long-term warming (upward trend).
More information at https://t.co/cCn2ztGOQ7 using @NASAGISS data. pic.twitter.com/CzX5H8RXE8
— Zack Labe (@ZLabe) December 23, 2018
From Zack’s graph we can see that global averages peaked at about +1.3C above preindustrial conditions in 2016 coming down to about +1.1C by the end of 2018. We are expecting that this short term fall to reverse in 2019.
Since 2015 U.S. ratios have mirrored these small changes in global averages with some alarm. I fully expect that 2019 will be warmer across the U.S. than 2018 as extra heat from a new El Nino kicks into the atmosphere:
Let’s blow up Zack’s chart again for reference:

Anyway, for all of you climatologists and stat geeks out there today’s post was my little Christmas present to you. I hope that you are enjoying your holidays with friends and family keeping in mind hard work that will be necessary after New Years to prevent my stats from going off the rails in the red zone later in the 21st century.
Its Christmas Eve & We Cannot Afford Another 12 Months Of #Climate Denial –@CLIMATEMAMA @tinyboo49 @KayKosmos @Boiarski @EarthAccounting @EcoInternet3 @toonsmag @AntiGOPActivist @lockedmith @DrSmith1966 @SmithTuri @KevasRobert @Kokomothegreat @TheUSASingers @FranncescaRobi1 pic.twitter.com/fQEtOyo60E
— Allan Margolin (@AllanMargolin) December 25, 2018
……………………………………………………………………….
Here is some more weather and climate news from Monday:
This is a superb read
"Woman, scientist, climate advocate: Can you be all three?"
https://t.co/5Oc73u5K6O via @grist#ExtinctionRebellion #ClimateChangeIsReal #EnergyTransition @mzjacobson @KHayhoe @MichaelEMann @natalieben @CarolineLucas @cathmckenna— Prof Peter Strachan (@ProfStrachan) December 24, 2018
Santa is already airborne and @NoradSanta is tracking his every move!
He's currently near New Zealand where it's already Christmas morning pic.twitter.com/xYcgEq7pos
— Greg Diamond (@gdimeweather) December 24, 2018
Collard Greens (I love them) are a staple at many Holiday dinners. But there is a shortage this year because of extreme wet weather, Hurricanes, and California wildfires. My discussion @sciforbes @forbes https://t.co/RZyWp4SqSF
— Marshall Shepherd (@DrShepherd2013) December 24, 2018
These #solar panels use the sun to make water. Solutions are everywhere.
Let's stop wasting time and go #renewables.#PanelsNotPipelines #climate #energy #cdnpoli #StopKM #go100re pic.twitter.com/iwkgf7t9pK
— Mike Hudema (@MikeHudema) December 24, 2018
(As usual, this will be a fluid post in which more information gets added during the day as it crosses my radar, crediting all who have put it on-line. Items will be archived on this site for posterity.)
(If you like these posts and my work please contribute via the PayPal widget, which has recently been added to this site. Thanks in advance for any support.)
The Climate Guy