Mid February U.S. Temperature And Record Scoreboard Update
Friday February 15th… Dear Diary. The main purpose of this ongoing post will be to track United States extreme or record temperatures related to climate change. Any reports I see of ETs will be listed below the main topic of the day. I’ll refer to extreme or record temperatures as ETs (not extraterrestrials)😉
The National Center For Environmental Information has been busy since the government shutdown catching up, processing climatology. I’m pleased to announce that they all U.S. climatological reports are up to date as of February 15th. Also, I had some concern as late as yesterday that the NCEI Records site was not processing some data from our latest extreme cold wave that occurred the last couple of days in January. Records from that time period are beginning to automatically get catalogued, so all is well as far as I know with the thing’s long term reliability.
So, all I needed to do as of today is incorporate the latest data into my “Record Scoreboard” since I presented the thing a few weeks ago before the government shutdown. Here is what we see as of 2/15/2019:
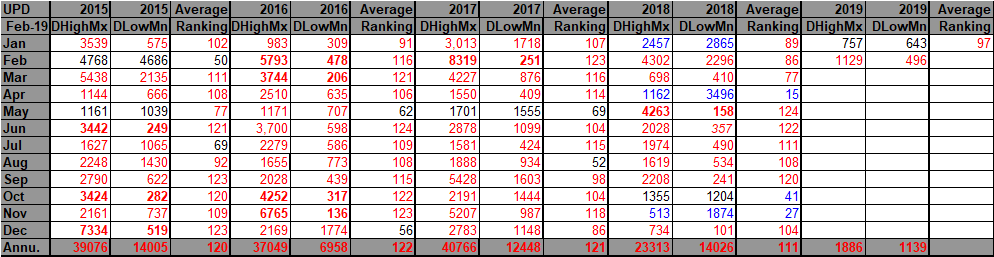
For this data set all monthly ratios of > 10 to 1 DHMX to DLMN or > 10 to 1 DLMN to DHMX are in bold type. The rankings are for the lower 48 states with the warmest ranking since 1895 of average temperatures being 124 and 1 being the coldest as of 2018. Blue colors represent cold months and red warm. Those months with counts close to a 1 to 1 ratio of highs to lows are colored black. Boldly colored months, such as May 2018, have ratios of more than 10 to 1 daily record highs to lows or lows to highs, and are either historically hot or cold. November 2018 had a well below 1 to 1 ratio of record DHMX to DLMN individual counts, so the color I used for this month was blue. NCEI has processed November data across the country, determining that the lower 48 had its 27th coldest month since 1895, also added to the chart. The number 27 falls lower than the mid range (+ or – 10 from 62) or (1-41, 52-72, 73-124), so is also colored blue.
Since I last presented the Record Scoreboard back on 1/1/2019 December indeed had a ranking close to the top 20 warmest Decembers in recorded history since 1895 (21st warmest or 104th coldest as shown). January 2019 gets logged as 29th warmest or 97th coldest despite the severe late month Midwest cold wave.
The year 2018 got ranked as 111th coldest or 14th warmest since 1895.
December 2019 gets catalogued as a red month and January black within the Record Scoreboard. February 2019 is shaping up to be another red or mild winter month. Looking at all the red numbers on the Record Scoreboard it doesn’t require a brain surgeon to see that the U.S. climate has become skewed towards warmth, and we know why.
Also for perusal is my Record Scoreboard for counts of daily record high minimums verses low maximums:

My next question is, of course, how skewed towards warmth these Record Scoreboards will get not only through 2019 but beyond? The more red we will see on the thing in the future the worse climate disruptions such as wildfires, strong hurricanes, droughts and flooding will be. It’s just that simple.
We’ll present the Record Scoreboard again with updates and summaries from this winter in early March.
…………………………………………………………………………………………….
Here is some more climate and weather news from Friday
(As usual, this will be a fluid post in which more information gets added during the day as it crosses my radar, crediting all who have put it on-line. Items will be archived on this site for posterity.)
(If you like these posts and my work please contribute via the PayPal widget, which has recently been added to this site. Thanks in advance for any support.)
The Climate Guy