Friday March 29th… Dear Diary. The main purpose of this ongoing post will be to track United States extreme or record temperatures related to climate change. Any reports I see of ETs will be listed below the main topic of the day. I’ll refer to extreme or record temperatures as ETs (not extraterrestrials).😉
New Indian Record Count Data
The country I wanted to research after Mexico was India, being another large territory with many stations fairly close to the equator. Would we continue to see warming trends, which stood out not only in the U.S., Russia, Canada, and in Mexico, after plugging in NCEI record count numbers for several months? Why yes. Unfortunately I learned that there was no National Center for Environmental Information record counts from India prior to the mid 1970s, but we still saw some definite but disturbing trends.
Here are the main decadal bar charts that I always present for these data sets, this time from India:
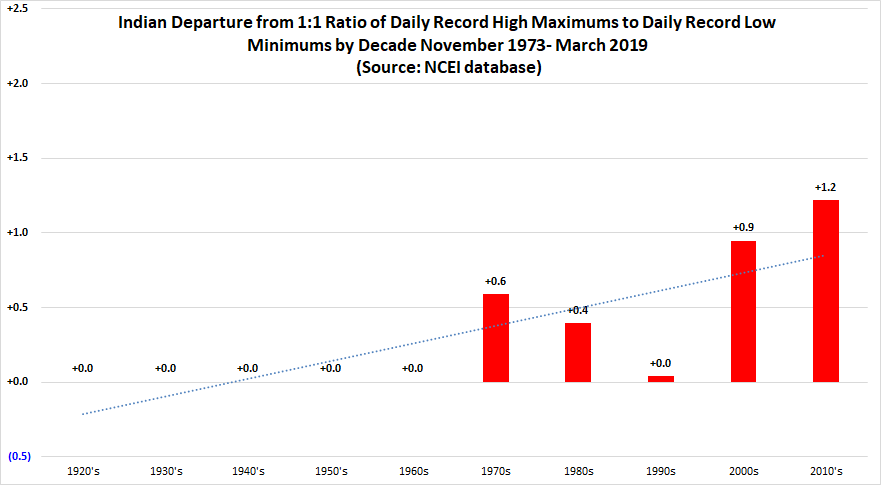
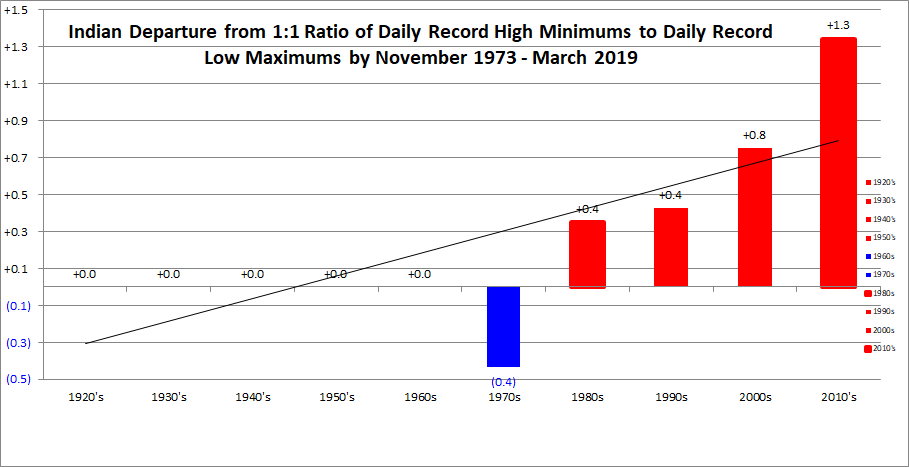
As we can see there is a definite warming trend here with ratios rising with time.
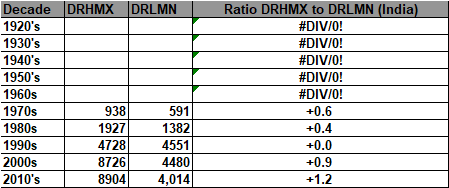
Here are the raw numbers. Remember that one count can be a tied record from an individual station that has been reporting data for at least 30 years or one that has been reporting data for much longer and has set a new record by several degrees:
I also spotted from my Excel programs another trend in association with the two most recent “Super El Ninos.” Strong El Ninos release a lot of pent up ocean heat content into the atmosphere resulting in spikes in planetary temperature averages. These spikes are prevalent across large countries and show up, as well, in record count ratios.
Here is what we see for 2016 from India, the last Super El Nino:

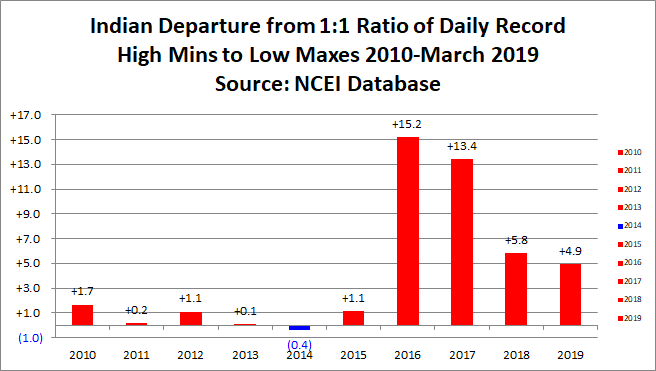
There is not too much of a correlation when we compare daily record maximums to minimums, but the planetary record of 2016 stands out in India, as well, when we compare daily record high minimums to low maximums.
We also see a decrease in ratios since planetary averages have dipped below the spike of 2016.
Just one more point. When we compare decadal ratios of daily high maximums to low minimums of those for the United States with India there are some uncanny similarities for the 2000s and 2010s:

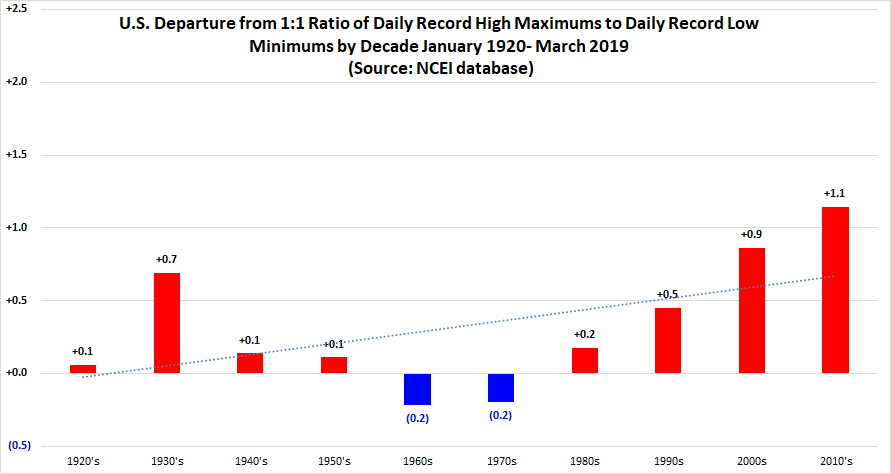
Keep in mind that geographically India and the United States are on opposite sides of the planet. I have a hypothesis that decadal ratios in the future can be predicted in conjunction with planetary averages above preindustrial conditions. For example, in the United States for the 2010s it appears that the final ratio of record daily maximum counts to minimums will be 2.1 or 2.2 to 1 as planetary averages for the decade come in at roughly .9C above preindustrial conditions. If the 2020s average out at 1.2C above preindustrial conditions we may see that ratio for the United States, India and other countries at 3-1 or slightly higher.
Why is this important? Because, as noted by my data encompassing seasonal variability, the higher the ratios the more climate disruption. Not only will we see worse heat waves as the planet warms, but perhaps we can predict with a fair degree of certainty the scope and magnitude of life threatening heat waves per each tick up on the planetary temperature average scale, or at least this is my hope for future research. We may be able to peg percentages or probabilities on such events as future California wildfires, as well.
Remember Michael from last year? That devastating hurricane slammed into the Florida Panhandle as a record for so late in the season cat 4 hurricane after interacting with a record warm atmosphere over the Southeast. Numerous record high temperatures were set over the Southeast the week before Michael made landfall. I’m quite sure that had the Southeast been cooler Michael would not have been nearly as strong. Forecasting record ratios might be of some use refining the probability of seeing future Michael type storms during any given decade or year.
There are lots of ideas here for researchers above my pay grade to work on. Drop me a note if you have others I have not thought of. My next country to investigate or pick on will be Australia.
…………………………………………………………………..
Here is some more weather and climate news from Friday:
(If you like these posts and my work please contribute via the PayPal widget, which has recently been added to this site. Thanks in advance for any support.)
Guy Walton- “The Climate Guy”
Does the heat island effect in cities exaggerate the ratios in today’s post. Also, in climate change research generally, how is the heat island effect discounted?
Hi Alan. In answers to your questions, there are heat island effects, but the Weather Service does a good job making sure that each weather station is calibrated to many specific standards. Also, researchers make sure that they select many stations in rural areas along with some city sites when looking at record ratio and average temperature trends.