Friday May 31st… Dear Diary. The main purpose of this ongoing post will be to track United States extreme or record temperatures related to climate change. Any reports I see of ETs will be listed below the main topic of the day. I’ll refer to extreme or record temperatures as ETs (not extraterrestrials)😉
Summer Average Temperature Forecast For The United States
Welcome to boreal summer everyone, or the three months that are June through August. Meteorologically and on climate summaries summer is considered to start on June 1st instead of when the solstice occurs later in the month. So how will summer 2019 stack up compared to long term temperature averages across the United States? Will we continue to see the climate crisis signature of hotter than average conditions? Let’s try to make a forecast as usual at the start of a new season.
So how did the forecast work out for spring 2019? Here is the post for that forecast:
Let’s fill in the ranking data through April for a partial verification:
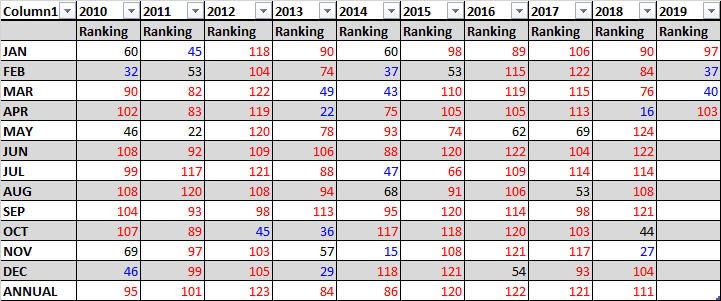
The spring started out colder than average across the CONUS but got progressively warmer. I suspect that May will be slightly above the average ranking of 62 once data for that month is processed around June 7th. As forecast the ranking for spring 2019 should be around 80 + or – 10, but we won’t know until NCEI averages are processed in a few days. Rankings for the lower 48 states started in 1895, so the highest number would be 125.
All this means that as suspected the spring turned out to be slightly above average temperature wise across most of the U.S. Of course, the big main story for spring 2019 was not the temperature but the flooding rainfall.
O.k. Now that we have established that our forecast was half decent for the last season let’s use the same techniques to forecast temperature rankings for this summer.
First, let’s look at current water temperatures anomalies surrounding North America:
These have cooled more off the West Coast since March 1st due to strong cold systems moving into the West. Temperatures remain above average from the Gulf Coast into much of the Northeast coast. Off hand I’d say that sea surface temperatures look to be a wash affecting air temperatures across the United States, except that we have the presence of a weak El Nino. The El Nino could tip the balance towards warmth, but only if it does not start to diminish by August.
Second, I like to look at the strength of the Hudson Bay low or polar vortex at the start of any season:

The vortex swirling around Hudson Bay looks quite average for the last day of May. As opposed to the highly amplified 500 millibar pattern of the last few weeks that led to record cold in the West and record heat in the Southeast we see a more typical pattern today. Warm pockets in the Arctic around the vortex, though, may lead eventually to above average temperatures across the lower 48 states. This factor points to only slightly above average temperatures in my book.
Here is the National Weather Service forecast for summer, which I agree with:

Once more the Midwest and Plains could see below average temperatures with above average warmth on both coasts. Overall, summer 2019 will probably verify at slightly above average.
Last, we can get another clue looking at prior ranking and temperature record count data. For this I like to drag out that “Record Scoreboard” (updated through 5/29/19):
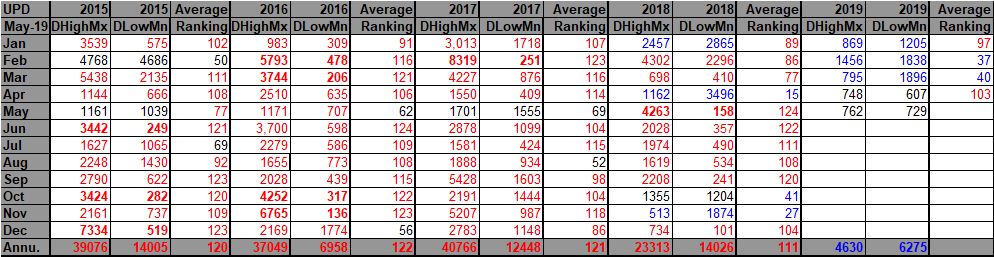
Again here we see clues that spring started out colder than average but got progressively milder. March is colored “blue” because the ratio of daily high max to low min records are below one to one. April is colored “black” because the ratio of daily high max to min records are near one to one. May could eventually be colored “red” once numerous record maxes get into the NCEI system in the next few days from the Southeast.
I expect this warming trend to continue with August toping out as the hottest month relative to average.
Not all seasons in the near future will see above average temperatures, but seasonal forecasters are beginning to”chuck it,” discounting colder than average scenarios due to carbon pollution.
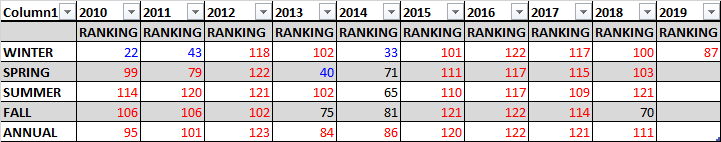
Again, here are all seasons ranked for this decade:
Notice that the past four summers had a ranking at or above 109, but that of 2014 had a near average ranking of 65. As of 2019 the top ranking for any month or season would be 125 since climatological rankings for the United States started in the year 1895. I think that this summer will be ranked below that of the last four. Carbon pollution is definitely making below average seasons more rare. I’m going to guess that the summer of 2019 ranking will be around 90 + or – 10, with average confidence given all of the factors in this post.
We will see how this forecast pans out around September 1st.
Have a great summer!
………………………………………………………………………………………………………
Here is some more climate and weather news from Friday:
(As usual, this will be a fluid post in which more information gets added during the day as it crosses my radar, crediting all who have put it on-line. Items will be archived on this site for posterity. In most instances click on the pictures of each tweet to see each article.)
Here are some “ETs” from the last few days:
(If you like these posts and my work please contribute via the PayPal widget, which has recently been added to this site. Thanks in advance for any support.)
The Climate Guy