Thursday August 15th… Dear Diary. The main purpose of this ongoing blog will be to track United States extreme or record temperatures related to climate change. Any reports I see of ETs will be listed below the main topic of the day. I’ll refer to extreme or record temperatures as ETs (not extraterrestrials).😉
Methane And The Climate…New Evidence To Avoid Fracking + NOAA Determines That July 2019 Was The Hottest Month In Recorded History
Well folks. I learned something new today. Did you know that methane released by fracking processes is slightly different chemically than methane released naturally, say from the flatulence of cattle? Pardon the pun, but this is no B.S. New research from Cornell University suggests that this “methane has less carbon-13 relative to carbon-12 (denoting the weight of the carbon atom at the center of the methane molecule) than does methane from conventional natural gas and other fossil fuels such as coal.”
Since fracking methane has a different isotope from regular methane it can more readily be tracked to see if the process of fracking is mostly responsible for the huge uptick in methane concentrations in the atmosphere worldwide. The results are startling as reported by Desdemona Despair:
Fracking prompts global spike in atmospheric methane – “This recent increase in methane is massive”

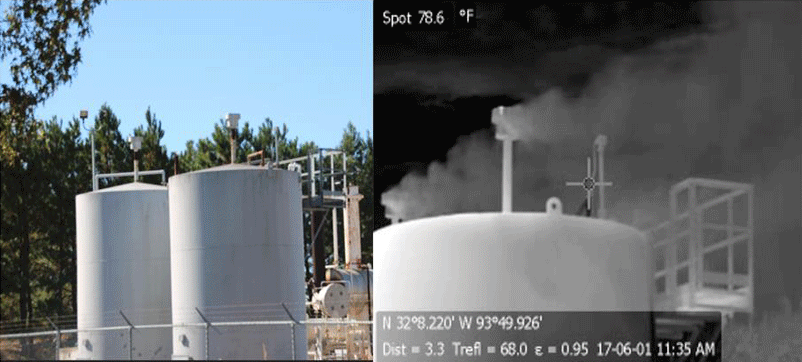
Gas storage tanks receiving natural gas from feeder pipelines before compression for transport in high-pressure pipelines at the Haynseville shale formation, Texas. The photo on left was taken with a normal camera. The photo on the right was taken with a forward-looking infrared (FLIR) camera tuned to the infrared spectrum of methane, allowing visualization of methane, which is invisible in the normal camera view and to the naked eye. Photo: Sharon Wilson / Howarth, 2019 / Biogeosciences
By Blaine Friedlander
14 August 2019
(Cornell Chronicle) – As methane concentrations increase in the Earth’s atmosphere, chemical fingerprints point to a probable source: shale oil and gas, according to new Cornell research published 14 August 2019 in Biogeosciences, a journal of the European Geosciences Union.
The research suggests that this methane has less carbon-13 relative to carbon-12 (denoting the weight of the carbon atom at the center of the methane molecule) than does methane from conventional natural gas and other fossil fuels such as coal.
This carbon-13 signature means that since the use of high-volume hydraulic fracturing – commonly called fracking – shale gas has increased in its share of global natural gas production and has released more methane into the atmosphere, according to the paper’s author, Robert Howarth, the David R. Atkinson Professor of Ecology and Environmental Biology at Cornell.
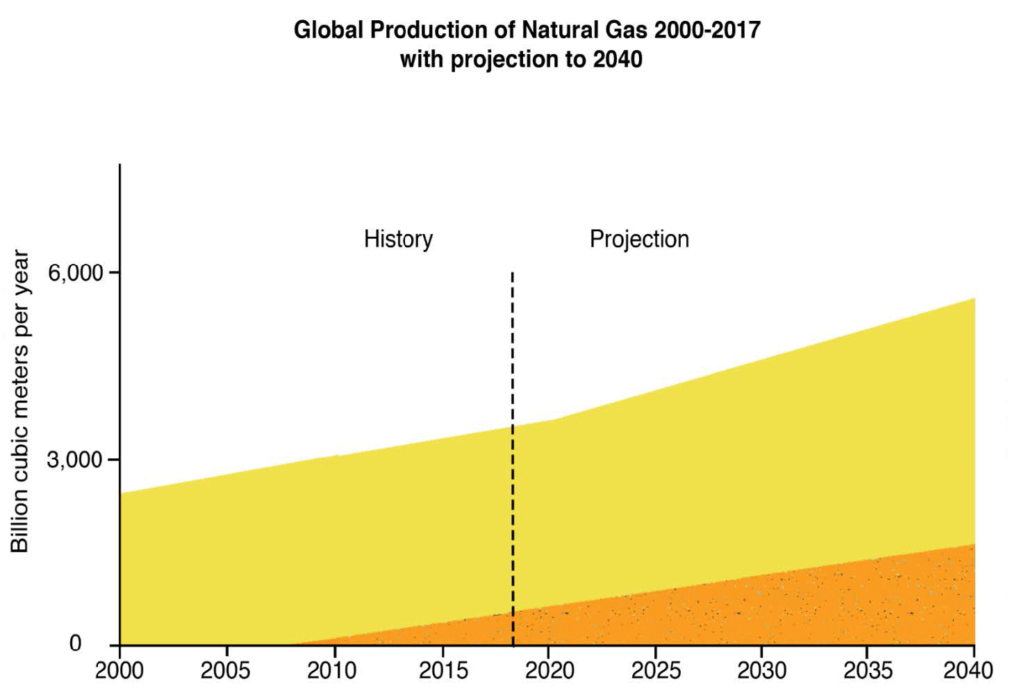
About two-thirds of all new gas production over the last decade has been shale gas produced in the United States and Canada, he said.
While atmospheric methane concentrations have been rising since 2008, the carbon composition of the methane has also changed. Methane from biological sources such as cows and wetlands have a low carbon-13 content – compared to methane from most fossil fuels. Previous studies erroneously concluded that biological sources are the cause of the rising methane, Howarth said.
Carbon dioxide and methane are critical greenhouse gases, but they behave quite differently in the atmosphere. Carbon dioxide emitted today will influence the climate for centuries to come, as the climate responds slowly to decreasing amounts of the gas.
Unlike its slow response to carbon dioxide, the atmosphere responds quickly to changes in methane emissions.

Global production of shale gas and other forms of natural gas from 2000 to 2017, with projections into the future from EIA (2016). Redrawn from EIA (2016) with data from IEA (2017). Graphic: Howarth, 2019 / Biogeosciences
“Reducing methane now can provide an instant way to slow global warming and meet the United Nations’ target of keeping the planet well below a 2-degree Celsius average rise,” Howarth said, referring to the 2015 Paris Agreement that boosts the global response to climate change threats.
Atmospheric methane levels had previously risen during the last two decades of the 20th century but leveled in the first decade of 21st century. Then, atmospheric methane levels increased dramatically from 2008-14, from about 570 teragrams (570 billion tons) annually to about 595 teragrams, due to global human-caused methane emissions in the last 11 years.
“This recent increase in methane in massive,” Howarth said. “It’s globally significant. It’s contributed to some of the increase in global warming we’ve seen and shale gas is a major player.
“If we can stop pouring methane into the atmosphere, it will dissipate,” he said. “It goes away pretty quickly, compared to carbon dioxide. It’s the low-hanging fruit to slow global warming.”
This research was funded by the Park Foundation and the Atkinson Center.
Study: Fracking prompts global spike in atmospheric methane
Is shale gas a major driver of recent increase in global atmospheric methane?
ABSTRACT: Methane has been rising rapidly in the atmosphere over the past decade, contributing to global climate change. Unlike the late 20th century when the rise in atmospheric methane was accompanied by an enrichment in the heavier carbon stable isotope (13C) of methane, methane in recent years has become more depleted in 13C. This depletion has been widely interpreted as indicating a primarily biogenic source for the increased methane. Here we show that part of the change may instead be associated with emissions from shale-gas and shale-oil development. Previous studies have not explicitly considered shale gas, even though most of the increase in natural gas production globally over the past decade is from shale gas. The methane in shale gas is somewhat depleted in 13C relative to conventional natural gas. Correcting earlier analyses for this difference, we conclude that shale-gas production in North America over the past decade may have contributed more than half of all of the increased emissions from fossil fuels globally and approximately one-third of the total increased emissions from all sources globally over the past decade.
……………………………………………………..
In conclusion, just like we learned with the production of ethanol during the 2000s, the production of natural gas in the 2010s is a big no no for the climate. Mankind intended for these two sources of energy to be bridges towards total green energy. Well, theses bridges are rickety, and we are likely to fall to our climate crisis deaths if they aren’t replaced quickly by solar and wind power. Let’s not “natural” gas ourselves to death.
…………………………………………………………………
Part B of today’s main topic news is the sad fact that NOAA officially declared that July 2019 was the hottest month globally in recorded history. One can see from this NOAA chart where July stands in relation to prior July’s:
To delve deeper into this particular milestone in climate, weather and the Earth’s history I’m going to post information on this hot stat from Climate Central:


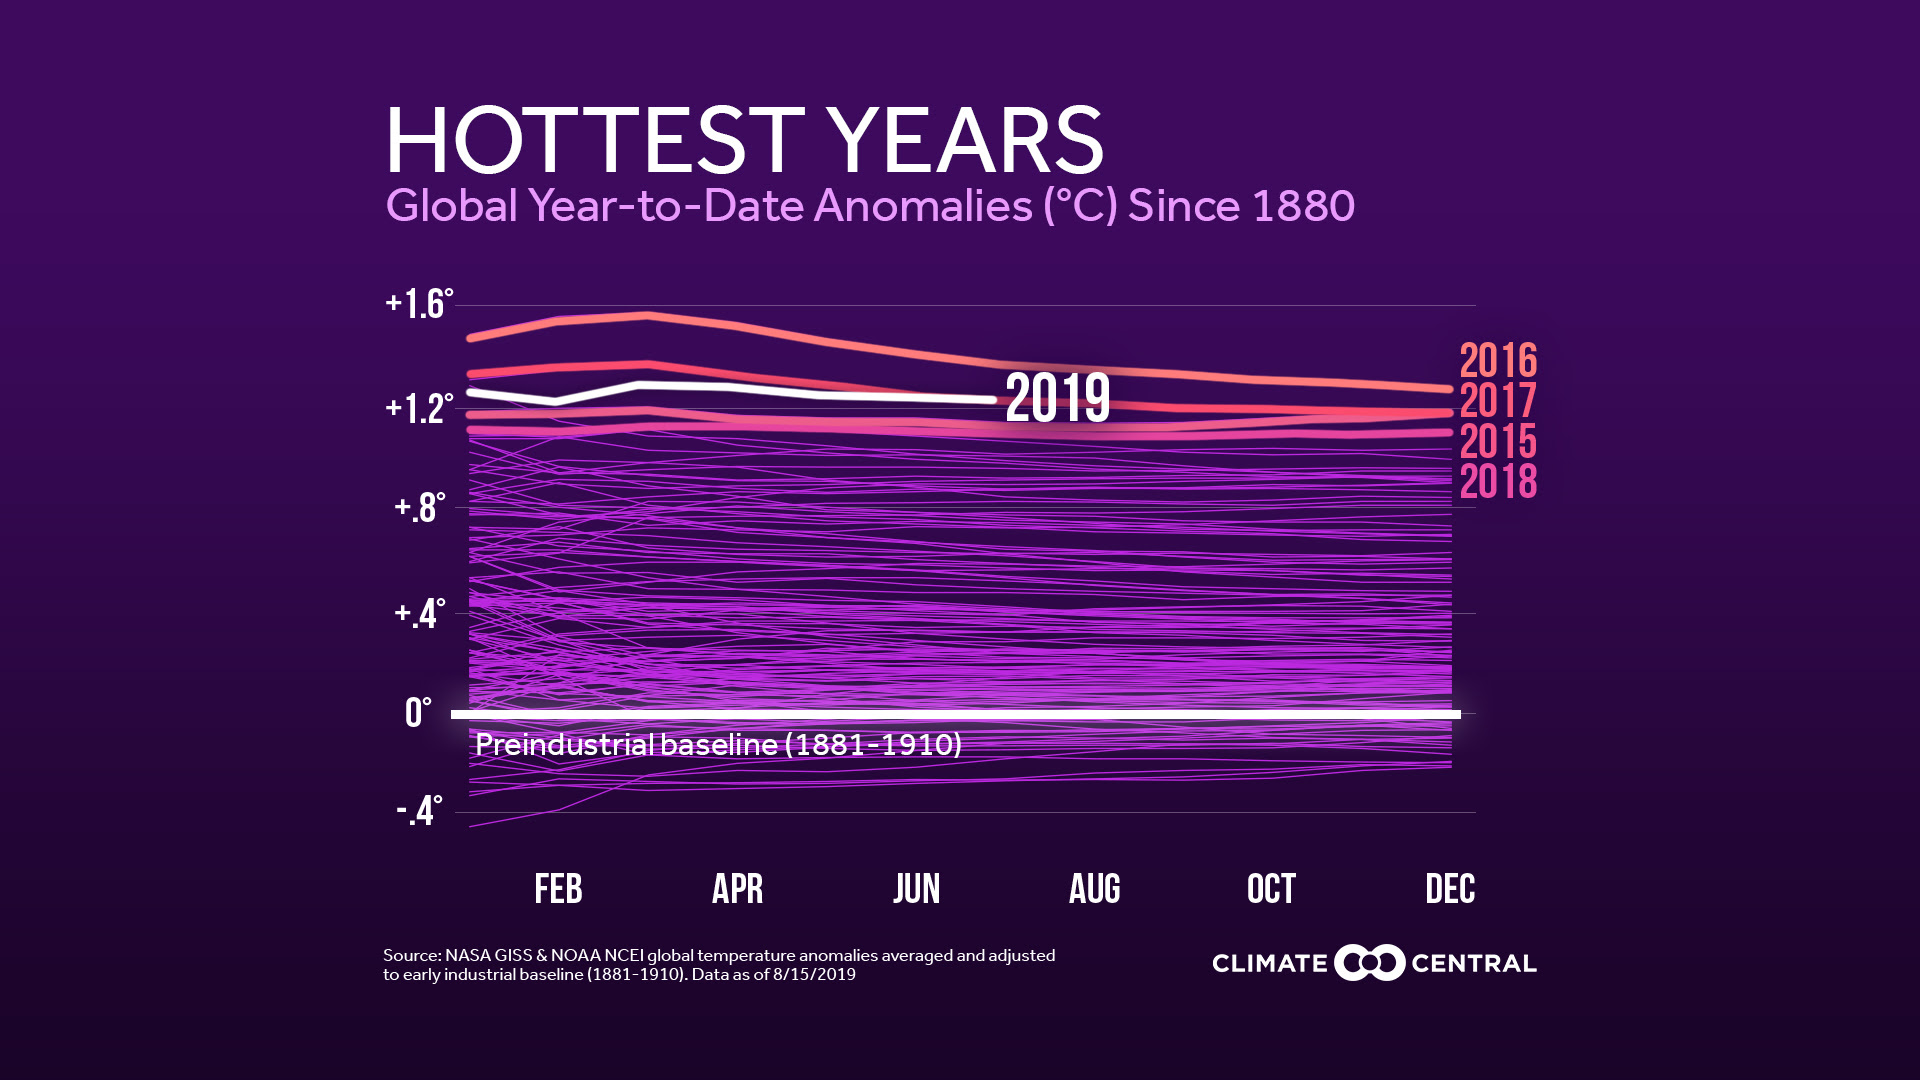
Today, NOAA named this past July the hottest month on record, confirming statements from the World Meteorological Organization and Europe’s Copernicus Climate Change Service. While this event is historic, it is by no means an exception. The past five years have been the warmest on record globally, leading to unprecedented heat that is projected to intensify as the climate warms.
To show how this warming has affected your area, Climate Central has paired global graphics with a new look into local temperature records. The local analysis compiles daily temperature records for a station’s entire period, and shows the percentage of records in each decade that were hot or cold. Most local observations follow the global trend, with record highs outnumbering lows in recent years. Here are some highlights:
- Across the country, this decade has seen twice as many record highs as record lows (according to meteorologist Guy Walton’s database).
- The 2010s have the greatest imbalance of record highs in 133 of the 244 cities analyzed (55%).
- That’s nearly four times higher than the next-closest decade (2000s).
- For six southwestern cities, all of this decade’s daily records are highs—as those cities haven’t had a record low since before 2010.
- While the 1930s do hold notable heat records, only 34 of the cities analyzed (14%) still have this as their decade with the highest percent of record highs.
- Dust Bowl-era heat is being overtaken by more recent human-caused warming from greenhouse gases. The urban heat island effect also contributes—especially to warming nights.
Globally, the recent warming has been sharpest in the Arctic—and this July was no exception. Temperatures in Alaska shattered records by several degrees, and hundreds of wildfires burned in Alaska, Siberia and Greenland. Arctic sea ice extent also set a new record low for July, and Greenland lost 12.5 billion tons of ice in just one day. The polar warmth followed an unprecedented heat wave across Western Europe, which would have been “extremely unlikely without climate change” (according to World Weather Attribution).
Extreme heat is the deadliest form of weather in the U.S., but it’s far from the only issue. Warming temperatures also increase the frequency and intensity of other extreme weather—harming health, stressing food and water supplies, shifting seasons and ecosystems, elevating sea levels, damaging infrastructure and economies, and threatening ways of life. Curbing these hazards may be the greatest challenge of our time, but mitigating solutions exist from renewable energy to more efficient transportation and agriculture.
METHODOLOGY
Local records: Series of daily records were identified each year since the start of the period of record, then aggregated by decade. To be clear, this not only represents the location’s current record for each calendar day, but a count of the records as they happened since that station thread was established. This series is based on Threadex data, when available, so it represents each of the local historic records as accounted by NOAA/NCEI; records over time may exist for different siting locations, corresponding with the NOAA supported records.
Global data: Monthly global temperature analyses are independently calculated by NASA and NOAA/NCEI. Climate Central combines the NOAA and NASA information to re-baseline global temperatures using an earlier pre-industrial period of 1881-1910 in response to the internationally agreed upon goal of 2°C established in the Paris Climate Change Agreement.
………………………………..
Will this July 2019 record be broken again soon? Probably during the next El Nino year before 2025. Will humans stop the ever increasing trend with warming global temperatures? That remains to be seen.
Here is more climate and weather news from Wednesday:
(As usual, this will be a fluid post in which more information gets added during the day as it crosses my radar, crediting all who have put it on-line. Items will be archived on this site for posterity. In most instances click on the pictures of each tweet to see each article.)
(If you like these posts and my work please contribute via the PayPal widget, which has recently been added to this site. Thanks in advance for any support.)
Guy Walton- “The Climate Guy”