Saturday January 11th… Dear Diary. The main purpose of this ongoing blog will be to track United States extreme or record temperatures related to climate change. Any reports I see of ETs will be listed below the main topic of the day. I’ll refer to extreme or record temperatures as ETs (not extraterrestrials).😉
Main Topic: Climate Central’s Assessments On Australia And 2019
Dear Diary. This week Climate Central came out with two major reports, one on the horrific situation in Australia, and one about 2019 U.S. climatology with a statistic from yours truly. There are plenty of links here for you to explore. These are quite educational:

REPORTING BULLETIN: DATA, GRAPHICS & TIPS FOR CLIMATE CHANGE COVERAGE
ATLANTA | January 9, 2020
So far this Australian fire season, more than 15 million acres have burned, which equals roughly the size of the state of West Virginia. For perspective, this is dramatically larger than the area burned during the past two years of fires in California–2018 (1.96 million acres) and 2019 (260,000 acres). The Australian state of New South Wales, home of Sydney, has more than 100 active fires.
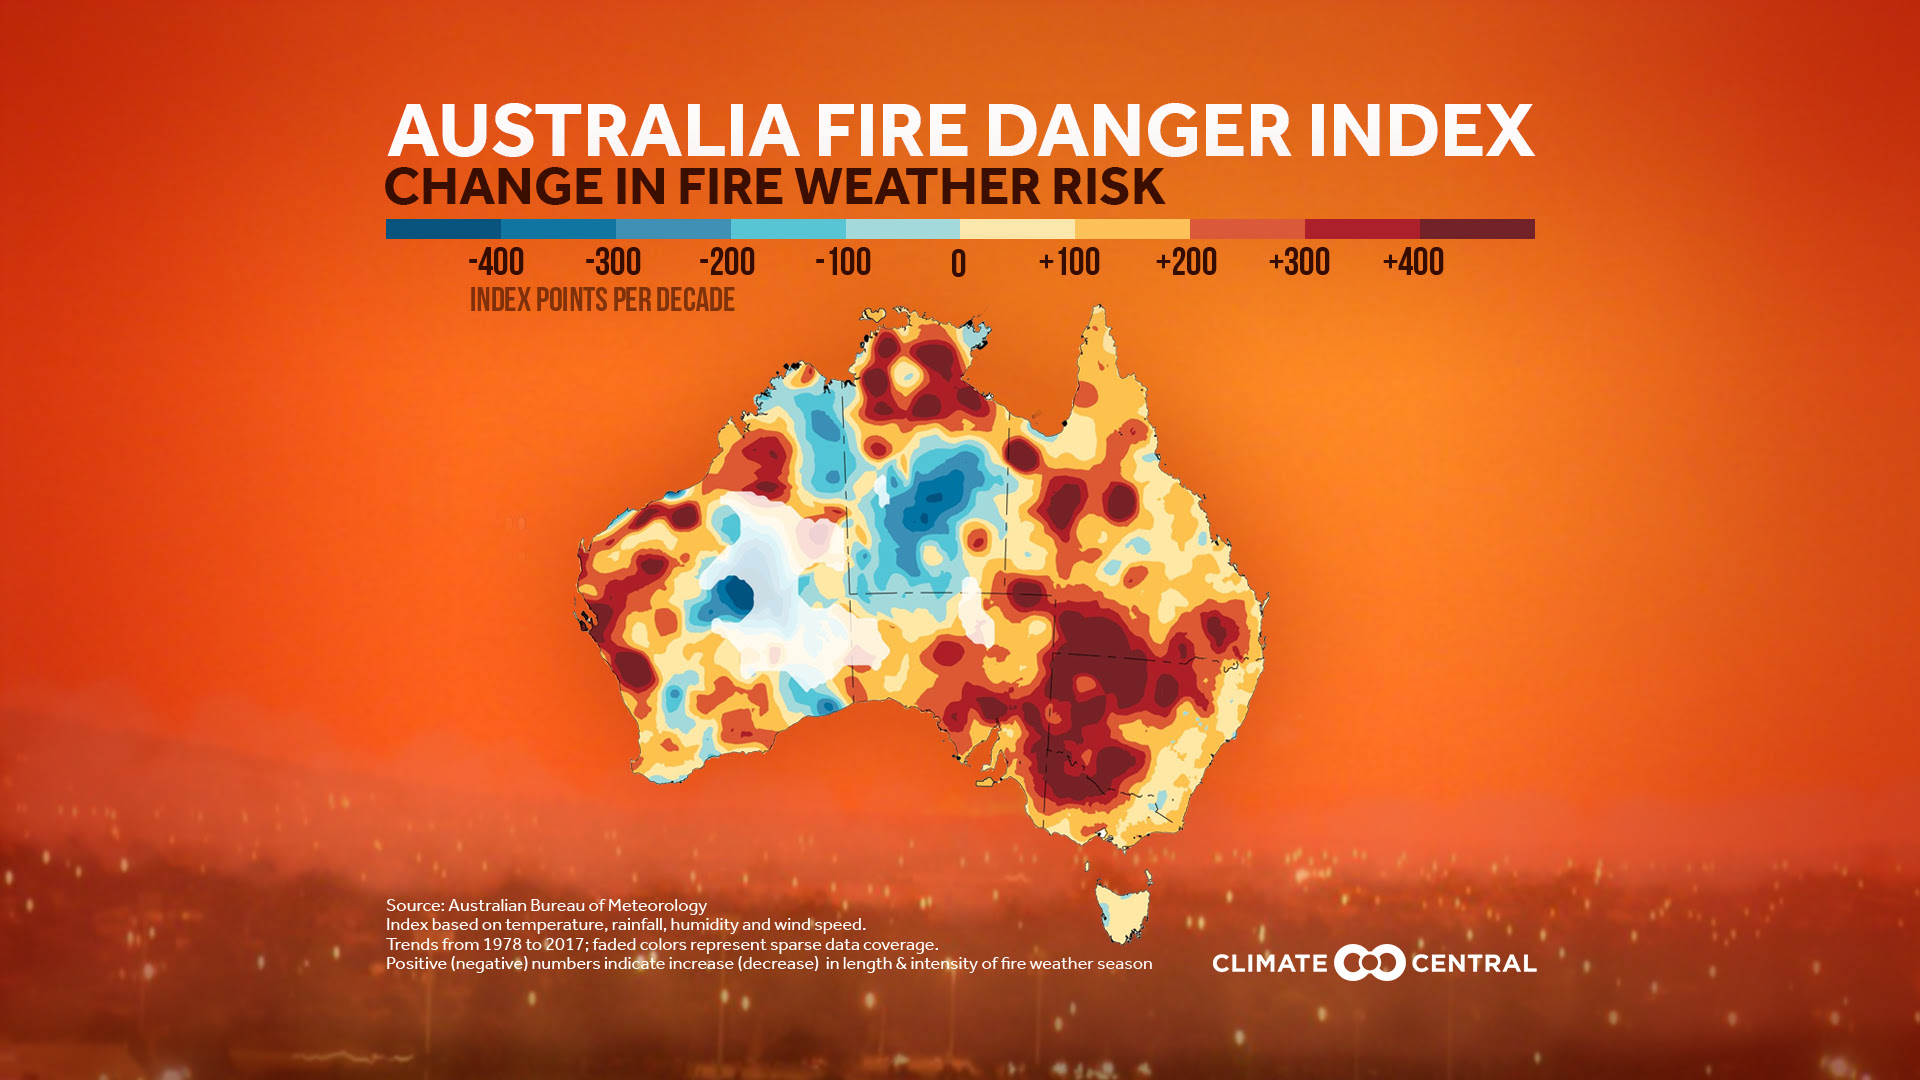
Australia Fire Danger Index
With Title: JPG • PNG | No Title: JPG • PNG
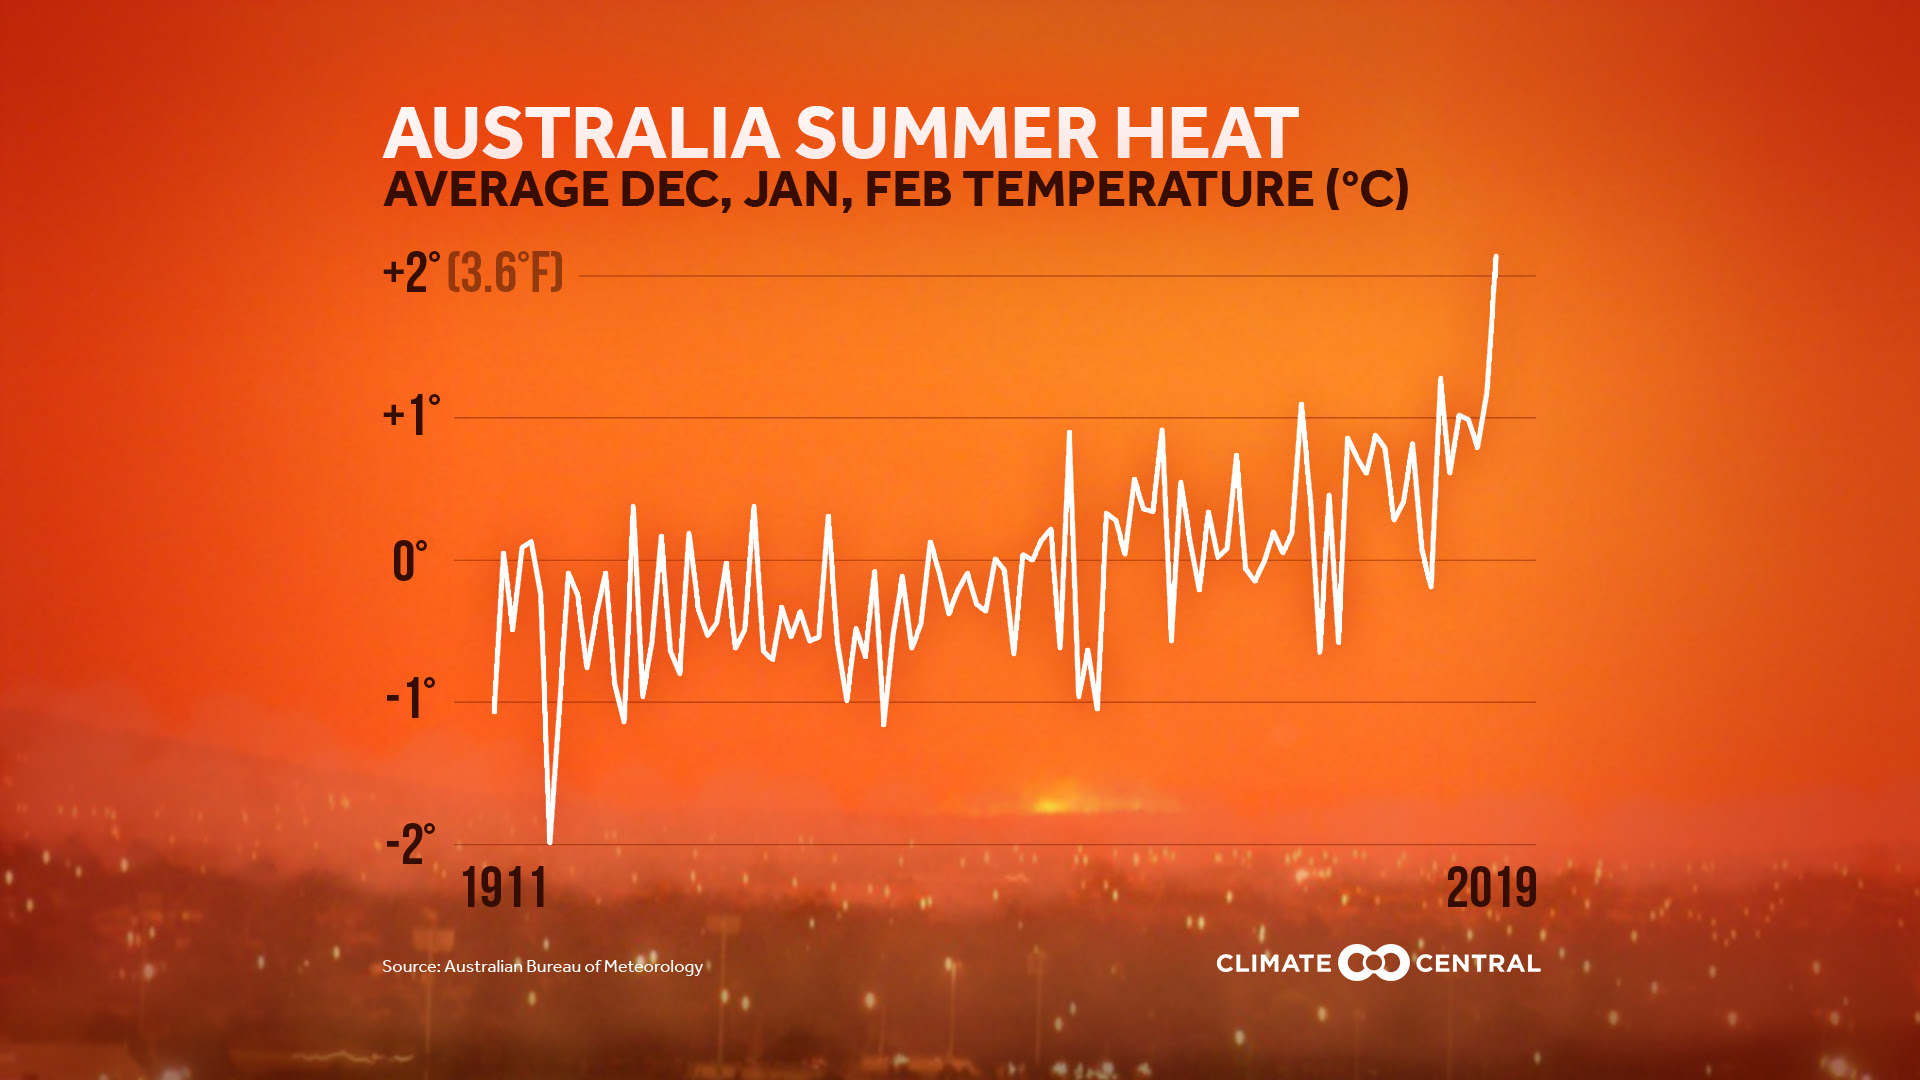
Australia Summer Heat
With Title: JPG • PNG | No Title: JPG • PNG
THE CLIMATE CHANGE ROLE
- There has been a long‑term increase in both extreme fire weather and the length of the fire season across large parts of Australia
- Although there is year-to-year variability in the fire risk (via ENSO, Indian Ocean Dipole, and Southern Annular Mode), climate change is producing more dangerous long-term conditions for bushfires
- Observations indicate an earlier start of the fire season, particularly in parts of southern and eastern Australia, where the population is highest
- Fire risk will continue to increase as greenhouse gas emissions cause further warming
KEY STATISTICS
- Last month was the driest and hottest December on record in Australia; December average temperature was 5.8°F (3.2°C) above average
- 2019 was the hottest and driest year on record in Australia (100+ years of records)
- The hottest two days on record for the country came during this stretch: a record nationwide average of 105.6°F on December 17 was broken the very next day at 107.4°F
- The monthly averaged Australian Forest Fire Danger Index in December was the highest on record for most of the country
RESOURCES
- Bushfires and Climate Change in Australia – a plain-language summary from the Australian National Environmental Science Program
- Australia’s 2019 State of the Climate from the Commonwealth Scientific and Industrial Research Organisation (CSIRO) and the Bureau of Meteorology (BOM)
- 2019-20 Australia Bushfires summary from Climate Signals
- Climate impact analysis of 2018 Queensland fire weather from the BAMS report Explaining Extreme Events of 2018
- Australian climate summaries archive from BOM
- SciLine – a service of AAAS that can put you in contact with scientists with expertise in the relationship between wildfires and climate change
- Watch and share this YouTube animation from the Australian National University – Correlation of southern Australian temperature and precipitation with wildfires exceeding one million acres
Here is Climate Central’s 2019 Assessment:
https://medialibrary.climatecentral.org/resources/2019-in-review-u.s.-climate-rankings
Version:1.0 StartHTML:000000249 EndHTML:000046821 StartFragment:000011131 EndFragment:000046765 StartSelection:000011189 EndSelection:000046749 SourceURL:https://medialibrary.climatecentral.org/resources/2019-in-review-u.s.-climate-rankings 2019 in Review: U.S. Climate Rankings | Climate Matters
2019 in Review: U.S. Climate Rankings
Resumen del 2019: Ranking Climático en EE.UU.
Jan 8, 2020
NOAA released the U.S. climate data for 2019. It was the second-wettest year on record with temperatures above average, wrapping up the warmest decade on record.
La NOAA ha publicado los datos climáticos de los Estados Unidos para 2019. Fue el segundo año de mayor precipitación registrado con temperaturas por encima del promedio, concluyendo la década más cálida en récord.
- Market Versions Available
- Market Versions Available
The nation’s year-end climate numbers are in. 2019 was the second-wettest year on record in the U.S., and temperatures were above average despite regions that were among the only cool spots on the planet. 2019 also concluded the warmest decade on record—the 2010s were the warmest of the past five decades for 87% of the 244 cities analyzed. Here’s a recap of the year’s U.S. climate rankings, before global statistics are released next week.
Find all local JPG and PNG versions here
Rain was the defining story of the year—again. Nationally-averaged precipitation missed the previous record by 0.18 inches, bumping 2018 to 4th-wettest in the 125-year dataset. Five states experienced their wettest year on record, while another 18 finished the year in the top ten. Rainfall was most extreme in the Upper Midwest and Mississippi River basin, where months-long floods cost billions of dollars in damage to farms and homes. While climate change has a mixed effect on overall precipitation, heavy rain is intensifying as rising temperatures evaporate more water into the atmosphere.
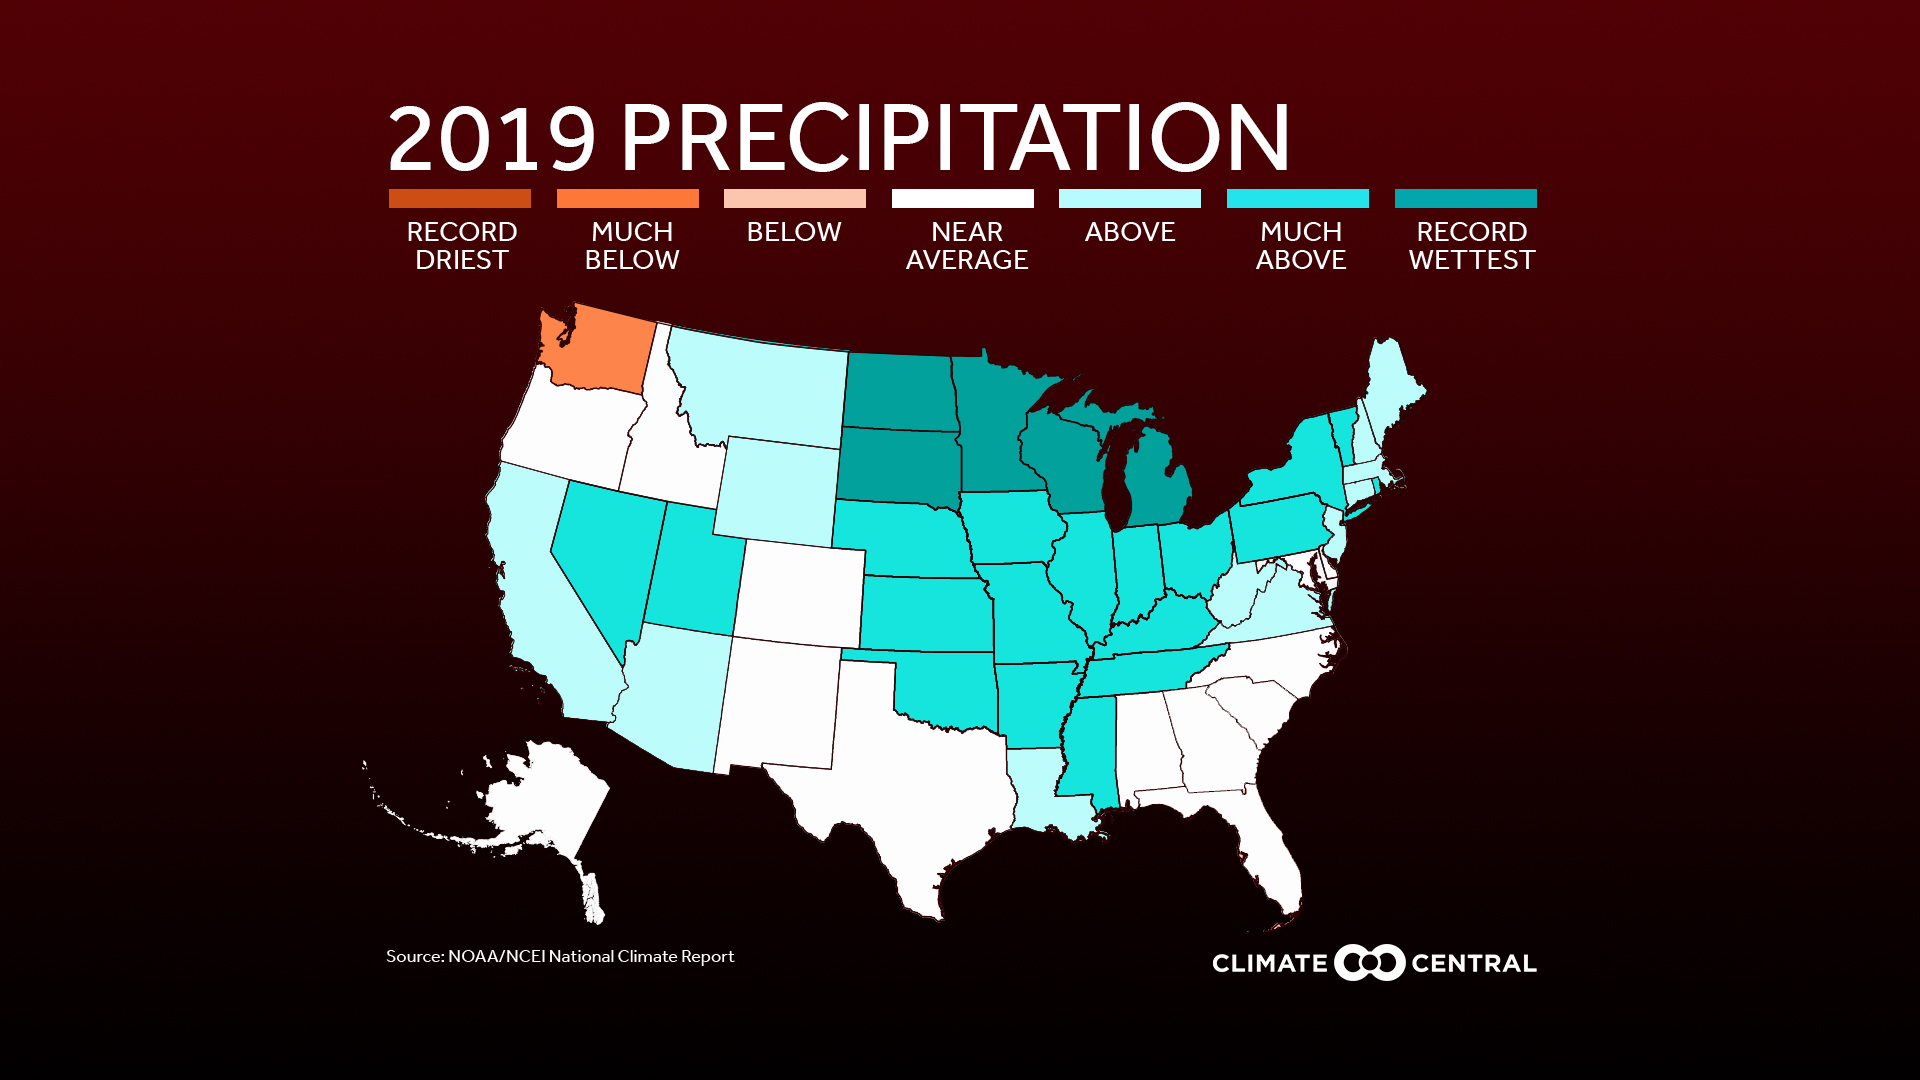
| With title: JPG PNG | No Title: JPG PNG |
U.S. temperatures weren’t as scorching as the rest of the globe, but some regions still took the heat. Alaska set a new annual temperature record after historic highs of 90°F in Anchorage and historic lows of Arctic sea ice extent. North Carolina and Georgia also experienced their hottest years on record, and three other states were second-hottest. Seventeen states had one of their 10 hottest years, while none had one of their 10 coldest. Interestingly, the NOAA report shows that nightly minimums were more above-average than maximum temperatures. This follows a long-term trend: according to meteorologist Guy Walton’s database, record-high minimums outnumbered record-high maximums by 34% in the 2010s.
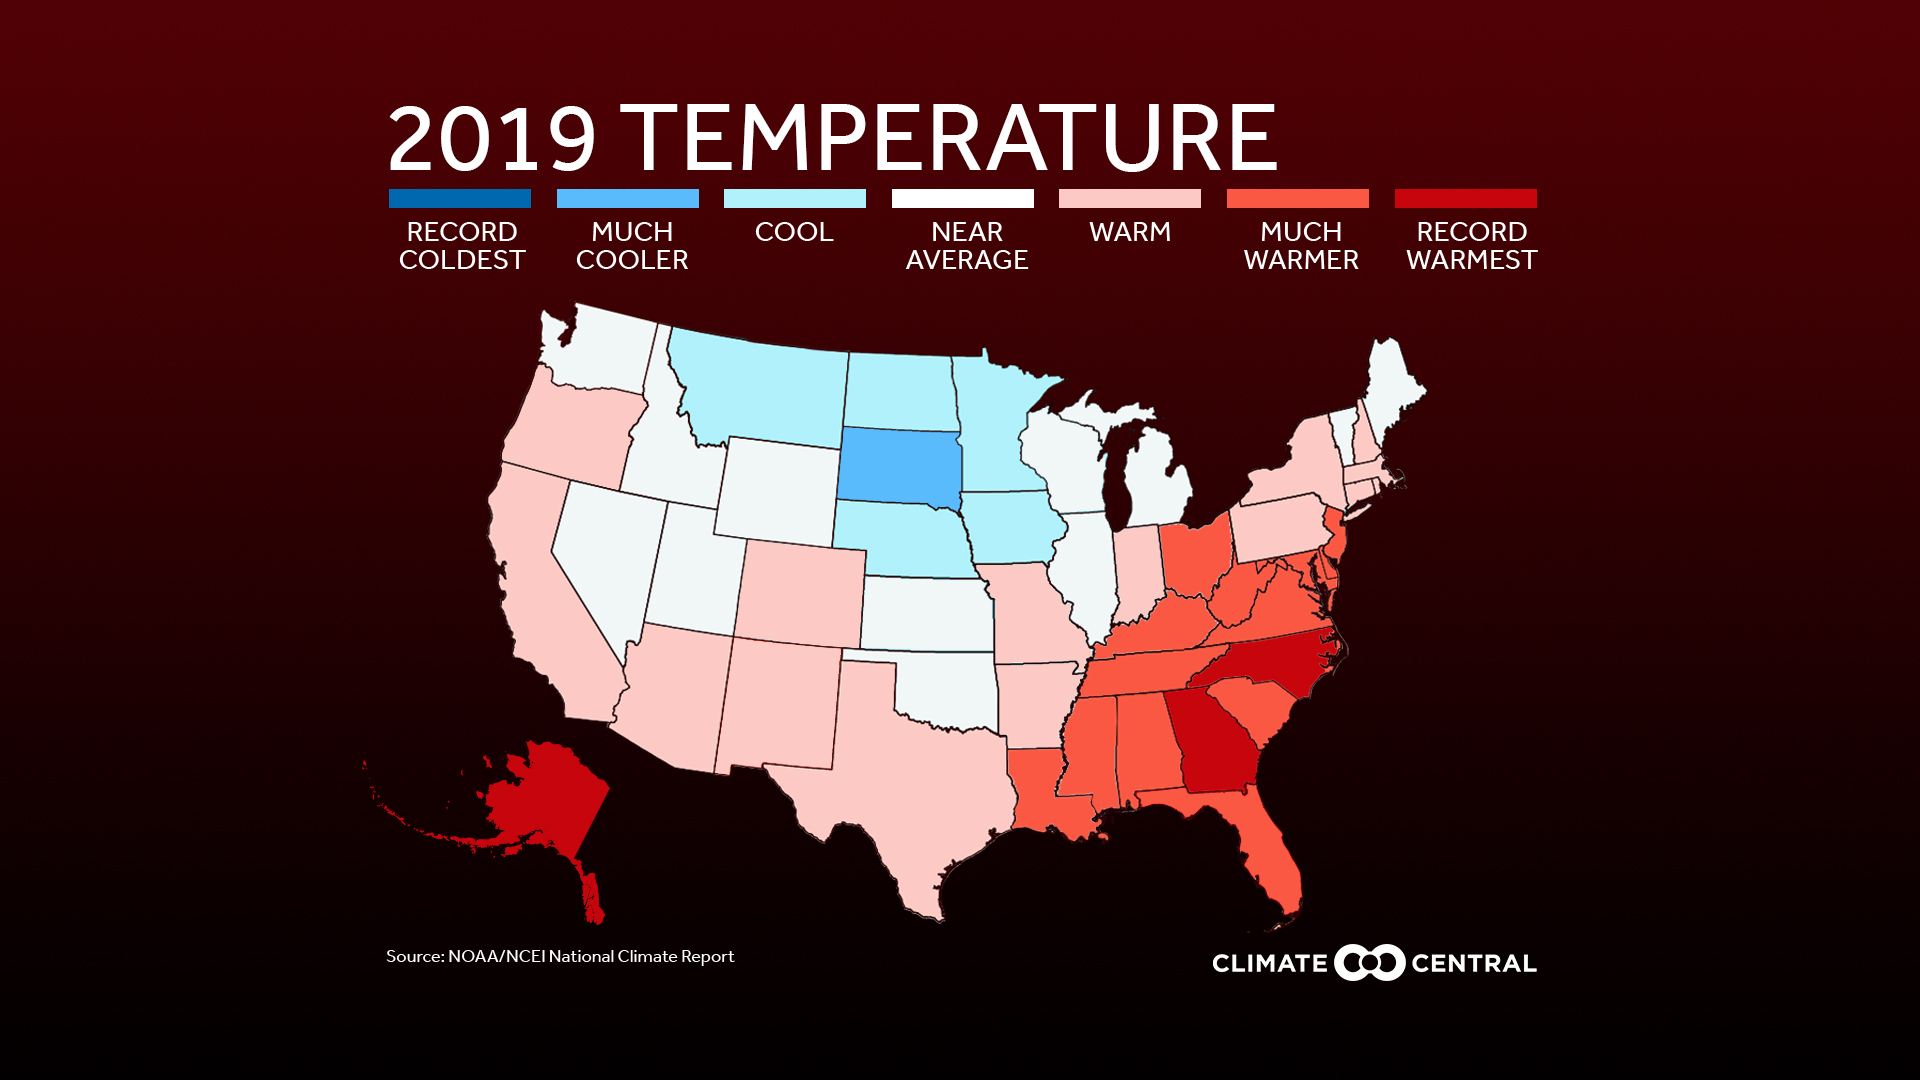
| With title: JPG PNG | No Title: JPG PNG |
Of course, rising temperatures aren’t just statistics—they can intensify extreme weather events that affect lives and damage economies. NOAA reports that 14 such events cost the U.S. more than $1 billion in 2019. None were cold-weather related; all came from flooding, fires, or storms. It was the fifth straight year with at least 10 billion-dollar weather and climate disasters; only four of the previous 35 years had recorded that many. As climate change strengthens hurricanes, lengthens wildfire seasons, and intensifies heavy rain, these costs may continue to rise—unless we rapidly reduce the emissions that warm our planet.
METHODOLOGY: Average decadal temperatures (1970s – 2010s) for 244 cities were calculated using data from the Applied Climate Information System. Decades with five or more years of insufficient daily data (>10% missing) were excluded from this analysis. State data in the National maps are from NOAA/NCEI’s National Temperature and Precipitation Maps.
Here are more notes on the current climate change influenced storm (Isiah) affecting the United States this weekend:
Here is more climate and weather news from Saturday:
(As usual, this will be a fluid post in which more information gets added during the day as it crosses my radar, crediting all who have put it on-line. Items will be archived on this site for posterity. In most instances click on the pictures of each tweet to see each article.)
Here are some “ET’s” from Saturday:
(If you like these posts and my work please contribute via the PayPal widget, which has recently been added to this site. Thanks in advance for any support.)
Guy Walton- “The Climate Guy”