Saturday February 15th… Dear Diary. The main purpose of this ongoing post will be to track United States extreme or record temperatures related to climate change. Any reports I see of ETs will be listed below the main topic of the day. I’ll refer to extreme or record temperatures as ETs (not extraterrestrials)😉
Main Topic: Some Truth Behind The “Business As Usual” Scenario
Dear Diary: We are in the era of relativism in which nearly every person knows the “truth” about every imaginable subject, mainly because of the internet and social media. Real truth is hard to come by, but two plus two still equals four. People find it very hard to trust figures in authority and so called “experts,” which now include scientists with PHD’s. As far as the climate issue goes, we see a wide spectrum of views. At one end we have climate change skeptics who think that carbon pollution is not affecting our environment at all and that nothing is wrong. On the other end we see people who think that “business as usual” will either within a few decades or later lead to our extinction. So which group is correct?
Obviously, those who think that adding CO2 to the atmosphere through the burning of fossil fuels won’t affect our environment are squirming with each added warm report. They are not correct. But what about those who think that we are doomed? Here we need to trust those with higher educational levels than we have attained earlier in our lives. I am dumbfounded over the last decade to see people and groups trying to come up with their own flimsy “truths” based on nothing more than prejudice and opinions. This is not real science.
The best course I would advise my readers travel is to heed what is written by those with PHD’s. As such, we see that science is pointing us to a middle ground with “business as usual” emissions scenarios. Here is more from renowned climate scientist Zeke Hausfathe via the following nature article (Note the many references at the end of the article, which is another sign of sound science.):
https://www.nature.com/articles/d41586-020-00177-3
29 January 2020
Emissions – the ‘business as usual’ story is misleading
Stop using the worst-case scenario for climate warming as the most likely outcome — more-realistic baselines make for better policy.
Zeke Hausfather &
Glen P. Peters
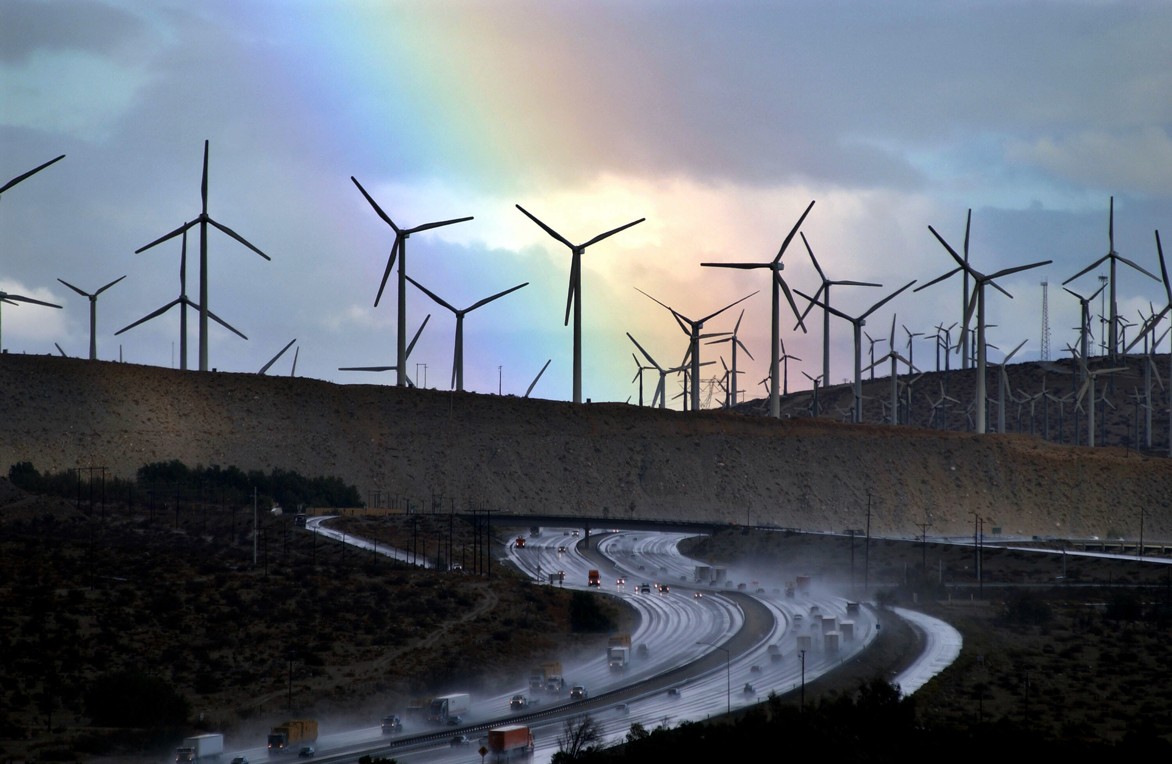
Falling costs for generating clean electricity have led to a proliferation of wind farms, such as this one near Palm Springs, California. Credit: David McNew/Getty
More than a decade ago, climate scientists and energy modellers made a choice about how to describe the effects of emissions on Earth’s future climate. That choice has had unintended consequences which today are hotly debated. With the Sixth Assessment Report (AR6) from the Intergovernmental Panel on Climate Change (IPCC) moving into its final stages in 2020, there is now a rare opportunity to reboot.
In the lead-up to the 2014 IPCC Fifth Assessment Report (AR5), researchers developed four scenarios for what might happen to greenhouse-gas emissions and climate warming by 2100. They gave these scenarios a catchy title: Representative Concentration Pathways (RCPs)1. One describes a world in which global warming is kept well below 2 °C relative to pre-industrial temperatures (as nations later pledged to do under the Paris climate agreement in 2015); it is called RCP2.6. Another paints a dystopian future that is fossil-fuel intensive and excludes any climate mitigation policies, leading to nearly 5 °C of warming by the end of the century2,3. That one is named RCP8.5.
RCP8.5 was intended to explore an unlikely high-risk future2. But it has been widely used by some experts, policymakers and the media as something else entirely: as a likely ‘business as usual’ outcome. A sizeable portion of the literature on climate impacts refers to RCP8.5 as business as usual, implying that it is probable in the absence of stringent climate mitigation. The media then often amplifies this message, sometimes without communicating the nuances. This results in further confusion regarding probable emissions outcomes, because many climate researchers are not familiar with the details of these scenarios in the energy-modelling literature.
This is particularly problematic when the worst-case scenario is contrasted with the most optimistic one, especially in high-profile scholarly work. This includes studies by the IPCC, such as AR5 and last year’s special report on the impact of climate change on the ocean and cryosphere4. The focus becomes the extremes, rather than the multitude of more likely pathways in between.
Happily — and that’s a word we climatologists rarely get to use — the world imagined in RCP8.5 is one that, in our view, becomes increasingly implausible with every passing year5. Emission pathways to get to RCP8.5 generally require an unprecedented fivefold increase in coal use by the end of the century, an amount larger than some estimates of recoverable coal reserves6. It is thought that global coal use peaked in 2013, and although increases are still possible, many energy forecasts expect it to flatline over the next few decades7. Furthermore, the falling cost of clean energy sources is a trend that is unlikely to reverse, even in the absence of new climate policies7.
Assessment of current policies suggests that the world is on course for around 3 °C of warming above pre-industrial levels by the end of the century — still a catastrophic outcome, but a long way from 5 °C7,8. We cannot settle for 3 °C; nor should we dismiss progress.
Plan for progress
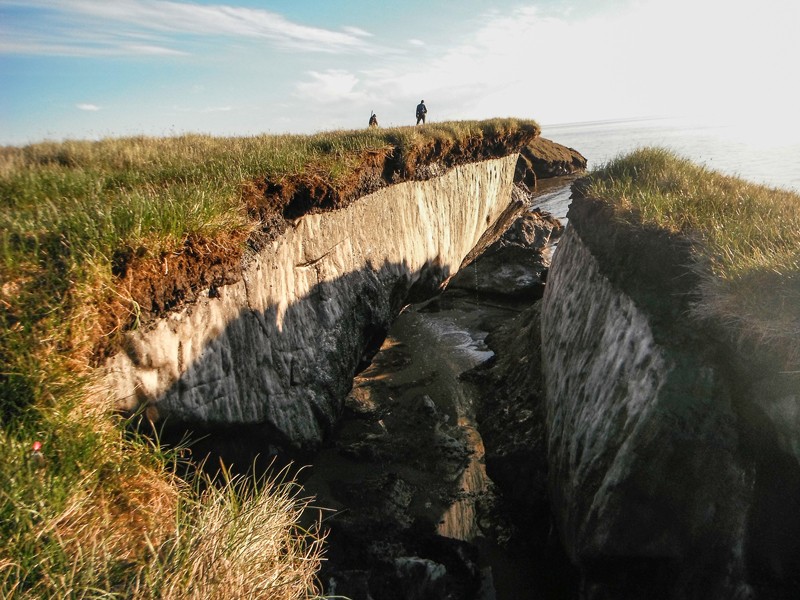
Some researchers argue that RCP8.5 could be more likely than was originally proposed. This is because some important feedback effects — such as the release of greenhouse gases from thawing permafrost9,10 — might be much larger than has been estimated by current climate models. These researchers point out that current emissions are in line with such a worst-case scenario11. Yet, in our view, reports of emissions over the past decade suggest that they are actually closer to those in the median scenarios7. We contend that these critics are looking at the extremes and assuming that all the dice are loaded with the worst outcomes.
Asking ‘what’s the worst that could happen?’ is a helpful exercise. It flags potential risks that emerge only at the extremes. RCP8.5 was a useful way to benchmark climate models over an extended period of time, by keeping future scenarios consistent. Perhaps it is for these reasons that the climate-modelling community suggested RCP8.5 “should be considered the highest priority”12.
We must all — from physical scientists and climate-impact modellers to communicators and policymakers — stop presenting the worst-case scenario as the most likely one. Overstating the likelihood of extreme climate impacts can make mitigation seem harder than it actually is. This could lead to defeatism, because the problem is perceived as being out of control and unsolvable. Pressingly, it might result in poor planning, whereas a more realistic range of baseline scenarios will strengthen the assessment of climate risk.
This admission does not make climate action less urgent. The need to limit warming to 1.5 °C, as made clear in the IPCC’s 2018 special report13, does not depend on having a 5 °C counterpoint.
Assess realistically
The plethora of future emissions scenarios poses a challenge to users of climate data — from policymakers to investors14. More than 1,200 mitigation scenarios were assessed in AR5 in 2014. Another 400 scenarios were used in the IPCC’s 2018 special report on 1.5 °C of warming13. Most of these assume a baseline with no climate policy across a range of socio-economic developments. In our experience of working with scenario users, this proliferation leads to more confusion than clarity, particularly in the absence of any guidance on the relative likelihood of each scenario.
Other organizations present relatively few scenarios — the International Energy Agency (IEA), for example, now has just three main ones. Its Current Policies Scenario indicates what could happen to emissions with things as they stand. The Stated Policies Scenario includes current policy intentions and targets. The IEA’s Sustainable Development Scenario reflects emissions in a world that is already aligned with the goals set in Paris7. The United Nations Environment Programme’s Emissions Gap Report takes a similar approach, comparing countries’ emissions-reduction pledges with global pathways that limit warming to well below 2 °C15. These influential agencies do not focus on worst-case outcomes. They plot the gulf between where the world is heading and where it has agreed it should go.
For those making real-life decisions, the choice of scenario becomes important14,16. Emphasizing ways of adapting to an extreme RCP8.5 scenario with around 5 °C warming in 2100 is out of step with the requirement to build resilience and reduce vulnerabilities in the near-term. Most users of climate scenarios care more about the world as it is now, rather than what might have been had global emissions not slowed over the past decade7. Users focused on mitigation are keen to capitalize on emerging opportunities such as cheap renewables, or to avoid overinvesting in stranded assets in dying industries. For example, they want to know whether the rapid cost declines in renewables might make investments in fossil fuels high risk. A RCP8.5 baseline renders these applications useless, because it implies that recent climate policies and technological progress are halted or even reversed.
For policymakers, mitigation policies that depend on the assumptions underlying high-emission baseline scenarios such as RCP8.5 will seem exorbitant, because they do not incorporate the plummeting costs of many low-carbon technologies over the past decade. The marginal investments required to move from 3 °C of warming to well below 2 °C (the main Paris goal) will be much less than moving from 5 °C to well below 2 °C. A narrative of progress and opportunity can make the Paris targets seem feasible, rather than seemingly impossible.
Towards risk-based scenarios
Those who are tasked with taking climate action on the basis of information from model scenarios are increasingly calling for a more risk-based approach to help with adaptation and mitigation14. This approach accounts for the relative likelihood of different outcomes. Controversially, it requires researchers to assign probabilities to scenarios16. Critics don’t want to do this, because many see it as an arbitrary process. But when specialists refuse to assign probabilities, users often do so themselves. Most do so poorly because they do not have a deep understanding of the assumptions that underpin these scenarios.
Initially, the probabilities do not need to be elaborate, and could even just identify the most likely scenario resulting from current energy-system trends and policies. Now, scenarios are selected on the basis of their climate outcomes in 2100, not their likelihoods. More complex probabilistic approaches would require modellers to work differently17. For example, they would need to forge new alliances with those in the social sciences18 and involve policymakers, investors and industry14.
This will require years of work. Meanwhile, three steps should be taken over the next year in the lead-up to AR6, to set the climate community on the right road. The latest generation of climate models has just come out, and many researchers are now selecting which future emissions scenarios to use in studies.
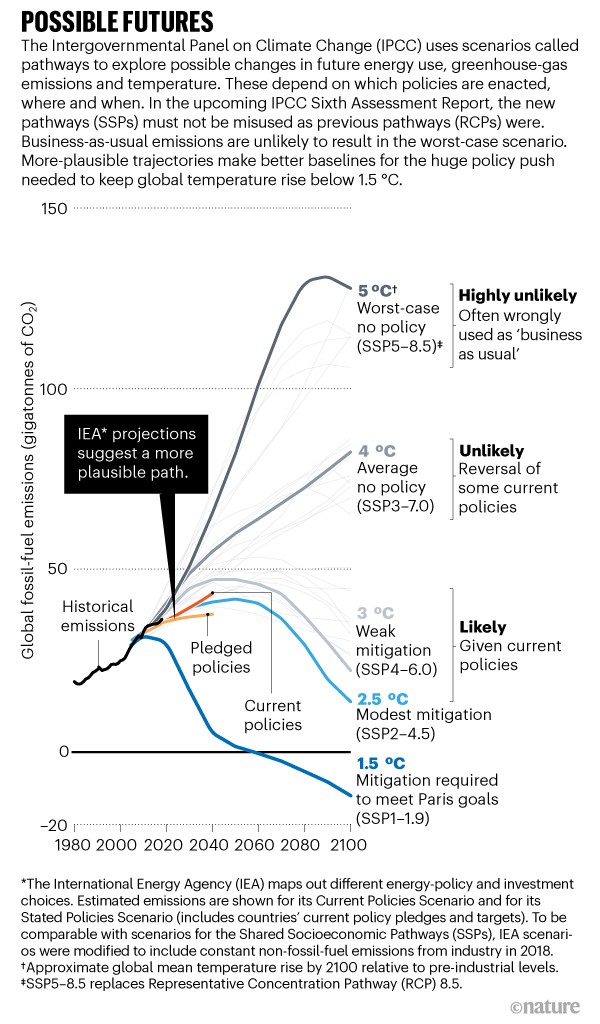
First, the new generation of scenarios called the Shared Socioeconomic Pathways (SSPs; see ‘Parting of the pathways’) has a much more nuanced approach to baselines, and IPCC authors can highlight a range of outcomes in a world with no new policies19 (see also Nature Clim. Change 9, 727; 2019). The space between high-end and low-end scenarios should be more deeply explored in AR6, so that the climate impacts we are likely to experience can be communicated more clearly20. For example, according to many studies, we are heading for a 3 °C world. Therefore, it would be prudent to clearly outline the climate impacts for 3 °C in addition to those for 5 °C.
Parting of the pathways
The 2021–22 Sixth Assessment Report from the Intergovernmental Panel on Climate Change (IPCC) will compare different types of trajectory from those weighed in its 2014 report.
The Representative Concentration Pathways (RCPs) are a set of four possible climate scenarios for the end of the century1. The RCPs were used extensively in the 2014 IPCC Fifth Assessment Report, but lack any consistent set of socio-economic assumptions driving future emissions and are simply intended to reflect different potential climate outcomes3. They include RCP2.6, RCP4.5, RCP6.0 and RCP8.5, with the number reflecting the additional radiative forcing in 2100, relative to pre-industrial times. Radiative forcing (in watts per square metre) measures the combined effect of greenhouse-gas emissions and other factors (such as atmospheric aerosol levels) on climate warming. Current radiative forcing relative to pre-industrial levels is around 2.5 watts per square metre.
The Shared Socioeconomic Pathways (SSPs) are five socio-economic and technological trajectories that the world could follow this century19. Each has a baseline in which no climate policies are enacted after 2010 — resulting in between 3 °C and 5 °C of warming above pre-industrial levels by 2100. In addition, the SSPs can be linked to climate policies to generate different outcomes for the end of the century (analogous to RCPs), with radiative forcing of 1.9, 2.6, 3.4, 4.5, 6.0, 7.0 or 8.5 watts per square metre in 2100. A subset of SSP models has been selected for the 2021–22 IPCC report12, and will function in a similar way to the RCPs in its 2014 report.
Second, scientists should recognize that different users need different tools. In the context of AR6, this could mean that the various working groups (focusing on climate science, impacts and mitigation) highlight different scenarios in their analyses and communications. The final AR6 synthesis could then integrate the different risk perspectives.
Finally, we suggest that climate-impact studies using models developed for AR6 should include scenarios that reflect more-plausible outcomes, such as SSP2-4.5, SSP4-6.0 and SSP3-7.0 (see ’Possible futures’). When RCP8.5 or its successor SSP5-8.5 are deployed, they should be clearly labelled as unlikely worst cases rather than as business as usual.
References
- 1.Moss, R. H. et al. Nature 463, 747–756 (2010).
- 2.Riahi, K. et al. Climat. Change 109, 33 (2011).
- 3.van Vuuren, D. P. et al. Climat. Change 109, 5 (2011).
- 4.Pörtner, H.-O. et al. (eds) IPCC Special Report on the Ocean and Cryosphere in a Changing Climate (IPCC, 2019).
- 5.Ho, E., Budescu, D. V, Bosetti, V., van Vuuren, D. P. & Keller, K. Climat. Change 155, 545–561 (2019).
- 6.Ritchie, J. & Dowlatabadi, H. Energy Econ. 65, 16–31 (2017).
- 7.International Energy Agency. World Energy Outlook 2019 (IEA, 2019).
- 8.Rogelj, J. et al. Nature 534, 631–639 (2016).
- 9.Friedlingstein, P. et al. J. Clim. 27, 511–526 (2014).
- 10.Lenton, T. M. et al. Nature 575, 592–595 (2019).
- 11.Peters, G. P. et al. Nature Clim. Change 3, 4–6 (2013).
- 12.O’Neill, B. C. et al. Geosci. Model Dev. 9, 3461–3482 (2016).
- 13.Intergovernmental Panel on Climate Change. Global Warming of 1.5 °C (IPCC, 2018).
- 14.Weber, C. et al. Nature Clim. Change 8, 845–848 (2018).
- 15.United Nations Environment Programme. Emissions Gap Report 2018 (UN, 2019).
- 16.King, D., Schrag, D., Dadi, Z., Ye, Q. & Ghosh, A. Climate Change: A Risk Assessment (Univ. Cambridge, 2015).
- 17.Morgan, M. G. & Keith, D. W. Climat. Change 90, 189–215 (2008).
- 18.Tàbara, J. D., St. Clair, A. L. & Hermansen, E. A. T. Environ. Sci. Pol. 70, 31–37 (2017).
- 19.Riahi, K. et al. Glob. Environ. Change 42, 153–168 (2017).
- 20.van Ruijven, B. J. Clim. Change 138, 361–367 (2016).
Download referencesshow more
Noting that the “business as usual” scenario is not likely to end our world does not mean we should breathe a big sigh of relief and not press for needed change. Au contraire. The lower we keep global averages the better off our progeny will be. Also, by keeping low averages the better chances most of our coastal cities will have to remain in tact.
Again, heed expert advise. I’m be posting more PHD notes over the course of 2020.
Please consider donating through the Paypal widget on this site. I need everyone’s support to continue my work, especially that of processing NCEI record count data for scientific research.
Here is some more weather and climate news from Saturday:
(As usual, this will be a fluid post in which more information gets added during the day as it crosses my radar, crediting all who have put it on-line. Items will be archived on this site for posterity.)
Here are more “ET’s” from the last few days:
(If you like these posts and my work please contribute via the PayPal widget, which has recently been added to this site. Thanks in advance for any support.)
Guy Walton- “The Climate Guy”