The main purpose of this ongoing blog will be to track United States extreme or record temperatures related to climate change. Any reports I see of ETs will be listed below the main topic of the day. I’ll refer to extreme or record temperatures as ETs (not extraterrestrials).😉
Main Topic: Early October Record Scoreboard Update And Climatological Review
Dear Diary. Thank goodness some unforeseen shear came along and weakened Delta before the system made landfall near Cancun overnight as a CAT2 hurricane, and not the dreaded CAT5 beast I was anticipating 24 hours ago. Let’s hope that we see more “unforeseen” weakening effects as Delta works its way towards Louisiana on Friday. If you wish to skip my climatological review portion of this blog, I will be adding plenty of notes on Delta on this particular post throughout the day.
Repeating from September: As COVID-19 ravages the United States and the globe, climate change continues to be a simmering issue, which most news sources have put on the back burner of coverage because of the pandemic. On this site, though, the climate crisis will always make headlines, because it will be with us long after this pandemic abates.
Here on this site we present monthly summaries near the 7th of each month, and each is available if you want to go back through my Extreme Temperature Diary archive. This particular month I’ve added a new category on my site for these posts.
I’m repeating my mantra from last month:
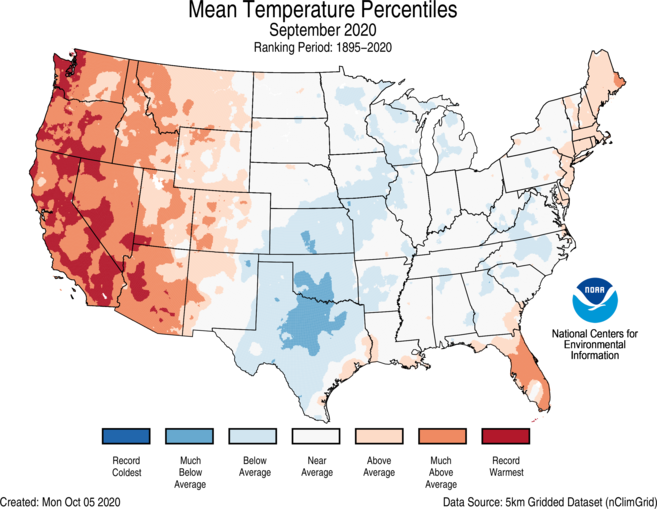
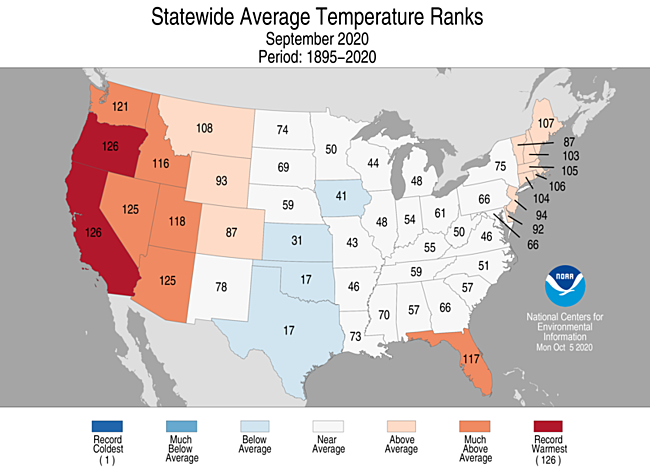
September 2020 got ranked by the National Center for Environmental Information as an above average September, temperature wise, for the lower 48 states, coming in as 90th coolest or 37th warmest since records began being kept in 1895:
https://www.ncdc.noaa.gov/cag/national/rankings

It’s no surprise that California and Oregon had the hottest Septembers on record given two historic heat waves and associated unprecedented fires. The nation’s mid section did have cooler than average temperatures.
Here are my two U.S. Daily Record Scoreboards updated through 9/7/2020 (data compiled from the following NCEI site):
https://www.ncdc.noaa.gov/cdo-web/datatools/records


DHMX= Daily High Max Reports. DLMN= Daily Low Min Reports. DHMN= Daily High Min Reports. DLMX=Daily Low Max Reports.
For these data sets all monthly ratios of > 10 to 1 DHMX to DLMN or > 10 to 1 DLMN to DHMX are in bold type. The rankings are for the lower 48 states with the warmest ranking since 1895 of average temperatures being 125 and 1 being the coldest as of 2020. Blue colors represent cold months and red warm. Those months and years with counts close to a 1 to 1 ratio of highs to lows are colored black. Boldly colored months, such as January 2020, have ratios of more than 10 to 1 daily record highs to lows or lows to highs, and are either historically hot or cold, most of which have made news.
September 2020 had approximately a 3-2 ratio of record DHMX to DLMN individual record counts, so the color I used for this month was red on the top chart.
September 2020 had approximately a 34-29 ratio of record DHMN to DLMX individual record counts, so the color I used for this month was red on the bottom chart.
Due to climate change we are seeing less blue colors on these Record Scoreboards with time.
As stated, the ranking for September 2020 was 90, which was colored red. I color rankings +10 or -10 from the average ranking of 63 black, indicating that these are near average temperature wise.
We are seeing strong indications that in October 2020 we will see well above average temperatures for most U.S. states looking at meteorological guidance. Also, looking at the record scoreboards, October 2020 has started out fairly toasty.
Here is much more detailed U.S. climatology as complied by NOAA:
https://www.ncei.noaa.gov/news/national-climate-202009
Assessing the U.S. Climate in September 2020
Billion-dollar weather and climate disasters in 2020 tie annual record

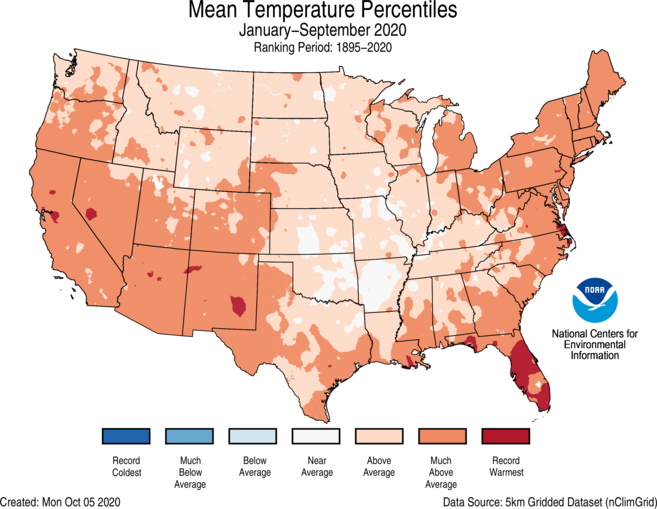
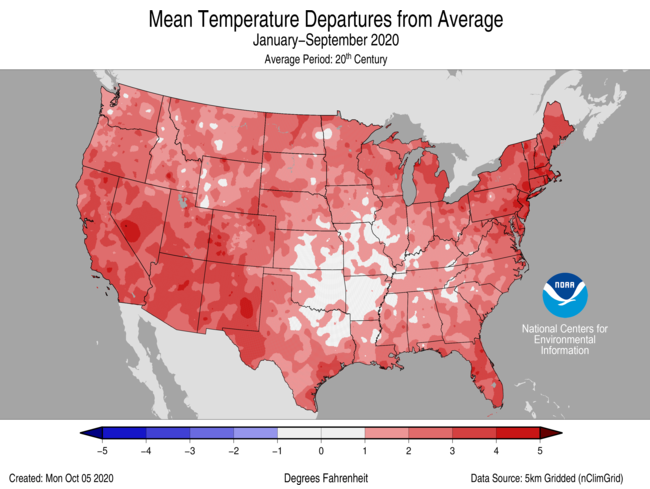
For September, the average contiguous U.S. temperature was 66.0°F, 1.1°F above the 20th-century average, ranking in the warmest one-third of the 126-year period of record. For the year-to-date, the contiguous U.S. temperature was 57.3°F, 2.3°F above the 20th-century average, ranking sixth warmest in the January-September record.
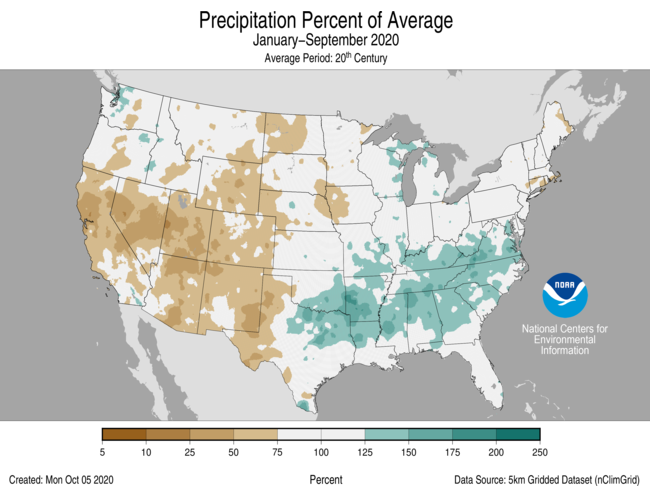
The September precipitation total for the contiguous U.S. was 2.38 inches, 0.11 inch below average, ranking in the middle one-third of the 126-year period of record. For the year-to-date, the national precipitation total was 24.08 inches, 0.88 inch above average, also ranking in the middle one-third of the January-September record.
NCEI updated the 2020 billion-dollar weather and climate disaster list to include six additional events — Western Wildfires, Western/Central Drought and Heatwave, Hurricane Sally, Hurricane Laura, Central Severe Weather Derecho and Hurricane Isaias. This brings the year-to-date total to 16 weather and climate disaster events with losses exceeding $1 billion each across the U.S. and ties with 2011 and 2017 for the largest number of disasters in a calendar year. This is also the sixth consecutive year (2015-2020) in which 10 or more billion-dollar disasters have impacted the U.S. — the only such occurrence on record.

This monthly summary from NOAA National Centers for Environmental Information is part of the suite of climate services NOAA provides to government, business, academia, and the public to support informed decision-making.
- The cooler temperatures observed across the Plains and Upper Mississippi Valley mid-month were associated with a strong trough of low pressure.
- Above- to much-above-average September temperatures were observed across much of the West, parts of the Northeast and Gulf Coast. California and Oregon ranked warmest on record for the month with Nevada and Arizona ranking second warmest.
- Phoenix, Arizona, broke the record for the number of days with temperatures at or above 110°F in a calendar year during August and added three more days to the record in September. The 2020 record of 53 days shatters the previous record of 33, set in 2011.
- Below-average temperatures were present across portions of the Plains and Deep South and in pockets scattered across the Great Lakes, Southeast and mid-Atlantic.
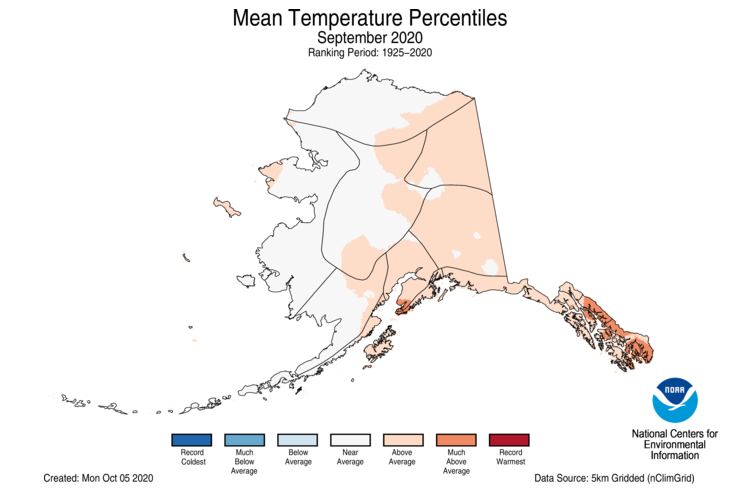
- Alaska had a statewide average temperature of 42.0°F, 1.4°F above the long-term average and ranking in the warmest one-third of the 96-year record. Above-average temperatures were observed across the eastern half of Alaska including most of the Northeast and Southeast Interior regions, Cook Inlet, Northeast Gulf and the Panhandle regions.
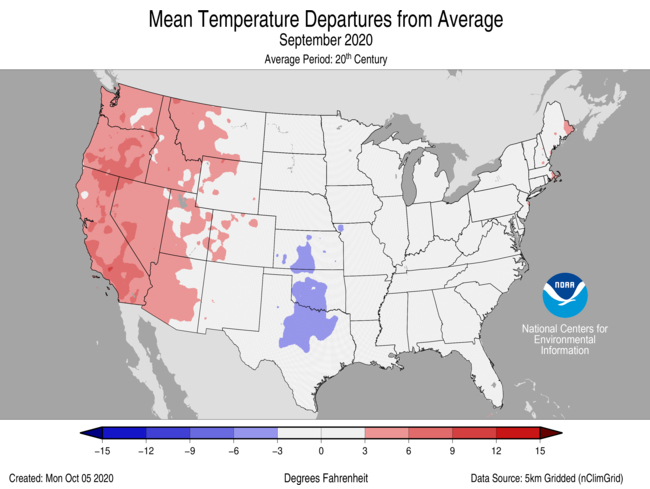
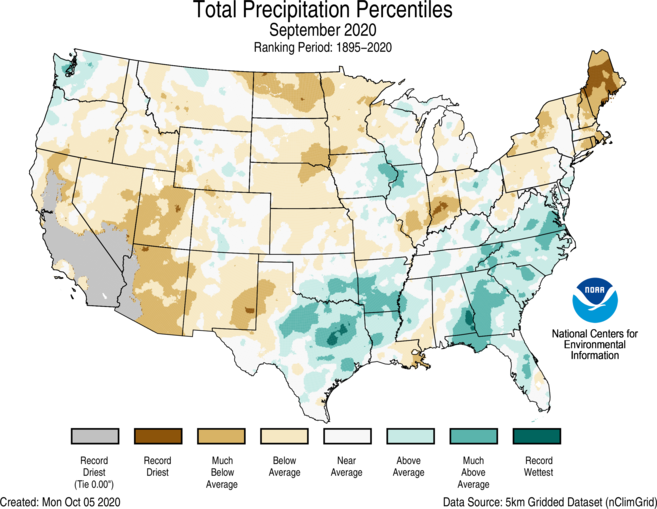
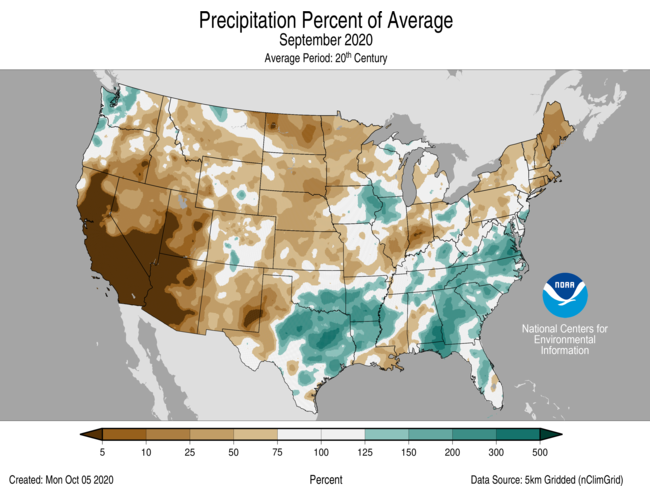
- The West remained hot and dry under a relatively persistent ridge of high pressure throughout much of September, exacerbating wildfire conditions. The above-average rainfall observed across the South and Southeast were in large part due to Tropical Storm Beta and Hurricane Sally.
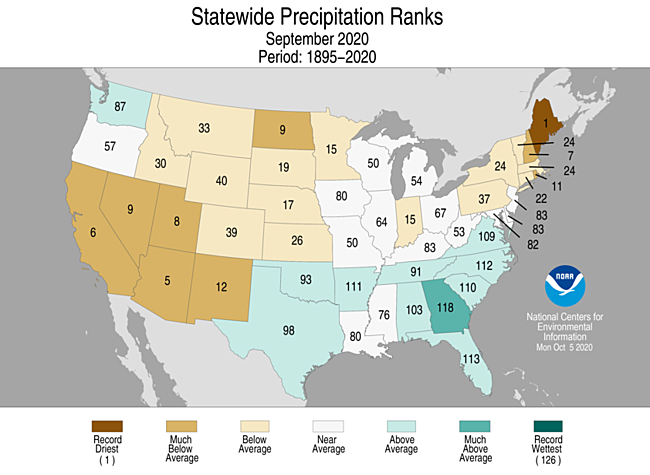
- Above-average precipitation was observed from parts of the Deep South to the mid-Atlantic and in portions of the Northwest and Midwest. Georgia had its ninth-wettest September on record.
- Below-average precipitation was observed from the West Coast to the northern Great Lakes and across the Northeast, and in portions of the central Gulf Coast as well as parts of the western Ohio Valley. Maine had its record-driest September, while Arizona ranked fifth driest and California sixth driest on record. In total, seven states in the Northeast, Southwest and northern Plains had their tenth driest, or drier, September.
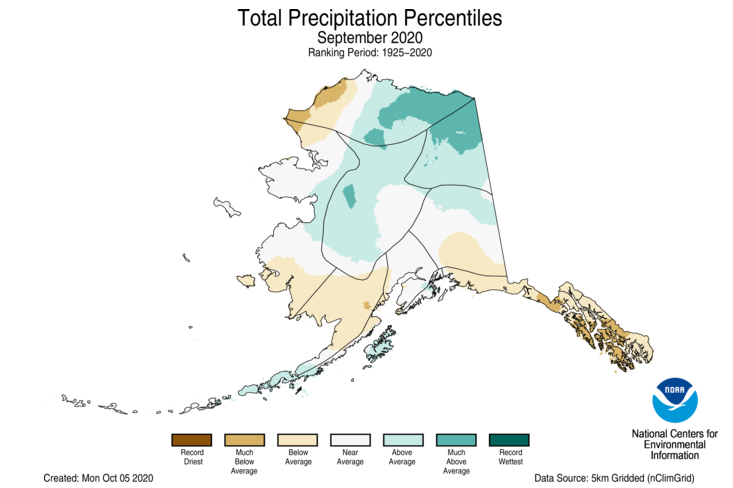
- Alaska’s average of 3.93 inches of precipitation in September was 0.64 inch below average and ranked in the driest one-third of the 96-year record. The Northeast Interior, the eastern half of the North Slope as well as much of the Central Interior received above-average precipitation during September, while below-average precipitation was present across the western North Slope, Bristol Bay, the Northeast Gulf and the Panhandle regions.
- No snow was reported at Fairbanks during September. This is the third consecutive year with no September snowfall — a first in the Weather Bureau/NWS era (since 1930).
- According to the September 29 U.S. Drought Monitor report, 42.6 percent of the contiguous U.S. was in drought, up about 3 percentage points from the beginning of September. This is the largest drought footprint across the CONUS since September 2013. Drought conditions expanded or intensified across much of the Northeast and the western half of the contiguous U.S. Drought coverage lessened or was eliminated across parts of the mid-Mississippi Valley and Deep South. Drought was eliminated across Kodiak Island in Alaska, contracted across Hawaii’s Big Island and intensified on the other Hawaiian islands.
Wildfires
- The western U.S. is in the midst of its most active fire year on record in 2020.
- By the end of September, more than five million acres were consumed across California, Oregon and Washington State. This is more than three times the annual 10-year (2010-2019) average of nearly 1.6 million acres.
- California has already had the highest number of acres burned in a single year across the state with many active fires still ablaze.
- Five of the six largest fires in California history occurred during 2020 — August Complex, SCU Lightning Complex, LNU Lightning Complex, North Complex and the Creek Fire.
- As of October 1, the Cameron Peak Fire in Colorado is the third-largest fire in the state’s history. Three of the four largest fires in Colorado history occurred during 2020.
- Thick smoke and ash from the wildfires reduced air quality in the West and southwest Canada to dangerous levels, forcing people to stay indoors during much of September.
Tropical Cyclones and Hurricanes
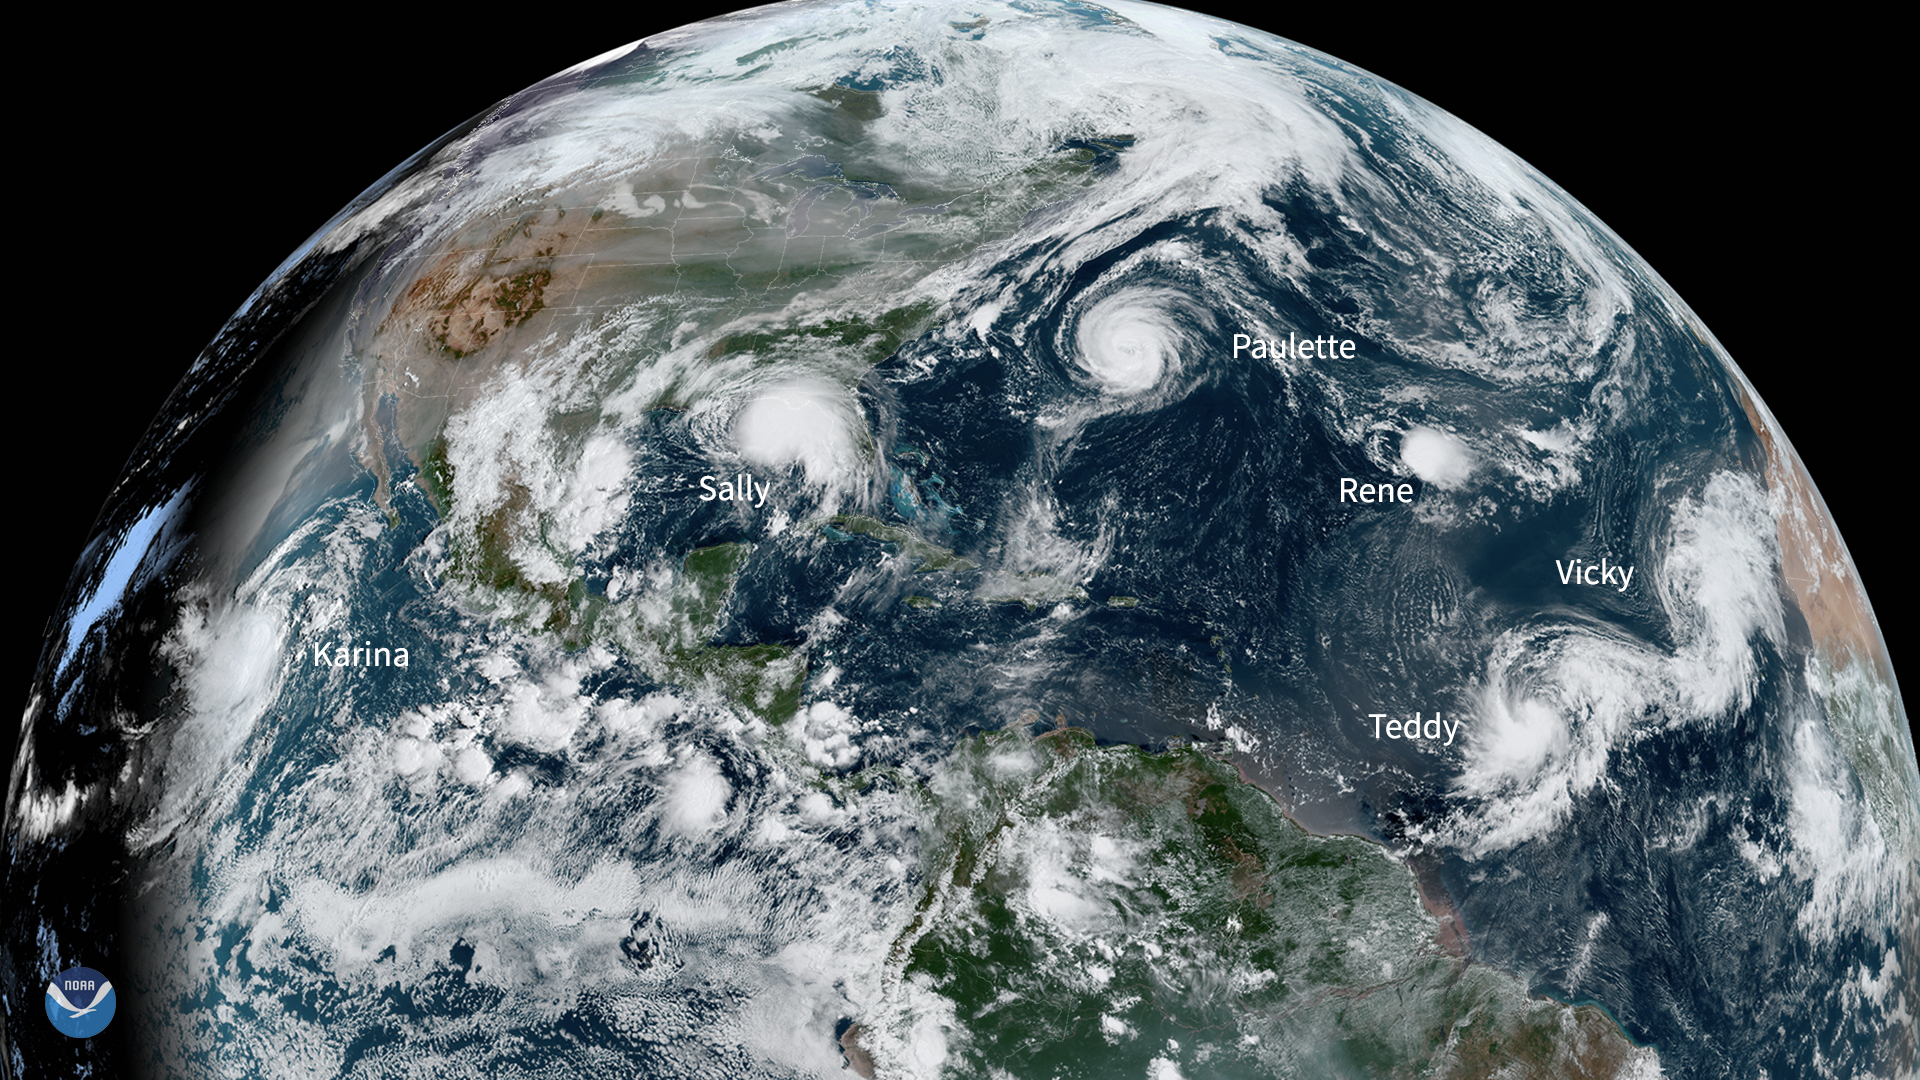
- The Atlantic Basin hurricane season continues at a record pace for named-storm formation during 2020. In September alone, 10 named storms formed — Nana, Omar, Paulette, Rene, Sally, Teddy, Vicky, Wilfred, Alpha and Beta.
- On September 15, Hurricane Sally made landfall near Gulf Shores, Alabama, as a Category 2 storm. Impacts included storm surge flooding, widespread wind damage and up to 30 inches of rainfall.
- Tropical Storm Beta made landfall on the Matagorda Peninsula in Texas on September 22 and brought extensive flooding to the Houston area.
- For the first time since 1971, five named storms churned in the Atlantic Basin at one time. Paulette, Rene, Sally, Teddy and Vicky were each visible in the Atlantic Ocean on September 14.
- Through October 1, nine named storms made landfall along the CONUS coastline, tying a record (1916) for most landfalls in a season.
Year-to-date (January–September) Temperature

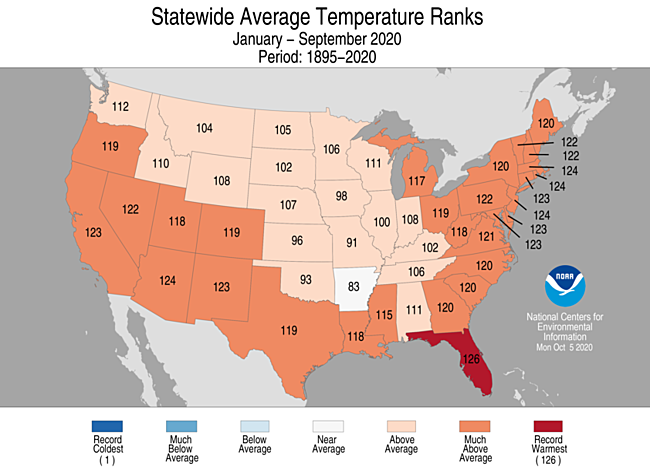
- Above- to much-above-average year-to-date temperatures were observed across most of the contiguous U.S. Florida had its warmest January-September on record while Arizona, New Jersey, Rhode Island and Massachusetts ranked third warmest. Near-average temperatures were observed across portions of the central U.S.
- Denver, Colorado, reported 75 days with high temperatures at or above 90°F in 2020. This eclipses the previous record of 73 days set in 2012.
- Despite the overall warmth across the contiguous U.S. in 2020, the northern Plains experienced an early freeze September 8-9, which caused an abrupt end to the growing season, leading to agricultural losses across the region.
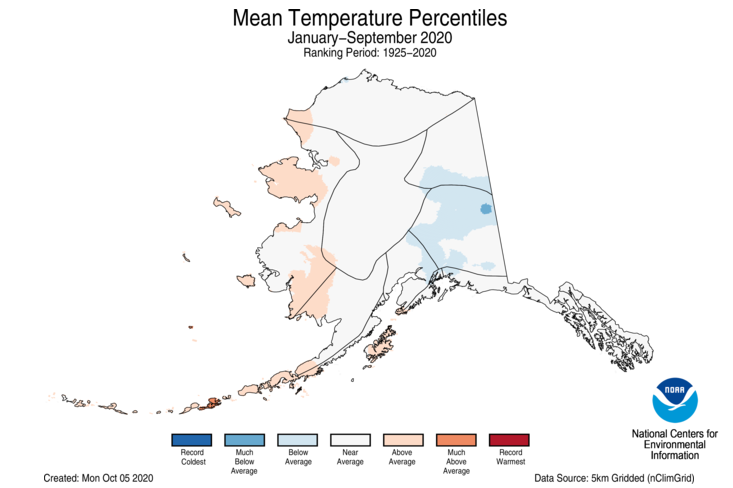
- Year-to-date temperatures averaged across Alaska were near average with above-average temperatures observed along portions of the West Coast and the Aleutians. Below-average temperatures for this year-to-date period were observed across parts of the eastern interior regions.
Year-to-date (January–September) Precipitation

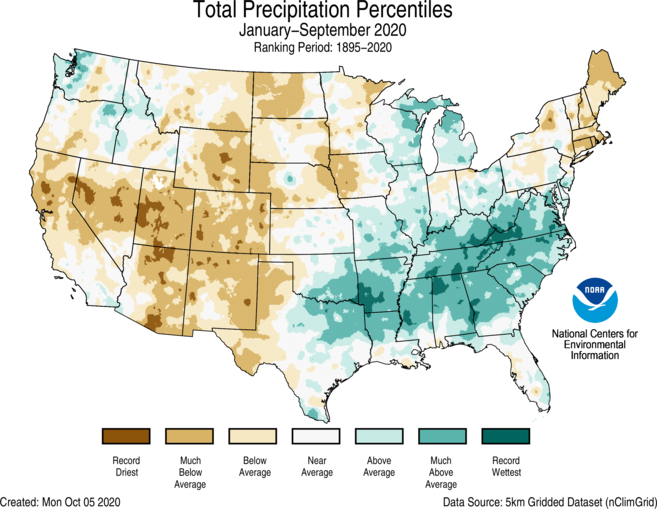
- Above- to much-above-average January-September precipitation stretched from parts of the southern Plains to Gulf Coast and Great Lakes to the mid-Atlantic Coast as well as across portions of the Northwest. Mississippi, Tennessee, North Carolina and Virginia ranked third-wettest year-to-date on record. Below-average precipitation fell from the West Coast to the northern Plains and across the Northeast. Utah had its driest year-to-date on record, while Colorado was second driest.
- For Alaska, January-September precipitation was near average. Below-average precipitation was observed across portions of the northwest coast, the Aleutians and the central Gulf Coast. Above-average precipitation was observed across much of the eastern Interior regions and the Panhandle regions.
Billion-dollar weather and climate disasters
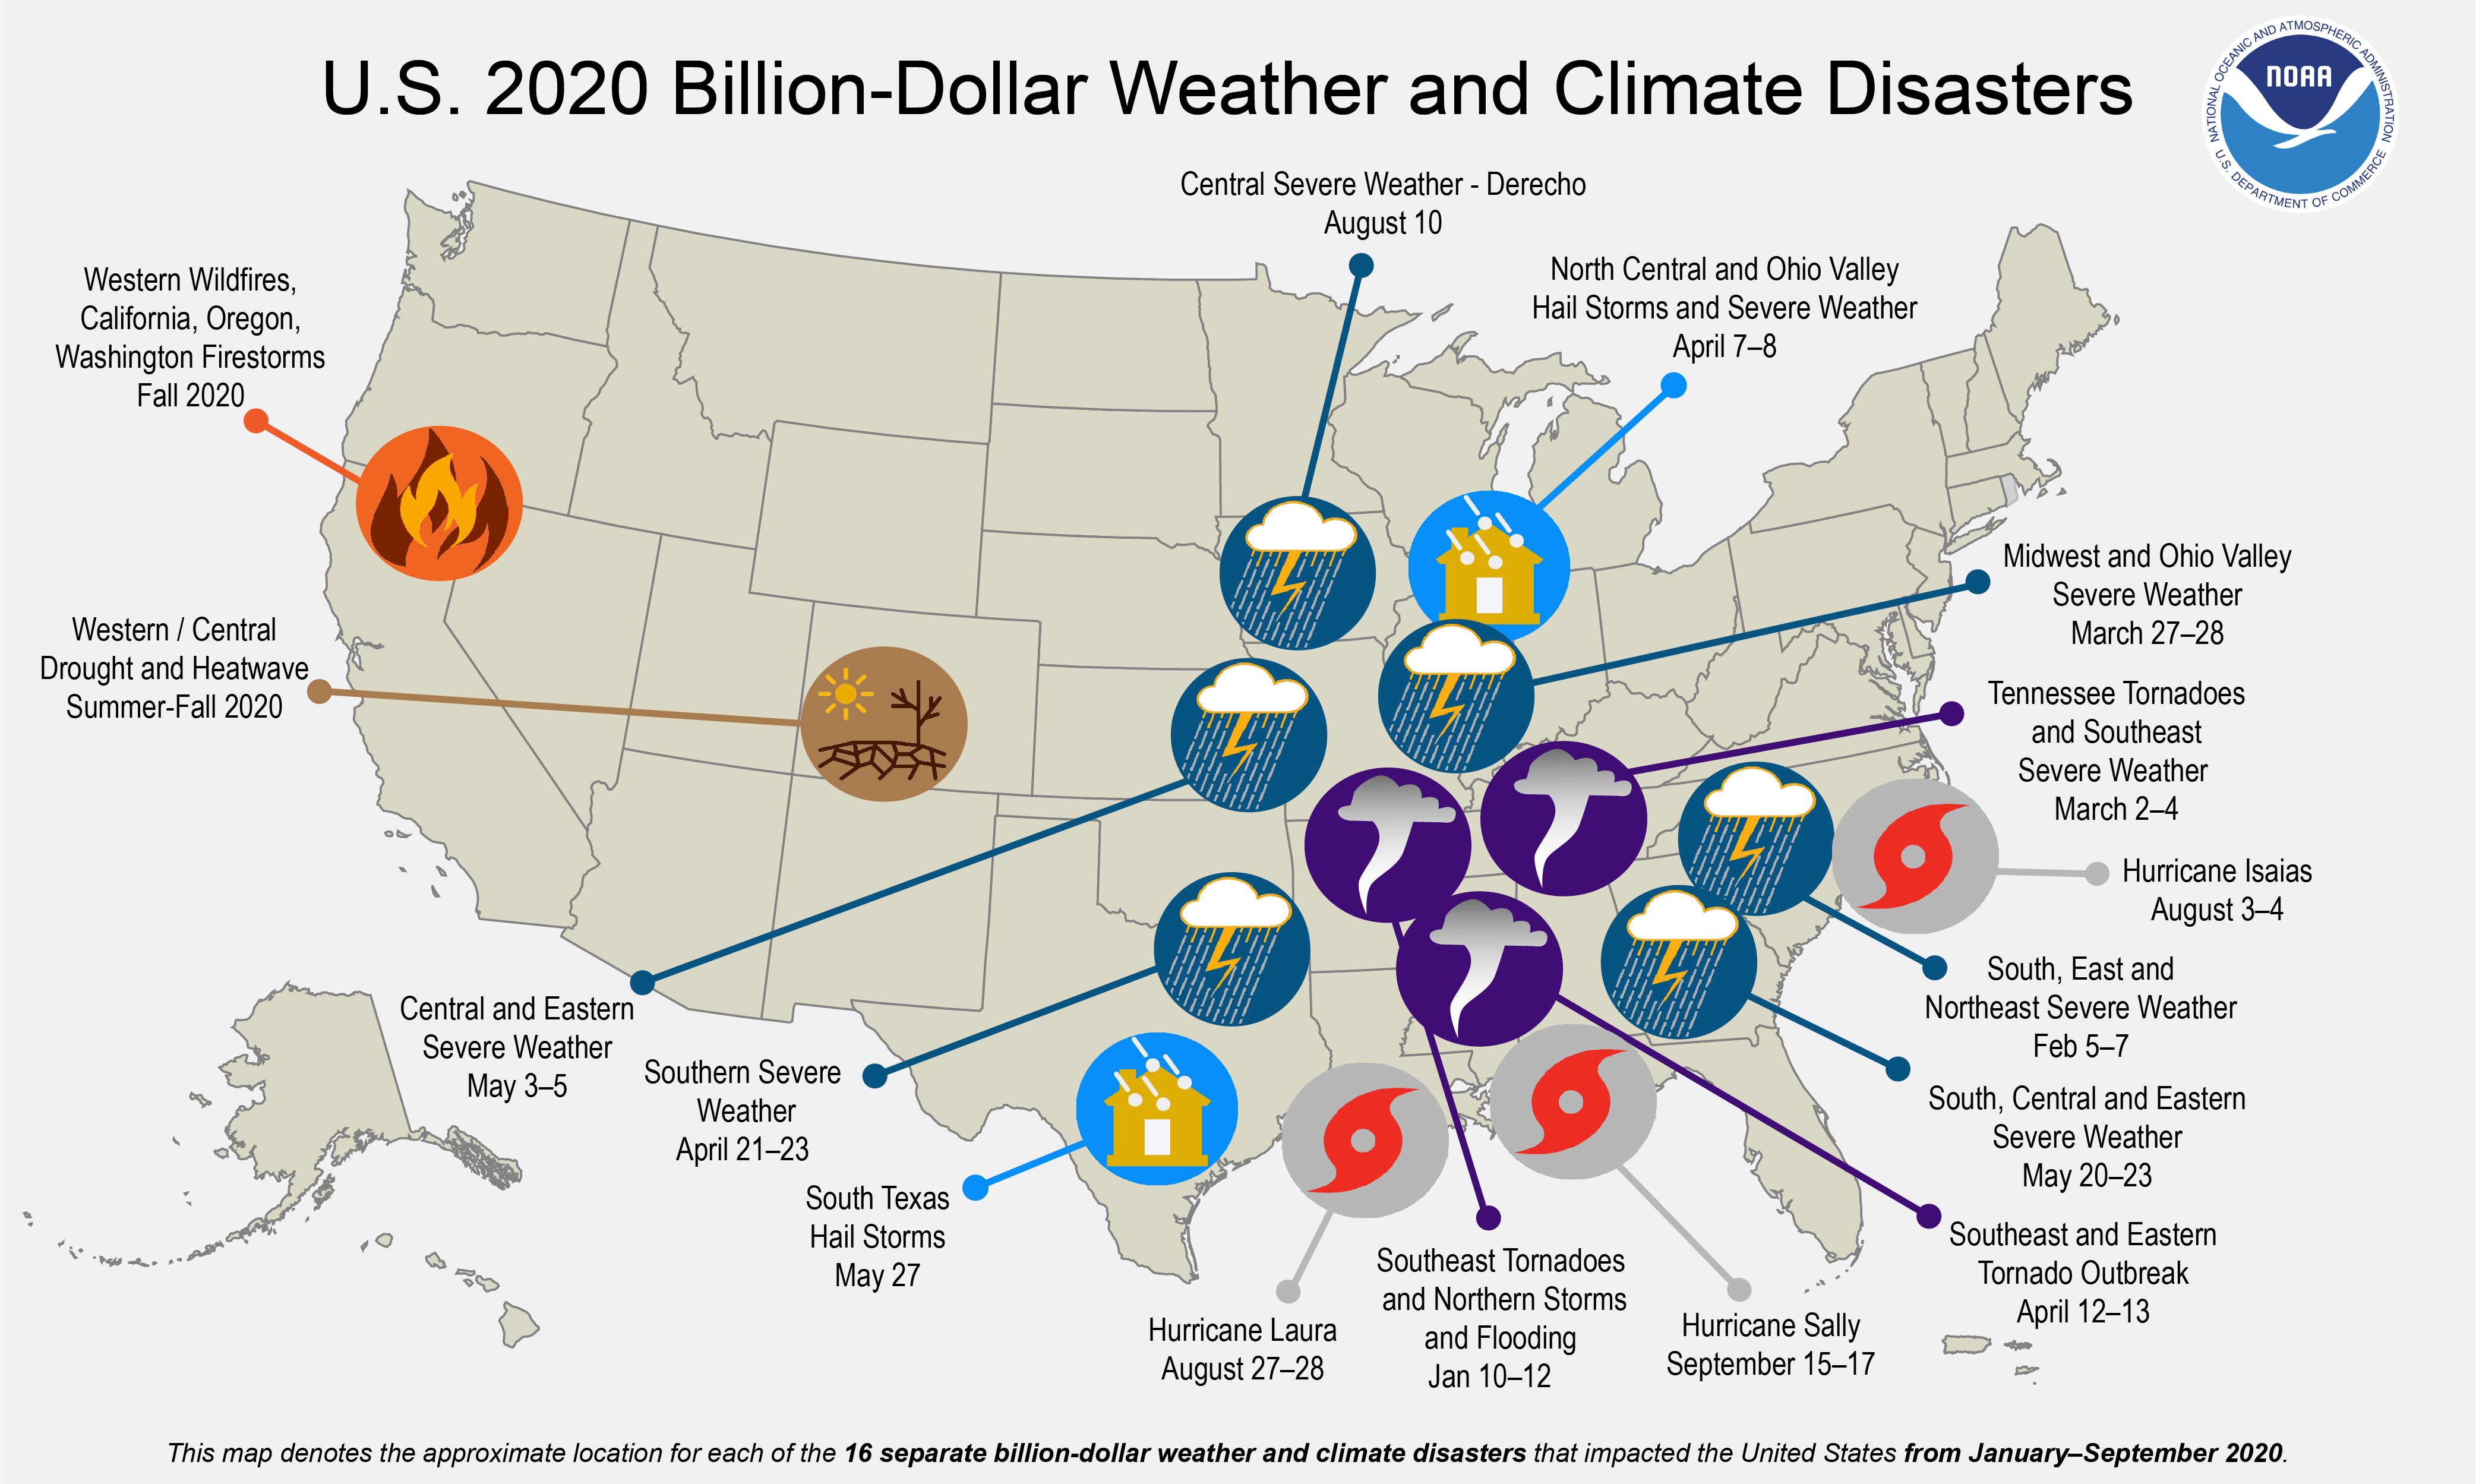
- Through the end of September, 16 weather and climate disaster events have been identified with losses exceeding $1 billion each across the U.S. during 2020. Eleven of the events were due to severe storms which occurred across more than 30 states from the Great Lakes to the Gulf and East coasts. The remaining events were identified as one wildfire, one drought and three tropical cyclone events.
- This is a record sixth consecutive year with at least 10 separate billion-dollar disasters and is tied with 2011 and 2017 for the annual record number of events.
- Since records began in 1980, the U.S. has sustained 279 separate weather and climate disasters where overall damages/costs reached or exceeded $1 billion (based on the CPI adjustment to 2020) per event. The total cost of these 279 events exceeds $1.825 trillion.
- Disaster costs over the last five years (2016-2020) exceed a record $550 billion. These costs do not yet include the 2020 Western Wildfires, Drought/Heatwave or Hurricane Sally.
- The U.S. has been impacted by slow moving tropical cyclones that produced extreme rainfall and damaging floods for four consecutive years (2017-2020). These storms include: Harvey, Florence, Imelda and Sally.
Today I will be listing items in association with Delta below. The most recent items, which I will be updating frequently, will be at the top of this list:
Here are more items from California’s dire fire and Heatwave Desdemona situation below. The most recent items, which I will be updating frequently, will be at the top of this list:
Here are some more major “ET’s:”
Here is more climate and weather news from Wednesday:
(As usual, this will be a fluid post in which more information gets added during the day as it crosses my radar, crediting all who have put it on-line. Items will be archived on this site for posterity. In most instances click on the pictures of each tweet to see each article. The most noteworthy items will be listed first.)
Now here are some of today’s articles and notes on the horrid COVID-19 pandemic:
(If you like these posts and my work please contribute via the PayPal widget, which has recently been added to this site. Thanks in advance for any support.)
Guy Walton “The Climate Guy”