The main purpose of this ongoing blog will be to track United States extreme or record temperatures related to climate change. Any reports I see of ETs will be listed below the main topic of the day. I’ll refer to extreme or record temperatures as ETs (not extraterrestrials).😉
Main Topic: Early December Record Scoreboard Update And Climatological Review
Dear Diary. For a change today there are no major weather issues across the U.S. except for drought across the West. The state of California, that is having fire weather well into December, has been particularly hit hard. Climate change combined with La Niña is continuing to dry the state well outside of climatological norms. I fear for what California will go through in 2021 looking at trends.
Anyway, it’s time once again for our monthly climatological review. Here on this site we present monthly summaries near the 7th of each month, and each is available if you want to go back through my Extreme Temperature Diary archive. This particular month I’ve added a new category on my site for these posts here where you can check out reviews and statistics from prior months:
https://guyonclimate.com/category/record-scoreboard-climatological-reviews/
I’m repeating my mantra from last month:
November 2020 got ranked by the National Center for Environmental Information as a well average November, temperature wise, for the lower 48 states, coming in as the 123rd coolest or 4th warmest since records began being kept in 1895:
https://www.ncdc.noaa.gov/cag/national/rankings
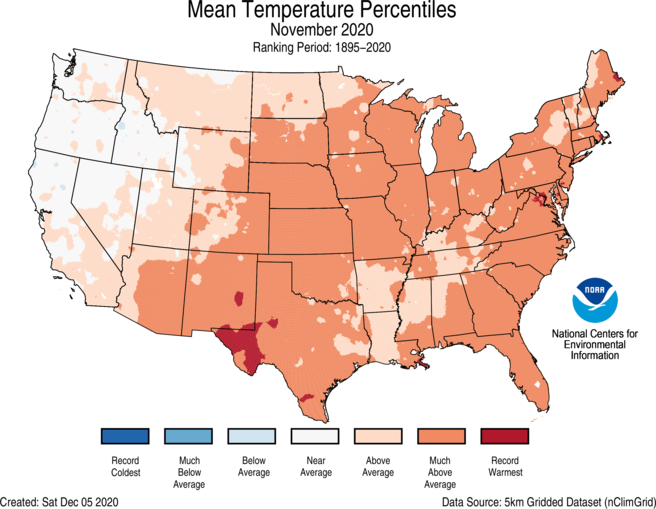
There were an above average number of extreme temperature reports during November. Record warmth occurred in just about every corner of the lower 48 states. Most cold records were recorded during the third week of the month in the Far West, which had the coolest rankings:
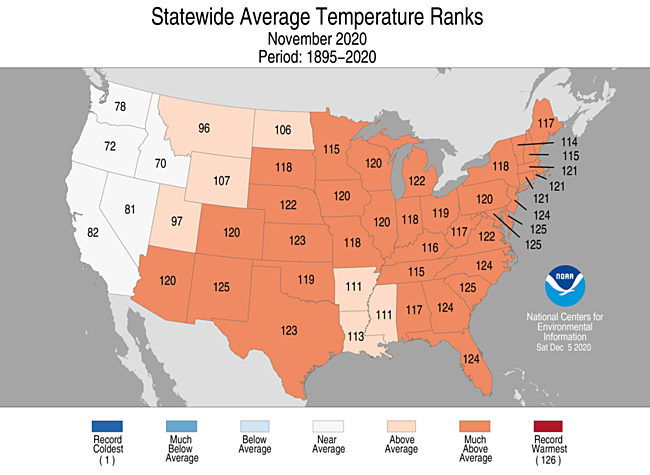
No one state had below average temperatures.
Here are my two U.S. Daily Record Scoreboards updated through 12/8/2020 (data compiled from the following NCEI site):
https://www.ncdc.noaa.gov/cdo-web/datatools/records

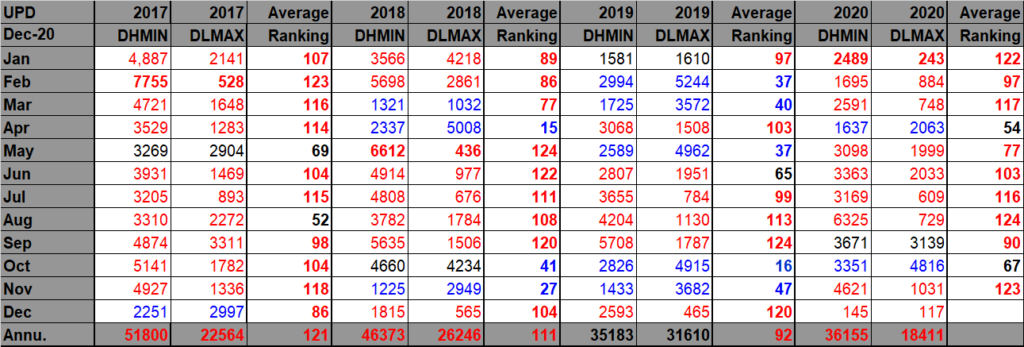
DHMX= Daily High Max Reports. DLMN= Daily Low Min Reports. DHMN= Daily High Min Reports. DLMX=Daily Low Max Reports.
For these data sets all monthly ratios of > 10 to 1 DHMX to DLMN or > 10 to 1 DLMN to DHMX are in bold type. The rankings are for the lower 48 states with the warmest ranking since 1895 of average temperatures being 125 and 1 being the coldest as of 2020. Blue colors represent cold months and red warm. Those months and years with counts close to a 1 to 1 ratio of highs to lows are colored black. Boldly colored months, such as January 2020, have ratios of more than 10 to 1 daily record highs to lows or lows to highs, and are either historically hot or cold, most of which have made news.
November 2020 had approximately an 8-1 ratio of record DHMX to DLMN individual record counts, so the color I used for this month was red on the top chart (And was closer than all states in the U.S. election).
November 2020 had approximately a 9-2 ratio of record DHMN to DLMX individual record counts, so the color I used for this month was red on the bottom chart.
Due to climate change we are seeing less blue colors on these Record Scoreboards with time, and November 2020 nearly got into bold red territory.
As stated, the ranking for November 2020 was 123, which was colored bred. I color rankings +10 or -10 from the average ranking of 63 black, indicating that these are near average temperature wise. Record statistics matched up well with the ranking of 123 in November.
We are seeing strong indications that in December 2020 we will have above average temperatures for most U.S. states looking at meteorological guidance. Also, looking at the record scoreboards, December 2020 has started out fairly toasty.
Here is much more detailed U.S. climatology as complied by NOAA, included an assessment for the historically active 2020 hurricane season, and climatological statistics for the fall:
https://www.ncei.noaa.gov/news/national-climate-202011
Assessing the U.S. Climate in November 2020
Fourth-warmest November and year-to-date for the contiguous U.S.; most active Atlantic hurricane season on record

For November, the contiguous U.S. average temperature was 46.4°F, 4.7°F above the 20th-century average, ranking fourth warmest in the November record. During meteorological autumn (September-November), the average temperature for the Lower 48 was 55.5°F, 2.0°F above average, ranking 11th warmest in the historical record. For the year to date, and with one month remaining in the calendar year, the contiguous U.S. temperature was 56.1°F, 2.3°F above the 20th-century average. This ranked fourth warmest in the January-November record. The four warmest January-November periods on record have all occurred since 2012.
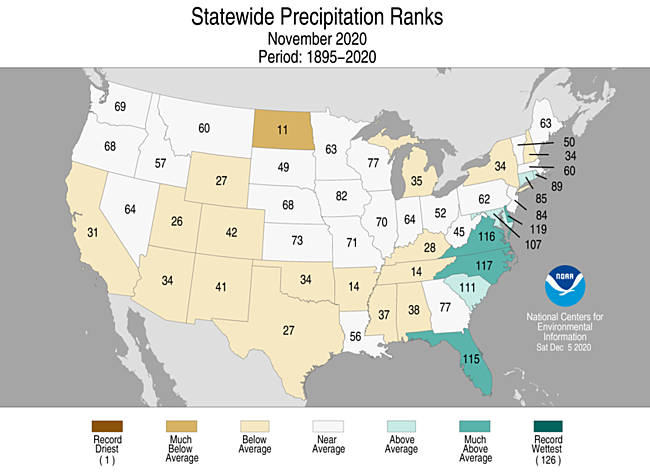
The November precipitation total for the contiguous U.S. was 1.90 inches, 0.33 inch below average, ranking in the driest third of the 126-year period of record. The autumn precipitation total across the Lower 48 was 6.52 inches, 0.36 inch below average, ranking in the middle third of the historical record. The year-to-date precipitation total across the contiguous U.S. was 28.26 inches, 0.67 inch above the long-term average, also ranking in the middle third of the January-November record. This was the driest year-to-date period since 2012.
Above-average tropical activity across the Atlantic Basin continued into November as one tropical storm and two major hurricanes formed. By the end of November, and the official ending of the Atlantic hurricane season, 30 named storms formed during 2020, which breaks the 2005 record of 28 for the most storms in a single season. Category 5 Hurricane Iota formed during November and was the most intense Atlantic hurricane of the season.

This monthly summary from NOAA National Centers for Environmental Information is part of the suite of climate services NOAA provides to government, business, academia, and the public to support informed decision-making.

- Above-average November temperatures were observed across most of the Lower 48. New Mexico, South Carolina, Maryland and Delaware each had their second-warmest November on record with nine additional states from the South to the Northeast ranking among their warmest five Novembers.
- Near-average temperatures occurred across portions of the West and Northwest. No notable regions of below-average temperatures were present across the Lower 48 during November.
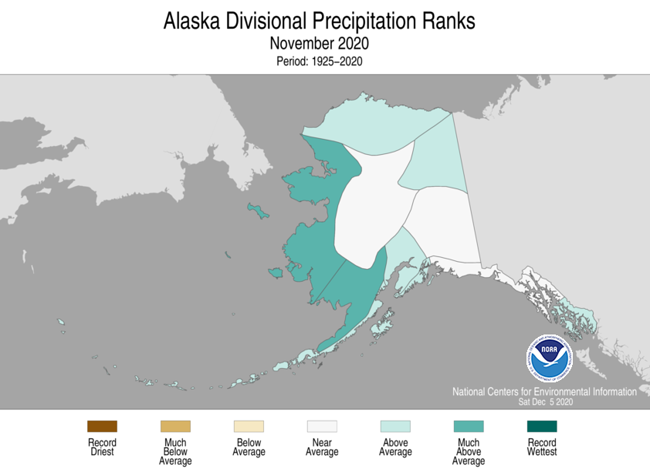
- The Alaska average November temperature was 14.3°F, 2.6°F above the long-term mean, ranking in the middle third of the 96-year period of record for the state. Above-average temperatures were present across portions of the North Slope and West Coast. Below-average temperatures were observed across the Southeast Interior, Northeast Gulf and the Panhandle. Utqiaġvik (Barrow) had its third-warmest November on record.


- A trough of low pressure in the middle of November contributed to above-average precipitation across portions of the Northwest, central Plains, western Great Lakes, Southeast and mid-Atlantic states. Precipitation received from Tropical Storm Eta helped North Carolina rank 10th wettest for November.
- Below-average precipitation occurred across parts of the West, northern Rockies, much of the northern Plains and from portions of the South to the Northeast. North Dakota ranked 11th driest for the month.
- In Alaska, statewide precipitation ranked in the wettest third of the historical record. Above-average precipitation occurred across portions of the North Slope, West Coast, Bristol Bay, Northeast Interior and South Panhandle regions. Precipitation across the rest of the state was near average for the month.
- According to the December 1 U.S. Drought Monitor report, approximately 48 percent of the contiguous U.S. was in drought, up nearly 3 percent from the beginning of November. Drought conditions expanded or intensified across portions of the northern and central Plains, Deep South and much of the West. Drought severity and/or extent lessened across much of New England and Hawaii and parts of the Pacific Northwest.

- Through November 30, and the official end of the Atlantic hurricane season, several records were tied or broken.
- Thirty named storms formed in the Atlantic, which breaks the previous record of 27 set in 2005. The 13 hurricanes and 6 major hurricanes in 2020 are both the second most on record behind 2005 (15 and 7, respectively).
- Twelve named U.S. storm continental landfalls occurred during 2020. This tops the 11 landfalls set through October 31 and breaks the previous annual record of nine landfalls set in 1916.
- Six hurricanes made U.S. landfall, tying 1886 and 1985 for the most U.S. hurricane landfalls in a single season.
- Category 4 Hurricane Eta made landfall near Puerto Cabezas, Nicaragua, on November 3 with winds of 140 mph. Eta weakened over land and eventually re-emerged into the Caribbean, making landfall in Cuba and eventually on the Lower Matecumbe Key in Florida as a tropical storm.
- Only two weeks after Eta’s landfall, category 5 Hurricane Iota reached peak intensity of 160 mph before weakening and making landfall along the northeast coast of Nicaragua as a Category 4 hurricane on November 16 and only 15 miles south of the location of Eta’s landfall. This was the first November on record to have two major Atlantic hurricanes.
- Iota was the only Category 5 storm during 2020, the strongest hurricane of the season and only the second Category 5 storm on record to form during November. The Cuba Hurricane of 1932 made landfall on November 8 and had 175 mph peak winds.
- Hurricane Iota was the second-strongest November hurricane on record for the Atlantic and was the strongest Atlantic hurricane on record to occur so late in the calendar year.
- This was a record fifth consecutive year with at least one Category 5 storm in the Atlantic.
- Five Category 4 and 5 storms formed in the Atlantic during 2020, tying with 1933, 1961, 1999 and 2005 for the record.

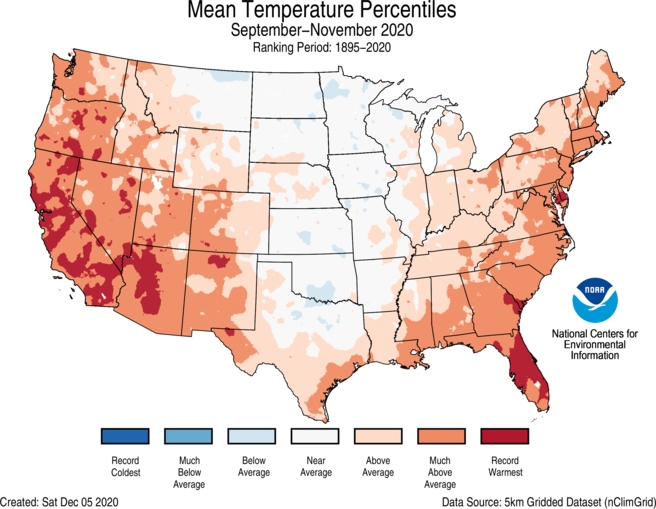
- Above-average autumn temperatures spanned much of the West and from the Deep South to New England. California and Florida ranked warmest on record.
- Near-average temperatures for autumn were observed across much of the northern and central Plains as well as the western Great Lakes.
- The Alaska statewide average temperature for autumn was 28.4°F, 2.5°F above average, ranking in the warmest third of the historical record. Northern and western portions of the state had above-average temperatures while portions of the Panhandle had temperatures that were below average for the season. In large part due to the loss and thinning of sea ice along Alaska’s northern coast, Utqiaġvik had its fourth-warmest autumn on record.


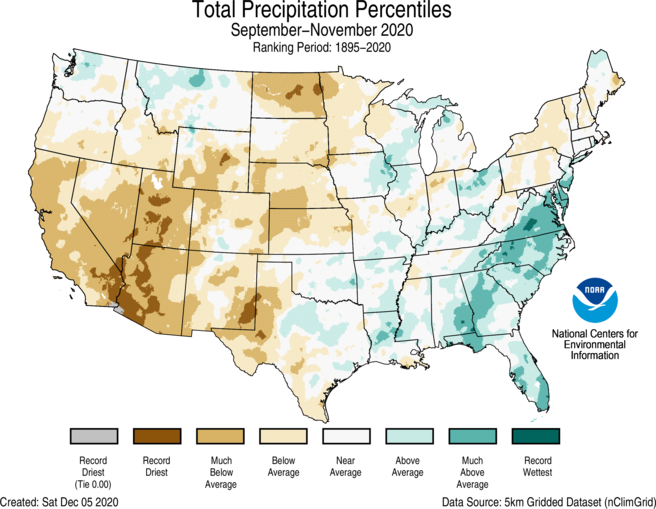
- Above-average precipitation was observed across the Southeast and mid-Atlantic as well as portions of the Northwest, South, Ohio Valley and Great Lakes. Virginia ranked fourth wettest on record.
- Below-average precipitation was observed across much of the West, the northern and central Plains and across parts of the Northeast. Utah and Arizona ranked driest on record for autumn with three additional states in the West and northern Plains ranking among their driest five autumns on record.
- Precipitation across Alaska during autumn ranked in the driest third of the historical record. Above-average precipitation occurred across portions of the North Slope, Northeast Interior and Bristol Bay regions while the Northeast Gulf and Panhandle regions had below-average precipitation for the season.


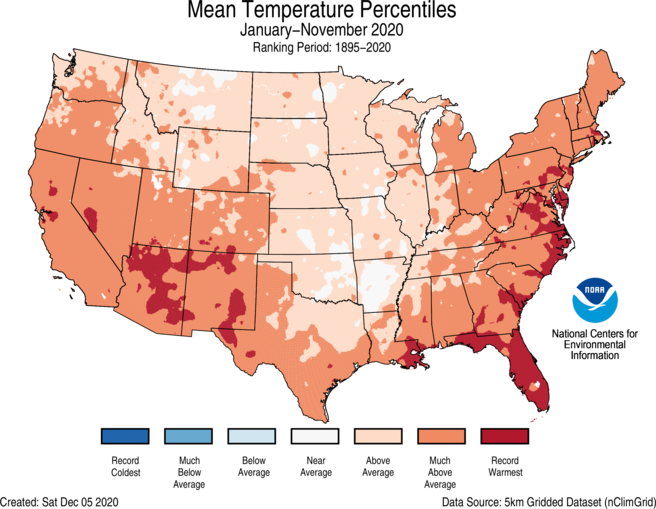
- Above-average year-to-date temperatures were observed across much of the Lower 48 with Florida, Virginia, Maryland, Delaware and Rhode Island ranking warmest on record.
- Near-average temperatures were observed in pockets across the northern Rockies, northern Plains as well as the southern Plains.
- It was the coolest January-November across Alaska since 2012. Year-to-date statewide temperatures ranked near average in Alaska with above-average temperatures observed across the northern and western portions of the state. Below-average temperatures were present across portions of the interior regions.


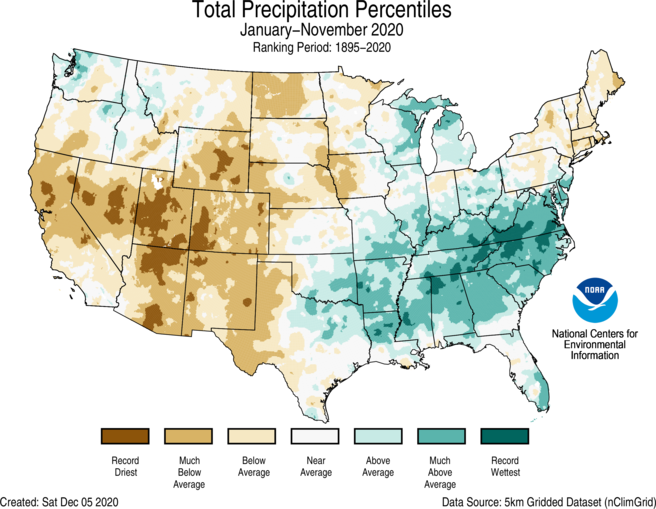
- Above-average January-November precipitation occurred in parts of the Northwest, Great Lakes and from the southern Plains to the mid-Atlantic. North Carolina ranked wettest on record while Virginia ranked third wettest for this 11-month period.
- Below-average precipitation occurred across much of the West, northern Plains and the Northeast. Utah ranked driest on record while six additional western states ranked among their driest five January-November periods.
- January-November precipitation in Alaska was above average across the interior regions, Bristol Bay and portions of the Panhandle. Drier-than-average conditions were present across the Aleutians as well as the central Gulf and northwest Panhandle.

………………………………………………………………………………………………………………
Here is more climate and weather news from Tuesday:
(As usual, this will be a fluid post in which more information gets added during the day as it crosses my radar, crediting all who have put it on-line. Items will be archived on this site for posterity. In most instances click on the pictures of each tweet to see each article. The most noteworthy items will be listed first.)
Now here are some of today’s articles and notes on the horrid COVID-19 pandemic:
(If you like these posts and my work please contribute via the PayPal widget, which has recently been added to this site. Thanks in advance for any support.)
Guy Walton “The Climate Guy”