The main purpose of this ongoing blog will be to track planetary extreme or record temperatures related to climate change. Any reports I see of ETs will be listed below the main topic of the day. I’ll refer to extreme or record temperatures as ETs (not extraterrestrials).😉
Main Topic: Why The Planet Had Its Coolest February In Years And What This Will Do For Planetary Averages For 2021
Dear Diary. The short answer to our main topic of the day would be that an anomalous bout of stratospheric warming over the Northern Hemisphere going into February led to tropospheric Arctic outbreaks, with the most significant being over North America, but there were probably other smaller factors such as the influence of La Niña. Let’s delve into what happened during the month, dissecting the stats so that we can get a better understanding of what to expect in the future when extreme cold tries to rear its head.
First. By no means has global warming ended. As discussed way back in 2017, when I wrote my first blog on this site, there will be divots and spikes on climatological charts showing an overall planetary warming trend. Despite being a big divot, according to NOAA February 2021 still hit the top 20 ranked months, coming in at 16th warmest since rankings began in 1880.
Here is more from Nasa:
In the last few months I have begun to build a “Record Scoreboard” for all-time global surface records based on Maximilliano Herrera’s data. Here we see what has transpired since 2016, when global temperatures spiked due to a near record warm El Nino:

For the above chart NCEI rankings are depicted since 1880. The number of all-time records from around the globe are noted, but unlike on my other charts, these exclude ties. Yearly NCEI anomalies with respect to 1981-2010 temperature averages have been added.
It’s interesting that just a very slight lowering of the Earth’s temperature has remarkably cut down on the number of all-time record heat reports so far in 2021. On the above table February 2021 is the coolest month relative to temperature averages depicted, and thus the lowest ranked.
For much more here is Dr. Jeff Master’s blog from Climate Connections including a forecast of global temperature averages for 2021:
February 2021 was the 16th-warmest February on record, NOAA reports
Even as Texas and much of the central U.S. froze, many other regions of the world were warmer than average last month.
By Jeff Masters, Ph.D. | Friday, March 12, 2021
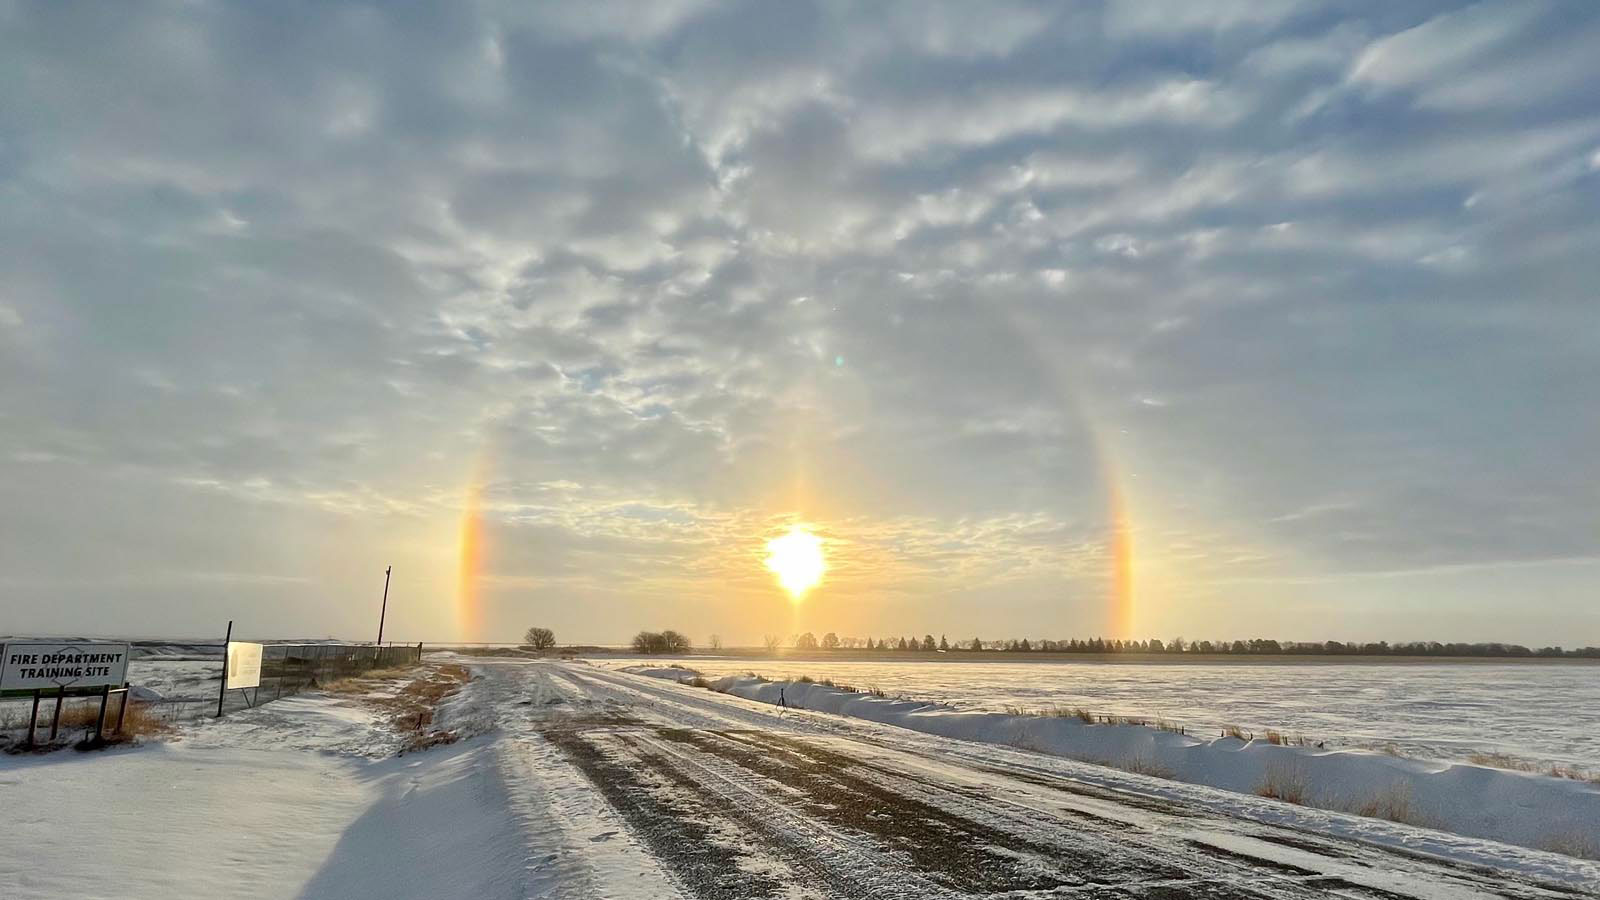
A brilliant 22° halo and sundogs at sunrise in Goodland, Kansas on February 16, 2021, shortly after a minimum temperature of -11°F (30 degrees below normal) was recorded. (Image credit: National Weather Service Goodland)
February 2021 was the 16th warmest February since global record keeping began in 1880, 0.65 degrees Celsius (1.17°F) above the 20th century average, NOAA’s National Centers for Environmental Information, NCEI, reported March 12.
NASA rated the month as the 14th warmest February on record. The Japan Meteorological Agency has not yet released its February numbers. Minor differences in rankings often occur among various research groups, the result of different ways they handle data-sparse regions such as the Arctic.
February 2021 was Earth’s coolest month (relative to average) since April 2015, according to the European Copernicus Climate Change Service, and the coolest February since 2014. This relative coolness was partially the result of a strong negative Arctic Oscillation (AO) during the first half of the month. In a negative AO phase, the jet stream weakens and meanders, creating larger troughs and ridges, allowing very cold Arctic air to spill southward over the mid-latitudes. The AO on February 10-11 was -5.3, which essentially ties February 5, 1978, and February 13, 1969, for the lowest February value on record.
According to NCEI’s annual temperature outlook, the year 2021 is 96% likely to rank among the 10 warmest years on record, and 85% likely to rank among the eight warmest years on record. In that latter case, each of the eight calendar years 2014 through 2021 would rank among the eight warmest years on record, dating back to 1880. The NCEI outlook finds that 2021 has just a 0.1% chance of displacing 2016 and 2020 as the warmest years on record. The low expectations for a warmest-year-on-record reflect the presence of a La Niña event in the Eastern Pacific, which cools the planet slightly.

Figure 1. Departure of temperature from average for February 2021, the 16th-warmest February for the globe since record keeping began in 1880. North America had its coldest February since 1994, and the 20th coldest February in the regional 112-year record. Record-warm February temperatures were limited to parts of the Mediterranean Sea, the Black and Caspian seas, as well as parts of southern Asia, and across small parts of South America, the North and South Pacific Ocean, and the Atlantic Ocean. No portions of the globe were record-cold. (Image credit: NOAA/NCEI)
Global ocean temperatures during February 2021 were the ninth warmest on record, and global land temperatures the 20th warmest on record. Global satellite-measured temperatures in February 2021 for the lowest eight kilometers of the atmosphere were the seventh warmest in the 43-year record, according to the University of Alabama Huntsville.

February 2021: nineteenth coldest February on record in the U.S.
The U.S. experienced its nineteenth coldest February since records began in 1895, with six states experiencing a top-10 coldest February, according to NOAA. The coldest February since 1989 broke all-time cold records at seven U.S. sites and one Mexican site with long-term records (see below), and the cold air over the Great Lakes allowed surface ice cover to peak at near-average levels (Figure 2).
February precipitation over the contiguous U.S. was near average. North Carolina and South Carolina recorded a top-10 wettest February on record, but no states recorded a top-10 driest February. According to the U.S. Drought Monitor, approximately 47% of the contiguous U.S. was in drought on March 11. Only one March since 2000 has had higher drought coverage – March 2013, with 53%.
The latest seasonal drought forecast from NOAA calls for drought to expand eastwards over a considerable portion of Texas, Oklahoma, and Kansas by June, but ease over a small portion of the Pacific Northwest. Drought is likely to be a major U.S. weather story in 2021, and probable causing what will probably be a multi-billion dollar weather disaster.
A warm winter for the U.S. and the globe
Despite the intense February cold wave, the winter (December-February) average for contiguous U.S. temperature was 0.8 degrees Celsius (1.4°F) above average, ranking in the warmest third of U.S. winters on record. Three states had below-average winter temperatures, and 24 states were above average. The only state experiencing a top-10 warmest or coldest winter was Maine, which had its third-warmest winter on record.
Globally, the December-January-February period (winter in the Northern Hemisphere, summer in the Southern Hemisphere) was the eighth warmest on record.

Figure 3. Pedestrians walk on a snow-covered expressway in Austin, Texas, on February 16, 2021. (Image credit: Texas DOT, Austin)
One billion-dollar weather disaster in February
A single billion-dollar weather disaster affected Earth in February 2021: a disastrous winter weather onslaught over the central U.S., which brought heavy snow, freezing rain, and severe cold February 12-20, killing at least 70 people and causing damages that will well exceed $10 billion, according to insurance broker Aon. The final cost of the event will likely make it the most expensive winter weather disaster in world history, surpassing the $10.1 billion (2020 dollars) of the 1993 “Storm of the Century” in the eastern U.S.
Three billion-dollar weather disasters through February
Through the end of February, Earth had experienced three billion-dollar weather disasters for the year, according to Aon:
1. Winter weather, U.S., Feb. 12-20, $10+ billion, 70 killed;
2. Winter weather, Spain, Jan. 8-12, $1.8 billion, four killed; and
3. Flooding, Western U.S., Jan. 24-29, $1.5 billion, two killed.

Figure 4. Departure of sea surface temperature (SST) from average in the benchmark Niño 3.4 region of the eastern tropical Pacific (5°N-5°S, 170°W-120°W). SSTs ranged from 0.2-0.8 degrees Celsius below average over the past month, close to the 0.5 degrees Celsius below average threshold for weak La Niña conditions. (Image credit: Tropical Tidbits)
La Niña weakens; expected to dissipate by June
Weak La Niña conditions remained in place during February 2021, and NOAA continued its La Niña advisory in a March 11 monthly discussion of the state of the El Niño/Southern Oscillation, or ENSO.
Over the past month, sea surface temperatures (SSTs) in the benchmark Niño 3.4 region of the eastern tropical Pacific (5°N-5°S, 170°W-120°W) have ranged between 0.2-0.8 degrees Celsius below average. The range for “weak” La Niña conditions is 0.5-1.0 degrees below average.
Forecasters at NOAA and at Columbia University’s International Research Institute for Climate and Society expect La Niña conditions to transition to “neutral” by summer (60% chance during April-May-June), and remain neutral during the summer. The forecast is more uncertain for the fall (September-October-November), with a 45-50% chance for La Niña, 40-45% chance for ENSO-Neutral, and a low chance for El Niño. Historically, about half of all La Niña events have continued into a second year.
Arctic sea ice: seventh lowest February extent on record
Arctic sea ice extent during February 2021 was the seventh lowest in the 43-year satellite record, according to the National Snow and Ice Data Center. Antarctic sea ice extent (https://nsidc.org/data/seaice_index) reached its annual minimum on February 21, and was the 12th lowest in the 43-year satellite record.
Notable global heat and cold marks for February 2021
– Hottest temperature in the Northern Hemisphere: 43.0°C (109.4F) at Los Pinzanes, Mexico, February 24;
– Coldest temperature in the Northern Hemisphere: -59.2°C (-74.6°F) at Geo Summit, Greenland, February 3;
– Hottest temperature in the Southern Hemisphere: 47.1°C (114.4°F) at Vioolsdrif, South Africa, February 9;
– Coldest temperature in the Southern Hemisphere: -61.8°C (-79.2°F) at Dome Fuji, Antarctica, February 25;
– Highest 2021 average temperature to date (Jan. 1-Feb. 28) worldwide: 32.6°C (90.7°F) at Marble Bar, Australia; and
– Highest 2021 average temperature to date (Jan. 1-Feb. 28) in the Northern Hemisphere: 30.4°C (86.7°F) at Kenieba, Mali.
(Courtesy of Maximiliano Herrera)
Major weather stations’ new all-time heat or cold records in February 2021
Among global stations with a record of at least 40 years, 10 set, not just tied, a new all-time cold record in February, and two stations set all-time heat records:
– El Bolson (Argentina) max. 38.2°C, February 5;
– Sontra (Germany) min. -25.6°C, February 10;
– Bukk Fennsic (Hungary) min. -35.5°C, February 13: New national record low in Hungary (unofficial, recorded in a sinkhole);
– Bottineau (North Dakota, USA) min. -46.1°C, February 13;
– Monclova (Mexico) min. -10.0°C, February 15;
– Limon (Colorado, USA) min. -33.3°C, February 15;
– Columbus (Nebraska, USA) min. -35.6°C, February 16;
– York (Nebraska, USA) min. -36.7°C, February 16;
– Superior (Nebraska, USA) min. -36.1°C, February 16;
– Osceola (Nebraska, USA) min. -35.0°C, February 16;
– Lincoln (Nebraska, USA) min. -36.7°C, February 16; and
– Puerto Williams (Chile) max. 26.1°C, February 27.
One all-time national/territorial cold record set or tied in 2021
As of March 12, 2021, one nation or territory had set or tied an all-time national cold record:
United Arab Emirates (for places at low elevations): -2.0°C (28.4°F) at Raknah, January 9.
No all-time national/territorial heat records have been set thus far in 2021.
Twenty-two monthly national/territorial heat records beaten or tied as of February 28
– January (10): Mexico, Bangladesh, Nigeria, Japan, Malta, Tunisia, Turkey, Russia, Georgia, Spain
– February (12): Iraq, Uzbekistan, Mongolia, South Korea, Liechtenstein, Slovenia, Croatia, Slovakia, Poland, Sweden, Pakistan, Northern Mariana Islands
No national/territorial monthly cold records in addition to the one all-time national record in the UAE mentioned above have been set thus far in 2021.
Hemispherical and continental temperature records in 2021
None.
Website visitors can comment on “Eye on the Storm” posts (see below). Please read our Comments Policy prior to posting. (See all EOTS posts here. Sign up to receive notices of new postings here.)
TOPICS: WEATHER EXTREMES
Lastly, let’s briefly delve into why a stratospheric warming event would occur. For this purpose let’s use Wikipedia:
Classification and description[edit]
SSW is closely associated with polar vortex breakdown. Meteorologists typically classify vortex breakdown into three categories: major, minor, and final. No unambiguous standard definition of these has so far been adopted.[2] However, differences in the methodology to detect SSWs are not relevant as long as circulation in the polar stratosphere reverses.[4] “Major SSWs occur when the winter polar stratospheric westerlies reverse to easterlies. In minor warmings, the polar temperature gradient reverses but the circulation does not, and in final warmings, the vortex breaks down and remains easterly until the following boreal autumn”.[2]
Sometimes a fourth category, the Canadian warming, is included because of its unique and distinguishing structure and evolution.
“There are two main types of SSW: displacement events in which the stratospheric polar vortex is displaced from the pole and split events in which the vortex splits into two or more vortices. Some SSWs are a combination of both types”.[2]
Major[edit]
These occur when the westerly winds at 60N and 10 hPa reverse, i.e. become easterly. A complete disruption of the polar vortex is observed and the vortex will either be split into daughter vortices, or displaced from its normal location over the pole.
According to the World Meteorological Organization‘s Commission for Atmospheric Sciences (Mclnturff, 1978)[who?]: a stratospheric warming can be said to be major if at 10 mb or below the latitudinal mean temperature increases poleward from 60 degree latitude and an associated circulation reversal is observed (that is, the prevailing mean westerly winds poleward of 60 latitude are succeeded by mean easterlies in the same area).
Minor[edit]
Minor warmings are similar to major warmings however they are less dramatic, the westerly winds are slowed, however do not reverse. Therefore, a breakdown of the vortex is never observed.
Mclnturff[who?] states: a stratospheric warming is called minor if a significant temperature increase is observed (that is, at least 25 degrees in a period of week or less) at any stratospheric level in any area of winter time hemisphere. The polar vortex is not broken down and the wind reversal from westerly to easterly is less extensive.
Final[edit]
The radiative cycle in the stratosphere means that during winter the mean flow is westerly and during summer it is easterly (westward). A final warming occurs on this transition, so that the polar vortex winds change direction for the warming, however do not change back until the following winter. This is because the stratosphere has entered the summer easterly phase. It is final because another warming cannot occur over the summer, so it is the final warming of the current winter.
Canadian[edit]
Canadian warmings occur in early winter in the stratosphere of the Northern Hemisphere, typically from mid November to early December. They have no counterpart in the southern hemisphere.
Dynamics[edit]
In a usual northern-hemisphere winter, several minor warming events occur, with a major event occurring roughly every two years. One reason for major stratospheric warmings to occur in the Northern hemisphere is because orography and land-sea temperature contrasts are responsible for the generation of long (wavenumber 1 or 2) Rossby waves in the troposphere. These waves travel upward to the stratosphere and are dissipated there, decelerating the westerly winds and warming the Arctic. This is the reason that major warmings are only observed in the northern-hemisphere, with two exceptions. In 2002 and 2019, southern-hemisphere major warmings were observed.[5][6][7] These events are not fully understood.
.
……………………………………………………………………………………………..
Will this “cooling trend” last for much of 2021? Find out here on this site.
Here is some more climatology from March 2021:
Here is more climate and weather news from Saturday:
(As usual, this will be a fluid post in which more information gets added during the day as it crosses my radar, crediting all who have put it on-line. Items will be archived on this site for posterity. In most instances click on the pictures of each tweet to see each article. The most noteworthy items will be listed first.)
Now here are some of today’s articles and notes on the horrid COVID-19 pandemic:
(If you like these posts and my work please contribute via the PayPal widget, which has recently been added to this site. Thanks in advance for any support.)
Guy Walton “The Climate Guy”