The main purpose of this ongoing blog will be to track planetary extreme or record temperatures related to climate change. Any reports I see of ETs will be listed below the main topic of the day. I’ll refer to extreme or record temperatures as ETs (not extraterrestrials).😉
Main Topic: Early November Record Scoreboard And Climatological Review
Dear Diary. It’s time once again for our monthly climatological review. Here on this site we present monthly summaries near the 8th of each month, and each is available if you want to go back through my Extreme Temperature Diary archive under my “Record Scoreboard Climatological Reviews” category (located on the upper left hand corner of my home page):
https://guyonclimate.com/category/record-scoreboard-climatological-reviews/
I’m repeating my mantra from prior months:
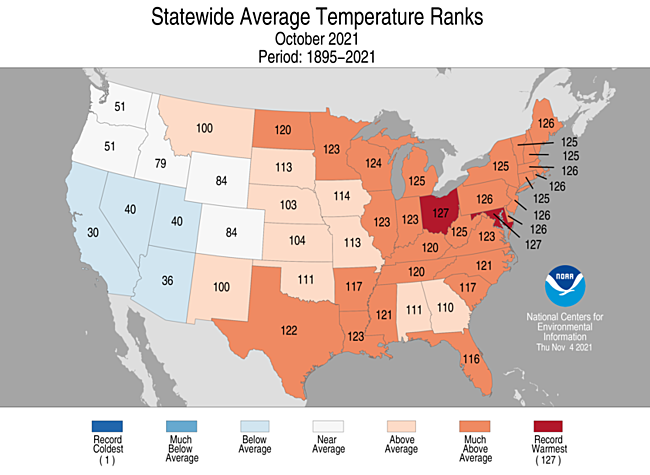
October 2021 got ranked by the National Center for Environmental Information as 6th warmest, temperature wise, for the lower 48 states, or 122nd coldest since records began being kept in 1895:
https://www.ncdc.noaa.gov/cag/national/rankings/110/tavg/202110
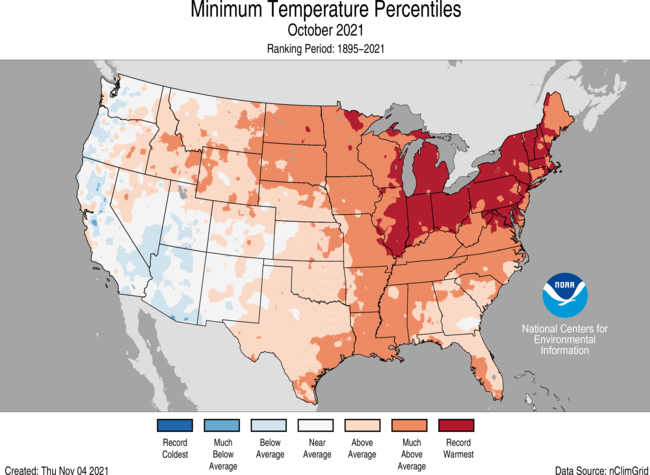
The weather pattern switched in October with the West finally getting a break from dry hot conditions. The East saw well above average temperatures with Ohio and Maryland seeing a record warm October.
What’s most disturbing is the following statistic:
Here are my two U.S. Daily Record Scoreboards updated through 11/08/2021 (data compiled from the following NCEI site):
https://www.ncdc.noaa.gov/cdo-web/datatools/records
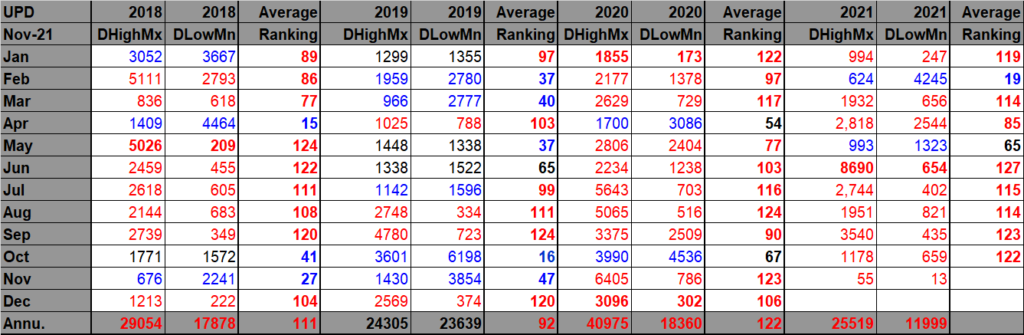
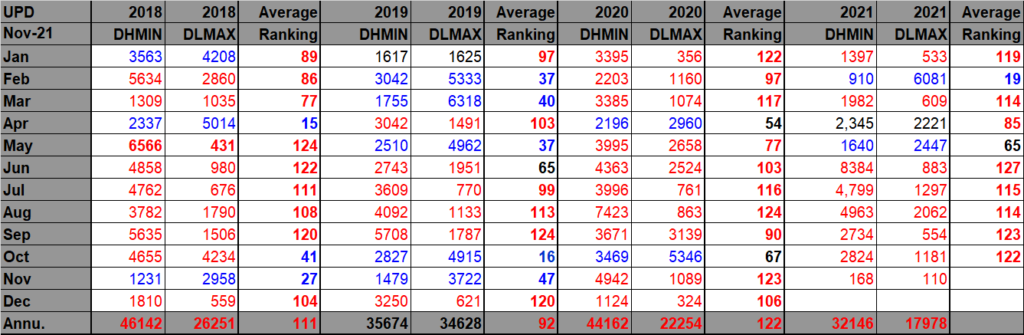
DHMX= Daily High Max Reports. DLMN= Daily Low Min Reports. DHMN= Daily High Min Reports. DLMX=Daily Low Max Reports.
For these data sets all monthly ratios of > 10 to 1 DHMX to DLMN or > 10 to 1 DLMN to DHMX are in bold type. The rankings are for the lower 48 states with the warmest ranking since 1895 of average temperatures being 127 and 1 being the coldest as of 2021. Blue colors represent cold months and red warm. Those months and years with counts close to a 1 to 1 ratio of highs to lows are colored black. Boldly colored months, such as June 2021, have ratios of more than 10 to 1 daily record highs to lows or lows to highs, and are either historically hot or cold, most of which have made news.
October 2021 had approximately a 1.8-1 ratio of record DHMX to DLMN individual record counts, so the color I used for this month was red on the top chart.
October 2021 had approximately a 2.4-1 ratio of record DHMN to DLMX individual record counts, so the color I used for this month was red on the bottom chart.
Due to climate change we are seeing less blue colors on these Record Scoreboards with time, and October 2021 certainly fit this trend.
As stated, the ranking for October 2021 was 122, which was colored red. I color rankings +10 or -10 from the average ranking of 63 black, indicating that these are near average temperature wise. Record statistics matched up well with the ranking of 122 for October 2021.
As shown on both charts, we can see that November 2021 has gotten off to a warm start, but there have been relatively few reports of records so far. Will November 2021 be the sixth consecutive warmer than average month in which record heat exceeds record chill? Warmer than average conditions with record warmth from the Rockies into the Midwest should continue for much of this week, but polar air masses will begin to dive deep into the country starting this weekend.
Brief summary for October 2021: Most reports of record warmth came from the West and northern Plains early in the month. Most record chill came from the Pacific Northwest during the middle of the month.
Here is much more detailed October 2021 U.S. climatology as complied by NOAA:
https://www.ncei.noaa.gov/news/national-climate-202110
Assessing the U.S. Climate in October 2021
Sixth-warmest October on record; Category 5 atmospheric river dropped record precipitation on portions of California

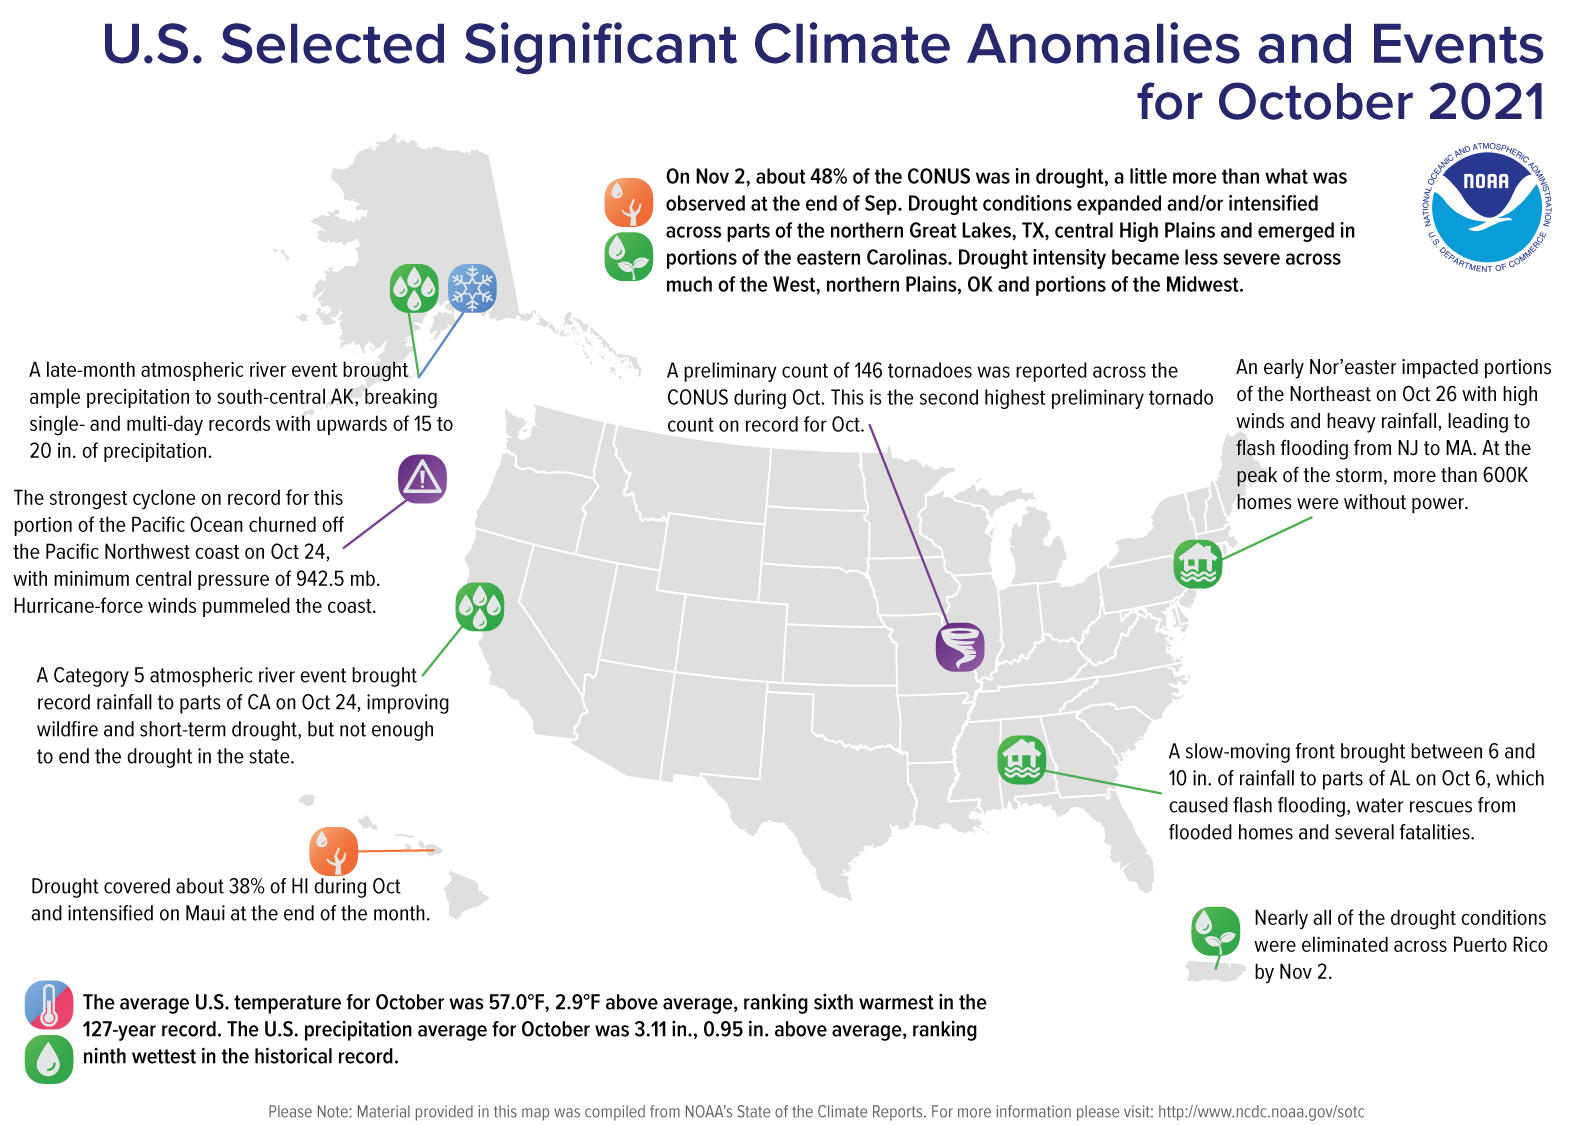
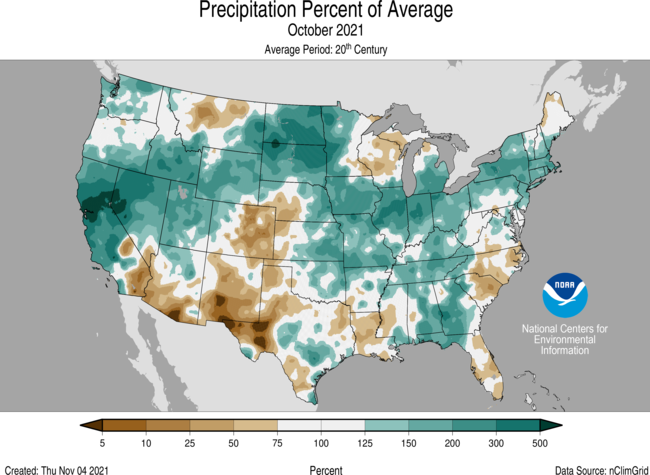
Conveyor belts of Pacific moisture, defined as atmospheric rivers, impacted much of the central West Coast from October 19-26. On October 24, a Category 5 (exceptional) atmospheric river event brought record rainfall to parts of central California. The heavy rain near wildfire burn scars triggered multiple landslides, yet helped partially snuff out the wildfire season and lessened the drought severity across this portion of the West.
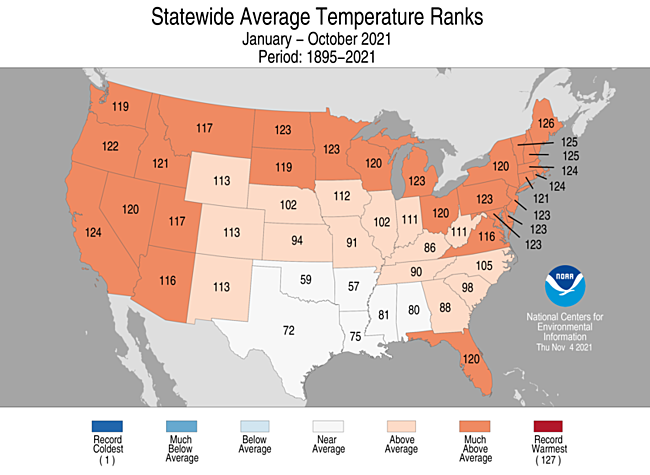
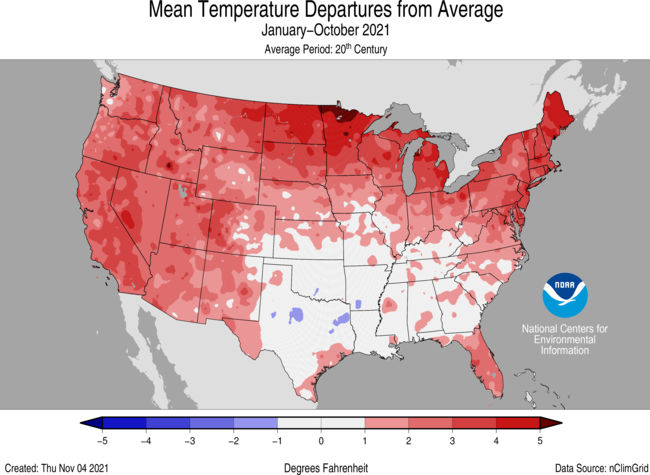
For October, the average contiguous U.S. temperature was 57.0°F, 2.9°F above the 20th-century average. This ranked sixth warmest in the 127-year period of record. For the year-to-date, the contiguous U.S. average temperature was also 57.0°F, 2.0°F above average, and ranked ninth warmest in the January-October record.
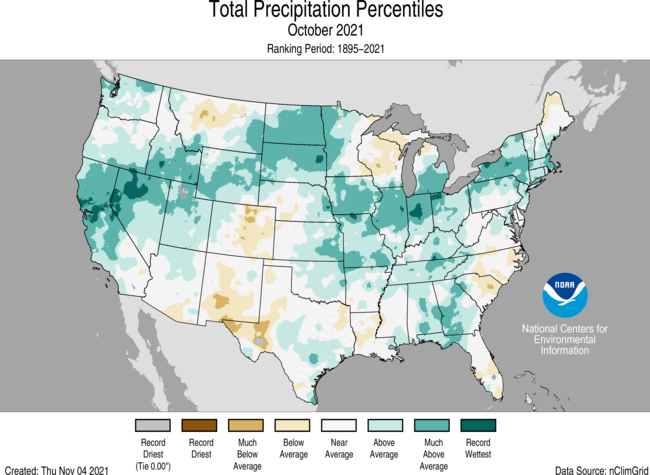
The October precipitation total for the contiguous U.S. was 3.11 inches, 0.95 inch above average, and ranked ninth wettest in the historical record. For the year-to-date, the contiguous U.S. precipitation total was 26.74 inches, 1.38 inches above average, and ranked in the wettest third of the January-October record.
This monthly summary from NOAA National Centers for Environmental Information is part of the suite of climate services NOAA provides to government, business, academia, and the public to support informed decision-making.
October
Temperature
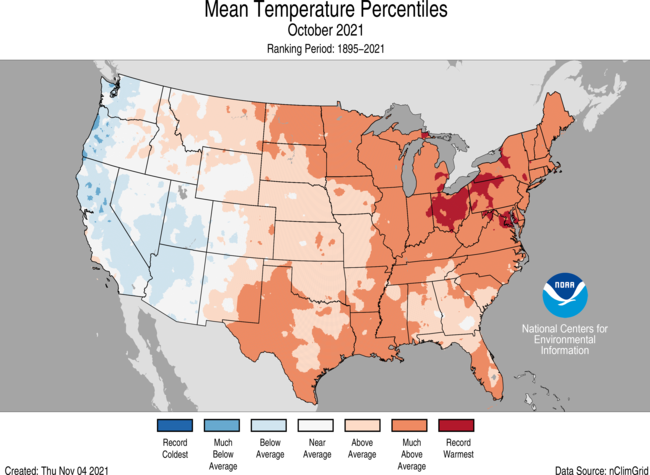
- Temperatures were above average from the Rocky Mountains to the East Coast. Ohio and Maryland ranked warmest on record for October while Pennsylvania, Delaware, New Jersey, Massachusetts, Rhode Island and Maine each ranked second warmest. Temperatures were below average across portions of the West Coast and Southwest.
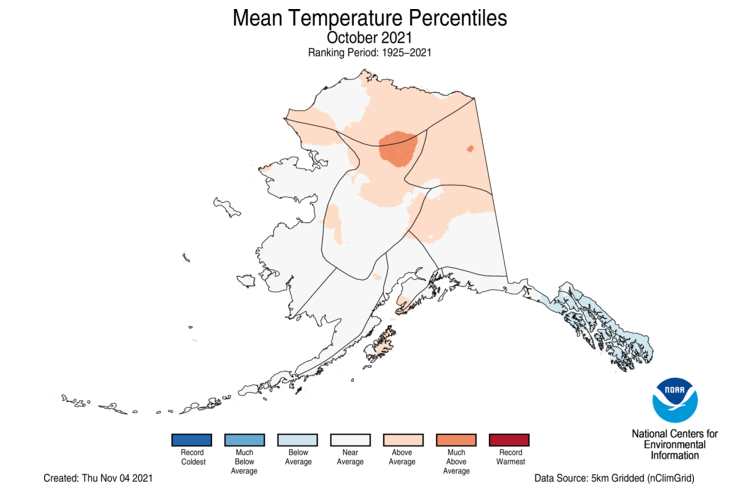
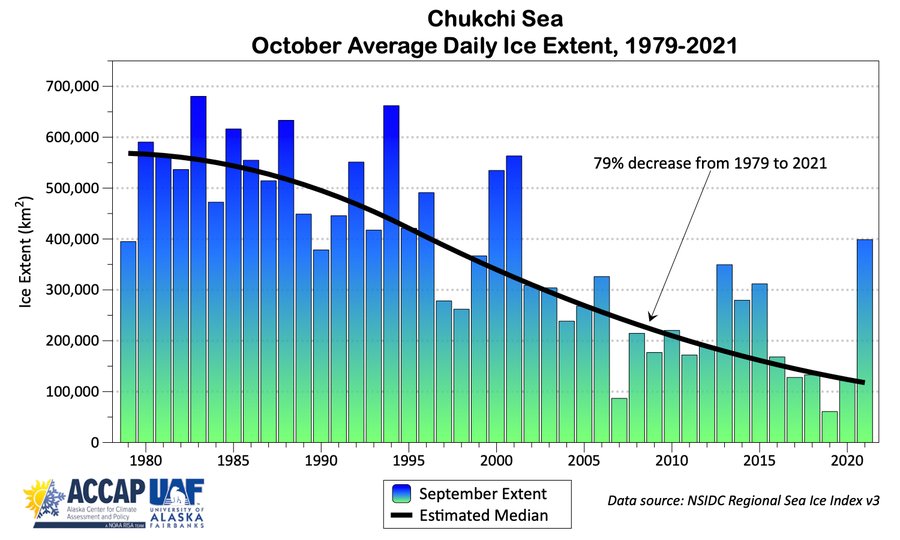
- Alaska ranked in the middle third of the October record with a statewide average temperature of 28.0°F, 2.5°F above the long-term average. Temperatures were above average across portions of the Alaskan Interior and North Slope and slightly below average across the Panhandle. Despite the year-to-year downward trend in October sea ice extent, the average Chukchi Sea ice extent during October was the highest seen since 2001.

Precipitation

- Precipitation was above average across parts of the West, Plains, Great Lakes, Midwest, Southeast and Northeast. California and Illinois ranked fourth wettest on record for October. Precipitation was below average across portions of the Southwest, central Rockies and western Great Lakes.
- Multiple atmospheric river (AR) events occurred from October 19-26. The AR Category 5 event on October 24 brought record rainfall to portions of central California. Sacramento, Blue Canyon and Santa Rosa each reported their wettest 24-hour period on record during this event. Heavy mountain snowfall made travel through passes nearly impossible.
- While the AR events were impacting the West Coast, the East Coast experienced an early fall Nor’easter. On October 26, high winds and heavy rainfall led to flash flooding and power outages from New Jersey to Massachusetts.
- Alaska’s statewide average of 4.50 inches of precipitation in October was 0.11 inch above the long-term average and ranked in the middle one-third of the 97-year record. A late-month atmospheric river event transported ample amounts of moisture into south-central Alaska. Alyeska reported its wettest single day and 3-day period on record with 9.53 inches and 15.05 inches of precipitation, respectively. Portage Glacier Visitors Center received nearly 20 inches of rain during the last three days of October with accumulations continuing into early November.
- According to the November 2U.S. Drought Monitor report, approximately 48 percent of the contiguous U.S. was in drought, a little more than what was observed at the end of September. Drought conditions expanded and/or intensified across parts of the northern Great Lakes, Texas, central High Plains and emerged in portions of the eastern Carolinas. Drought intensity became less severe across much of the West, northern Plains, Oklahoma, portions of the Midwest and was nearly eliminated across Puerto Rico.
Extremes
- A persistent ridge of high pressure across the eastern U.S. contributed to the record warm October temperatures observed in locations spanning from Milwaukee to New Haven, CT. Record-warm mild nights were observed from the Great Lakes to southern New England and were the main driver for these warm monthly temperatures.
- An all-time record low pressure system (942.5 mb) for a storm in this region developed in the eastern Pacific Ocean and strengthened rapidly on October 24, generating hurricane force winds and wave heights up to 45 feet off the coast of Washington and Oregon while channeling several waves of Pacific moisture toward the West Coast.
- Sacramento, CA, set a record of 211 days without measurable precipitation in 2021. This streak ended on October 17. On October 24, a category 5 atmospheric river event brought 5.45 inches of rainfall to Sacramento, breaking the previous single-day precipitation record of 5.28 inches, set in 1880.
- Preliminary tornado counts across the U.S. during October were second highest on record for the month with a count of 146. Only preliminary counts in 2018 ranked higher with 159 tornadoes reported. Oklahoma reported a record 31 tornadoes for October, which exceeds the previous record of 27 set in 1998.
Year-to-date (January–October)
Temperature
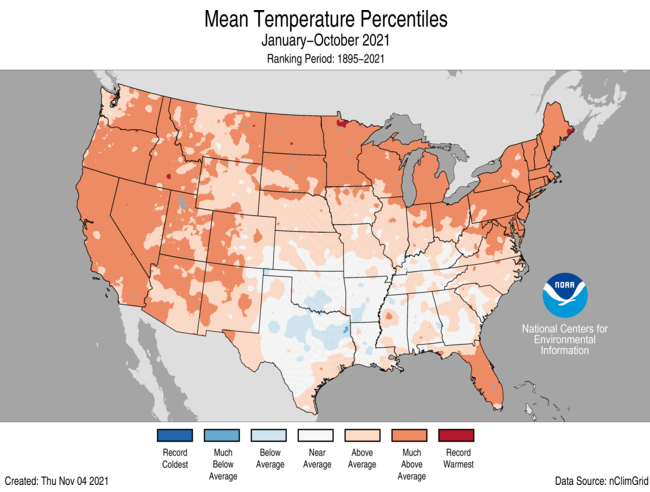
- Year-to-date temperatures were above average across much of the Lower 48. Maine ranked second warmest on record while Vermont and New Hampshire ranked third warmest on record for this 10-month period. Temperatures were below average across portions of the Deep South.
- Temperatures across Alaska ranked in the middle third of the historical record for January-October with a statewide average temperature of 30.6°F, 1.0°F above the long-term average. Temperatures were above average across portions of southwestern and northeastern Alaska.
Precipitation
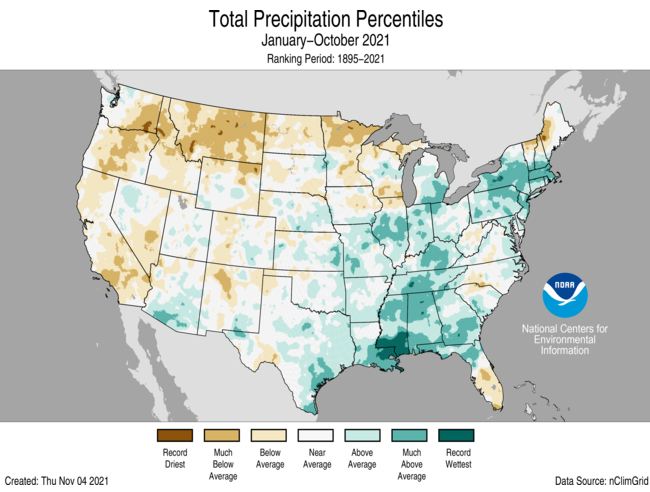
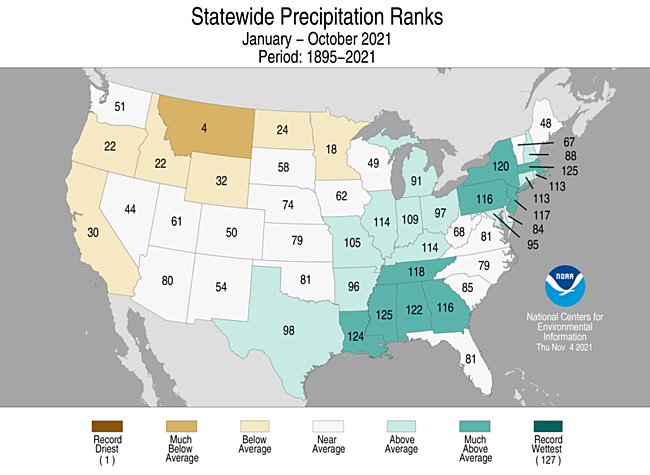
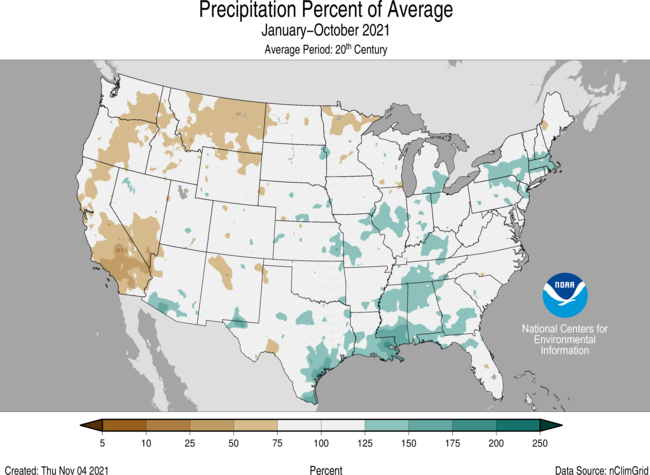
- January-October precipitation was above average from the Deep South to the Great Lakes and into the Northeast. Mississippi and Massachusetts ranked third wettest while Louisiana ranked fourth wettest for this year-to-date period. Precipitation was below average across portions of the West, northern Plains, Great Lakes and New England. Montana ranked fourth driest for this period.
- Across Alaska, year-to-date precipitation was above average. Cook Inlet was drier than average while much of the Interior regions, West Coast, North Slope and Panhandle received above-average precipitation for the first 10 months of the year.
For more detailed climate information, check out our comprehensive October 2021 U.S. Climate report scheduled for release on November 12, 2021.
Here are some “ET’s” reported from Sunday and Monday:
Here is more new October 2021 climatology:
Here are some more COP26 articles and news:
Here is more climate and weather news from Monday:
(As usual, this will be a fluid post in which more information gets added during the day as it crosses my radar, crediting all who have put it on-line. Items will be archived on this site for posterity. In most instances click on the pictures of each tweet to see each article. The most noteworthy items will be listed first.)
Now here are some of today’s articles and notes on the horrid COVID-19 pandemic:
(If you like these posts and my work please contribute via the PayPal widget, which has recently been added to this site. Thanks in advance for any support.)
Guy Walton “The Climate Guy”