Dear Diary. The main purpose of this ongoing blog will be to track global extreme or record temperatures related to climate change. Any reports I see of ETs will be listed below the main topic of the day. I’ll refer to extreme or record temperatures as ETs (not extraterrestrials).😉
Affirming Results…It’s Getting Drier West and Wetter East of the Rockies
Dear Diary. As we know, our climate is changing and with each passing year more rapidly. Over the past decade I’ve seen many articles stating that the U.S. West is in a long-term drying trend, with the East getting wetter. Precipitation around the planet is getting heavier, coming in short bursts, in many instances producing damaging flooding.
In science a claim, such as that in my first paragraph, needs to be studied then reaffirmed time and time again. I’m doing this for the Meehl Record Study constantly to show how our warming climate affects extremely hot or cold surface temperatures, which are a big health concern. This weekend I learned that USA Today has completed a very thorough review reaffirming that indeed the West is drying while East of the Rockies the climate is getting wetter, in some instances via short, heavy downbursts.
Take a look:
Note: I did not include some video or images from the article. The original can be read from this link:
USA TODAY investigation reveals a stunning shift in the way rain falls in America
Nicole Carroll USA TODAY
Published 12/3/2021
I’m USA TODAY editor-in-chief Nicole Carroll, and this is The Backstory, insights into our biggest stories of the week. If you’d like to get The Backstory in your inbox every week, sign up here.
Think your area has had more rain than usual? You’re probably right.
Think your area has had less rain than usual? Again, you’re probably right.
For our climate change investigation out this week, called Downpour, USA TODAY reporters used 126 years of monthly data from the National Oceanic and Atmospheric Administration to analyze average annual precipitation at 344 climate divisions. They used daily precipitation data from weather stations to measure the change in frequency of extreme rain events across the U.S. from 1951-2020.
“We were hearing a lot about extreme rainfall, stories of flooding, people with sewer backups, people flooded out of their homes, and we wanted to know, is this happening everywhere?,” said Dinah Pulver, one of the project’s lead reporters. “How many people, how many places, are contending with this kind of rainfall?
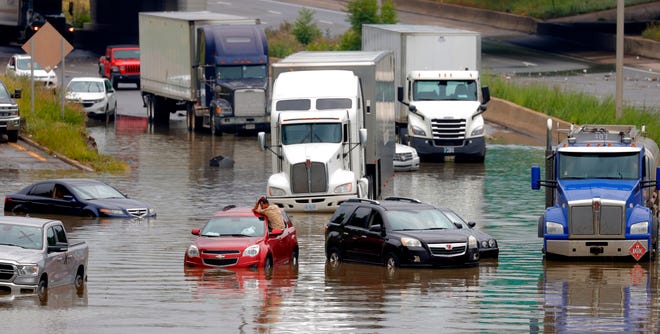
Image credit from Erik Seals, Detroit Free Press
We found more than half of the nation’s 344 climate divisions had their wettest periods on record since 2018. We calculated the same rolling averages for states.
“East of the Rockies, more rain is falling, and it’s coming in more intense bursts,” our report finds. “In the West, people are waiting longer to see any rain at all.
“Taken together, the reporting reveals a stunning shift in the way precipitation falls in America.”
Specifically, our reporting finds:
- At some point over the past three years, 27 states – all east of the Rocky Mountains – hit their highest 30-year precipitation average since record keeping began in 1895.
- A dozen states, including Iowa, Ohio and Rhode Island, saw five of their 10 wettest years in history over the past two decades.
- Michigan saw six of its wettest 10 years on record over the past 13 years.
- In June, at least 136 daily rainfall records were set during storms across five states along the Mississippi River.
- At the opposite extreme, eight states – including five in the West – had at least three record-dry years in the same time period. That’s double what would be expected based on historical patterns.
Look up your zip code: See how precipitation has changed in your community
“People talk about the climate we’re leaving for our kids or the climate of the future,” Pulver said. “But the reality is climate change is here now and it’s affecting most of us.”
So how does the warming planet impact rainfall?
Michael Mann, a climatologist at Penn State University, told our reporters the greenhouse effect is important to keep Earth from freezing, but excess heat greatly reduces the temperature difference between the warmer tropics and cooler polar regions in the summer.
Mann said that reduction in the temperature difference slows down the jet stream, which makes it weaker and wavier in the summer. That means weather systems moving across the country can slow or stall more often.
“The gentle rains for a number of days are kind of disappearing and are being replaced by downpours,” said Chris Davis, USA TODAY’s executive editor for investigations. “And that in and of itself has a lot ramifications, everything from flooding, to mudslides out west, to how much fertilizer gets picked up and carried into the Mississippi River and down into the Gulf of Mexico.”
In the West, the high temperatures and lingering high pressure systems pull moisture from soil and plants. The increased heat and long periods between rains contribute to record wildfires.
“They’re all interconnected to the impact that climate change is having on these persistent weather extremes,” Mann said. “It’s not a contradiction to have huge floods, unprecedented floods and unprecedented heat waves and droughts at the same time.”
The downpours bring a deluge of problems. Stormwater, sewage and drinking water pipes are 50 to 100 years old and nearing the end of their life expectancy, said Christine Kirchhoff, an associate professor in civil and environmental engineering at the University of Connecticut.
That leaves communities increasingly vulnerable to flooding. It also prompts massive releases of treated and untreated wastewater into waterways, which can cause or inflame gastrointestinal issues.
Downpours also push fertilizer from Midwestern fields into rivers, which ultimately slowly poison the Gulf of Mexico.
“But it’s not just the Gulf of Mexico,” reported Ignacio Calderon, with our partner the Midwest Center for Investigative Reporting. “Fertilizer runoff wreaks havoc on rivers and lakes across the country. It contaminates drinking water, harms aquatic life and sickens both people and pets.”
It took our reporters months to collect, organize, analyze and publish this information. Now, you can see how rainfall has changed in your community in just seconds.
Here, you can enter your address or ZIP code to see how rainfall has changed dating back to 1895.
Data reporter Kevin Crowe led our data analysis efforts, a huge undertaking given the number of climate divisions and years of data. Crowe ran our methodology by several scientists to make sure our findings were spot on. We also drew on the data and expertise of climatologist Brian Brettschneider.
What stood out?
“Looking at states in the Midwest and in the Northeast and just how much more rain places like Michigan, Indiana or Ohio or Pennsylvania are getting, that kind of boggled my mind,” Crowe said. “I mean the Great Lakes are higher, all sorts of things kind of indicate that there’s more water falling, but just seeing the overall trend lines was still pretty surprising.”
Our team also dreamed up creative ways to help our readers understand the changing rainfall. Developer Chris Amico wondered if we could create a sonification of the hundred-plus years of rainfall data.
Pulver took that challenge to Florida’s Full Sail University, where musicians composed songs based on changing precipitation patterns in several states.
Timothy Stulman, a composer and department chair of music composition, took on Pennsylvania. He gathered sounds of wind, thunder and rain, then combined those with flute and cello melodies. The density and volume directly correlate to the data.
“If there was a really high rainfall year, I would choose recordings of intense rainfall, strong winds, and mix them with loud thunderclaps,” he told us. “So it’s not a single recording of a storm, but rather various storm elements blended together based on the rainfall data.”
The point of all of this work is to help people understand the impact of climate change, right now, in their specific communities.
“These extreme events are not coincidence. They’re really all part of the same pattern,” said investigative editor Emily Le Coz.
“You still hear terms like ‘100-year rainfall event’ or this is a ’50-year flood.’ Those terms are sort of meaningless now. What’s the point of calling it a 100-year event if it’s happened five times in the last decade?
“There’s a lot that we need to do to wrap our brains around the new reality that we’re living in.”
Nicole Carroll is the editor-in-chief of USA TODAY. Reach her at EIC@usatoday.com or follow her on Twitter here. Support journalism like this – subscribe to USA TODAY here. (Our current deal: $1 a week for 52 weeks.)
Here are “ET’s” reported from Sunday:
Here is more November 2021 climatology:
Here is more climate and weather news from Sunday:
(As usual, this will be a fluid post in which more information gets added during the day as it crosses my radar, crediting all who have put it on-line. Items will be archived on this site for posterity. In most instances click on the pictures of each tweet to see each article. The most noteworthy items will be listed first.)
Now here are some of today’s articles and notes on the horrid COVID-19 pandemic:
(If you like these posts and my work please contribute via the PayPal widget, which has recently been added to this site. Thanks in advance for any support.)
Guy Walton “The Climate Guy”