The main purpose of this ongoing blog will be to track planetary extreme, or record temperatures related to climate change. Any reports I see of ETs will be listed below the main topic of the day. I’ll refer to extreme or record temperatures as ETs (not extraterrestrials).😉
Main Topic: Early March Record Scoreboard and Climatological Review
Dear Diary. Many of my readers might have noticed that I am placing notes on the awful Ukraine war instead of those pertaining to what we all hope is a waning COVID19 pandemic. I hope that this Ukraine news is helpful. As far as the entire world goes, as we move forward through the 21st century, I want us all to work towards the following goal:
Now let us press on with climate science and reports.
It’s time once again for our monthly climatological review. Here on this site, we present monthly summaries near the 8th of each month, and each is available if you want to go back through my Extreme Temperature Diary archive under my “Record Scoreboard Climatological Reviews” category (located on the upper left-hand corner of my home page):
https://guyonclimate.com/category/record-scoreboard-climatological-reviews/
I’m repeating my mantra from prior months:
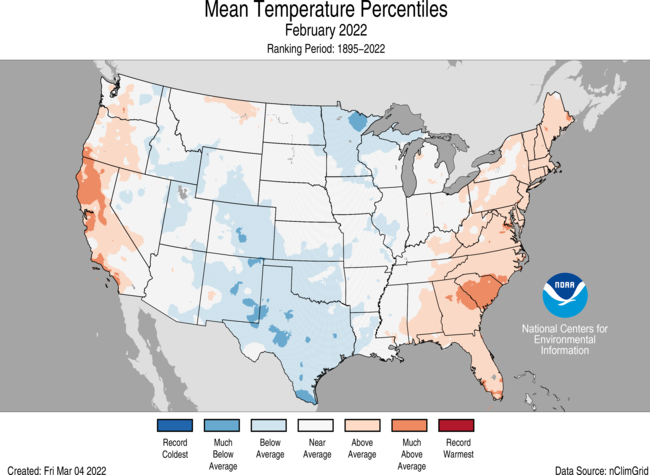
February 2022 was near average, temperature wise, using 1901-2000 mean data and got ranked by the National Center for Environmental Information as warmest for the lower 48 states, or 66th coldest and 63rd warmest since records began being kept in 1895:
https://www.ncdc.noaa.gov/cag/national/rankings
This map holds few surprises. Above average temperatures were experienced in the far West and East with below average conditions across portions of the central U.S. area:

Brief summary for February 2022: Most reports of record warmth came from the South and West during the beginning and end of the month. Most of the reports of record chill came from the Midwest and Plains and were in association with an Arctic outbreak during the middle of the month, which I dubbed Höðr, who is a Norse god of winter. February 2022 broke an 8 month streak of months with more DHMX than DLMN records across the United States.
Here are my two U.S. Daily Record Scoreboards updated through 3/01/2022 (data compiled from the following NCEI site):
https://www.ncdc.noaa.gov/cdo-web/datatools/records


DHMX= Daily High Max Reports. DLMN= Daily Low Min Reports. DHMN= Daily High Min Reports. DLMX=Daily Low Max Reports.
For these data sets all monthly ratios of > 10 to 1 DHMX to DLMN or > 10 to 1 DLMN to DHMX are in bold type. The rankings are for the lower 48 states with the warmest ranking since 1895 of average temperatures being 128 and 1 being the coldest as of 2022. Blue colors represent cold months and red warm. Those months and years with counts close to a 1 to 1 ratio of highs to lows are colored black. Boldly colored months, such as December 2021, have ratios of more than 10 to 1 daily record highs to lows or lows to highs, and are either historically hot or cold, most of which have made news.
February 2022 had approximately a 3 to 4 ratio of record DHMX to DLMN individual record counts, so the color I used for this month was blue on the top chart.
February 2022 had approximately a 1 to 2 ratio of record DHMN to DLMX individual record counts, so the color I used for this month was blue on the bottom chart.
Due to climate change, we are seeing fewer blue colors on these Record Scoreboards with time, but February 2022 bucked this trend.
As stated, the ranking for February 2022 was 66, which was colored black. I color rankings of +10 or -10 from the average ranking of 64 black, indicating that these are near average temperature wise. The top warmest ranking for 2022 would be 128 since rankings began in 1895. Record statistics were a bit on the cold side compared with the ranking of 66 for February 2022. This is probably due to the cold, below average temperature regime that set up over the Midwest during the middle of the month that I dubbed Höðr, which produced many cold records.
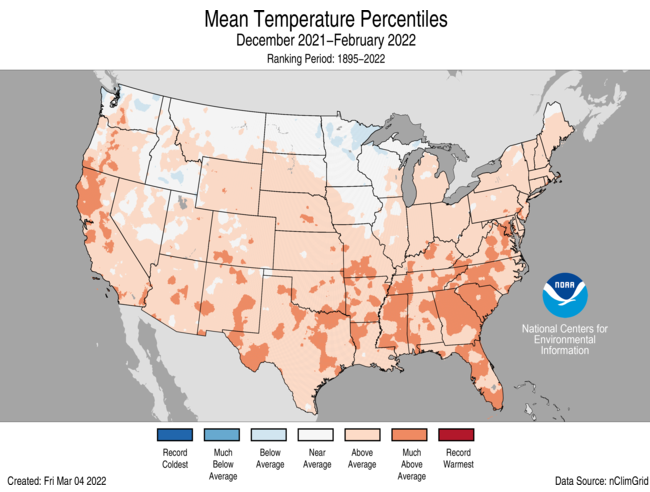
As far as the winter of 2021/22 goes, it was the 18th warmest winter or 110th coldest winter in recorded history for the United States. December 2021 was by far the warmest December on record, but two average winter months in January and February kept the Winter of 2021/22 out of a top ten warmest ranking.
As shown on both record scoreboard charts, we can see that March 2022 has gotten off to a warm start. I expect March 2022 to be above average, as a whole, but the month probably won’t be in the top ten rankings looking at meteorological models.
Here is much more detailed climatology for February 2022 as complied by NOAA:
https://www.ncei.noaa.gov/news/national-climate-202202
Assessing the U.S. Climate in February 2022
An early-February winter storm impacted much of the contiguous U.S.; drought conditions across the western U.S. exacerbated by dry winter

PUBLISHED
MARCH 8, 2022
Related Links:
February U.S. Climate Report (Available March 11, 2022)
National Temperature and Precipitation Maps
Climatological Rankings Explained
State of the Climate Summaries
During February, the average contiguous U.S. temperature was 33.8°F, 0.1°F below the 20th-century average, ranking in the middle third of the 128-year period of record. The winter (December-February) average contiguous U.S. temperature was 34.8°F, 2.5°F above average, ranking in the warmest third of the winter record.
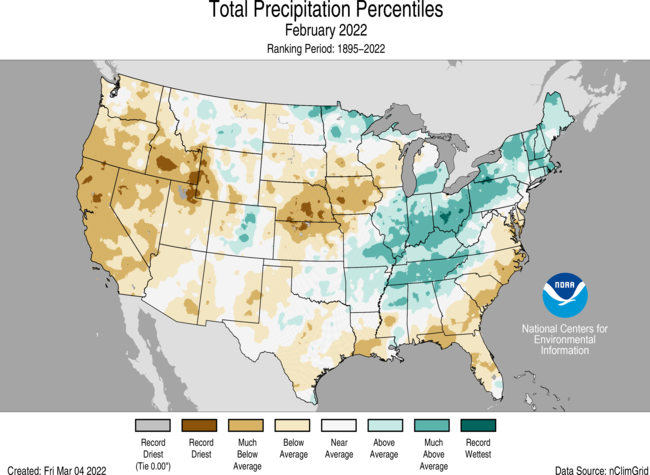
The February precipitation total for the contiguous U.S. was 1.73 inches, 0.40 inch below average, and ranked in the driest third of the historical period of record. The winter precipitation total was 5.76 inches, 1.03 inches below average, and ranked as the 12th-driest winter in the 127-year period of record.
A massive winter storm stretched from Texas to Maine during the first week of February and brought heavy snow, freezing rain, ice and bitter cold temperatures to much of the eastern two-thirds of the Lower 48. Power outages across many states were the result of fallen power lines and trees. Thousands of flights were canceled amid treacherous travel conditions. More than a foot of snow fell across parts of the Northeast.

This monthly summary from NOAA National Centers for Environmental Information is part of the suite of climate services NOAA provides to government, business, academia and the public to support informed decision-making.
February
Temperature

- Temperatures were below average across portions of the northern Plains and western Great Lakes as well as from the central Rockies to the Gulf Coast. Temperatures were above average across portions of the West Coast and from the Southeast to New England.
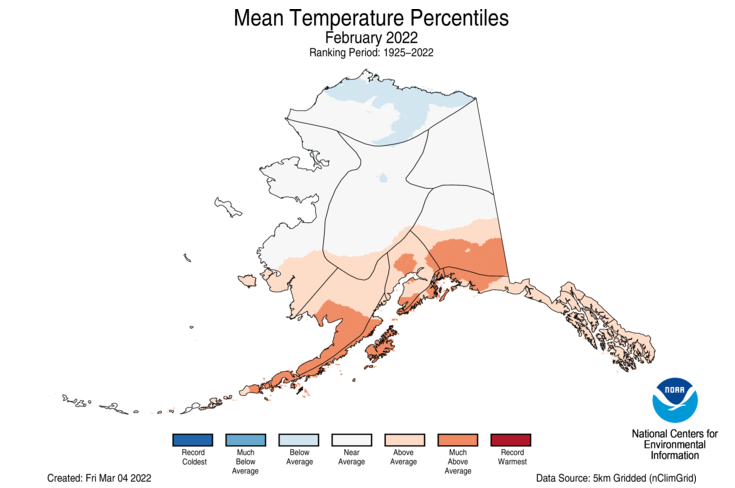
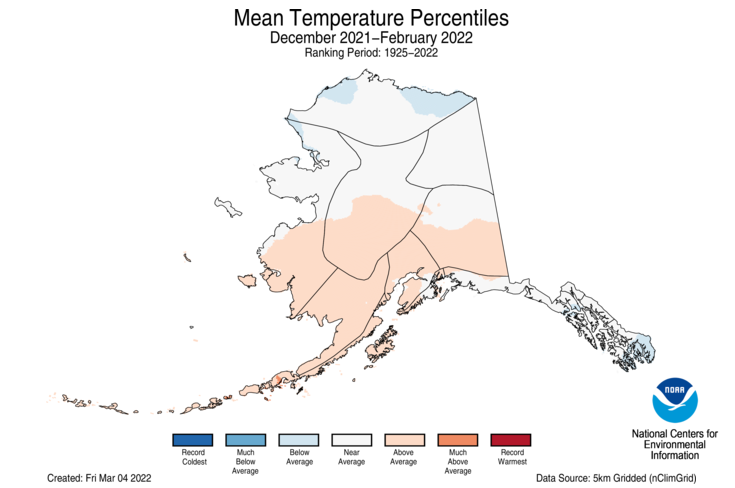
- The Alaska statewide February temperature was 8.6°F, 3.8°F above the long-term average. This ranked among the middle one-third of the 98-year period of record for the state.
- Temperatures were below average across parts of the North Slope while above-average temperatures were observed across the southern third of the state. King Salmon ranked fifth-warmest while Anchorage and Kodiak had their sixth-warmest February on record.
- Bering Sea ice extent in February was the highest value observed since 2013, but fell rapidly the last 10 days of the month and was slightly below the 1991-2020 median by March 2.
Precipitation

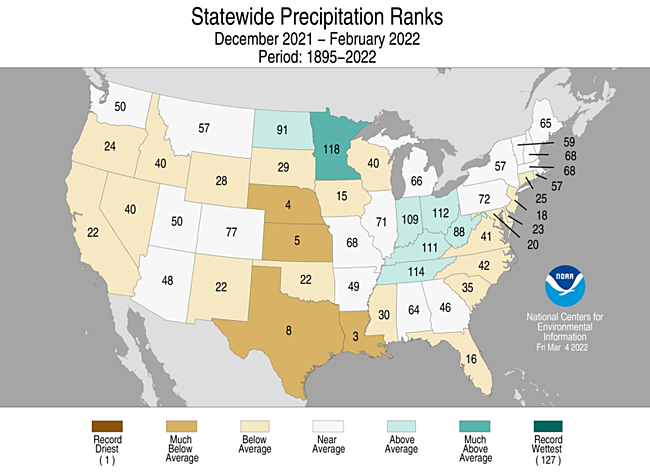
- Precipitation was above average from the Mid-Mississippi Valley to New England. Ohio had its sixth-wettest February. Precipitation was below average across most of the West and portions of the Plains, Southeast and Mid-Atlantic. California and Nebraska each had their second-driest February with Nevada ranking third driest.
- The state of Alaska, as a whole, ranked as the wettest February in the 98-year record. Juneau had its wettest February following its wettest January on record. King Salmon also experienced its wettest February on record, while Anchorage ranked second-wettest. Snowpack was above normal across most of the state.
- According to the March 1 U.S. Drought Monitor report, 59.2 percent of the contiguous U.S. was in drought, up nearly 4 percent from the beginning of February. Drought conditions expanded or intensified across portions of the northern and central Plains, as well as across parts of the West, Midwest, Great Lakes and from Florida to the Carolina coast. Drought contracted on the Big Island of Hawaii, but expanded across the islands of Kauai and O’ahu. Drought severity lessened across portions of the southern Plains and across Puerto Rico.
Winter (December-February)
Temperature

- Winter temperatures were above average across much of the Lower 48 with Georgia and South Carolina experiencing their seventh-warmest winter on record. Temperatures ranked near average from the Pacific Northwest to the western Great Lakes with no states ranking below average for the winter season.
- The Alaska December-February temperature was 6.3°F, 2.7°F above the long-term average, ranking among the middle one-third of the 97-year record. Above-average temperatures were observed across the Aleutians, Bristol Bay, Cook Inlet and the southern half of the West Coast, Central Interior and Southeast Interior regions. Temperatures were below average across portions of the North Slope and the southern Panhandle.
Precipitation

- Precipitation was above average across parts of the Upper Mississippi, Ohio, and Tennessee valleys. Minnesota had its 10th-wettest winter. Precipitation was below average across portions of the West, central and southern Plains, Gulf Coast and across parts of the Southeast and Mid-Atlantic. Louisiana had its third-driest winter on record with Nebraska ranking fourth driest and Kansas, fifth driest.
- Climatologically speaking, winter is the wet season across much of the western U.S. If the dry conditions experienced in January and February across portions of the West were to continue into March and April, insufficient water resources may result during the dry season (summer), as well as an increased potential for drought intensification and wildfires in the fall.
- Five regions in Alaska — Bristol Bay, West Coast, North Slope, Northeast Interior and Southeast Interior — ranked wettest on record for the winter season, contributing to a record-wet winter for the state of Alaska, eclipsing the previous record set in 1928-29. Nome experienced its wettest winter since 1943-44, and King Salmon had its wettest winter on record.
For more detailed climate information, check out our comprehensive February 2022 U.S. Climate report scheduled for release on March 11, 2022.
Here are some “ET’s” from Monday and Tuesday:
Here is some more climatology from February 2022:
Here is more climate and weather news from Tuesday:
(As usual, this will be a fluid post in which more information gets added during the day as it crosses my radar, crediting all who have put it on-line. Items will be archived on this site for posterity. In most instances click on the pictures of each tweet to see each article. The most noteworthy items will be listed first.)
Now here are some of today’s articles and notes on the horrid Ukranian War:
(If you like these posts and my work please contribute via the PayPal widget, which has recently been added to this site. Thanks in advance for any support.)
Guy Walton “The Climate Guy”