The main purpose of this ongoing blog will be to track planetary extreme, or record temperatures related to climate change. Any reports I see of ETs will be listed below the main topic of the day. I’ll refer to extreme or record temperatures as ETs (not extraterrestrials).😉
Main Topic: May Record Scoreboard and Climatological Review
It’s time once again for our monthly climatological review. Here on this site, we present monthly summaries near the 8th of each month, and each is available if you want to go back through my Extreme Temperature Diary archive under my “Record Scoreboard Climatological Reviews” category (located on the upper left-hand corner of my home page):
https://guyonclimate.com/category/record-scoreboard-climatological-reviews/
I’m repeating my mantra from prior months:
May 2022 was well above average, temperature wise, using 1901-2000 mean data and got ranked by the National Center for Environmental Information as 107th warmest for the lower 48 states, or 22nd coolest since records began being kept in 1895:
https://www.ncdc.noaa.gov/cag/national/rankings
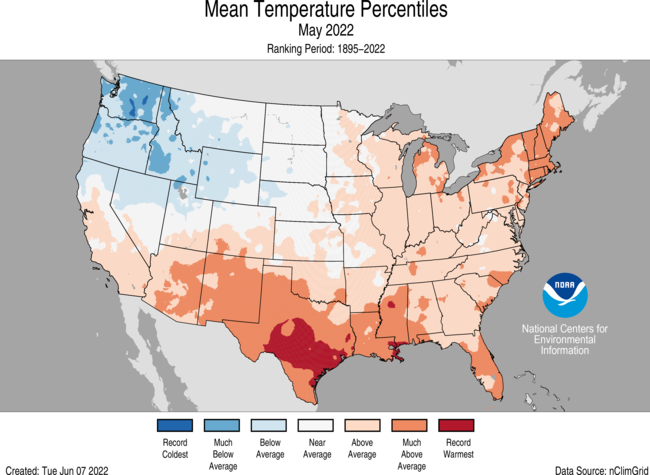
Above average temperatures were experienced in the South and Northeast with below average conditions across the Pacific Northwest. Texas had its second warmest May on record:
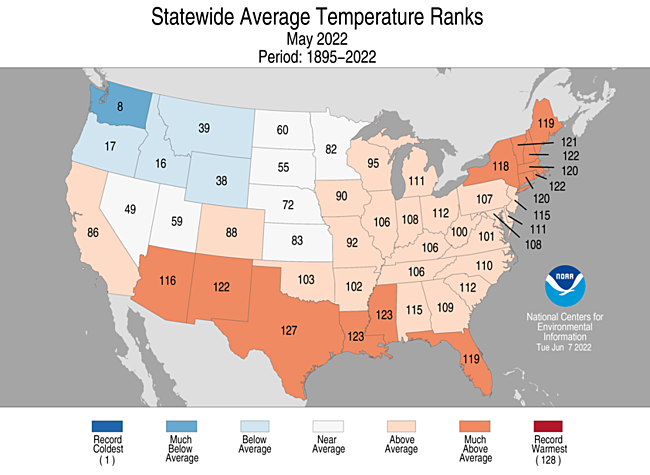
Brief summary for May 2022: Most reports of record warmth came from the Southern and Northeastern U.S. during the month. Most of the reports of record chill came from the Pacific Northwest.
Here are my two U.S. Daily Record Scoreboards updated through 6/08/2022 (data compiled from the following NCEI site):
https://www.ncdc.noaa.gov/cdo-web/datatools/records
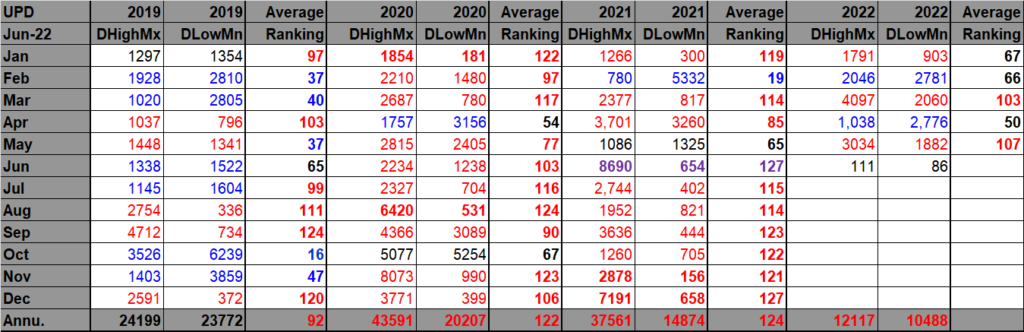
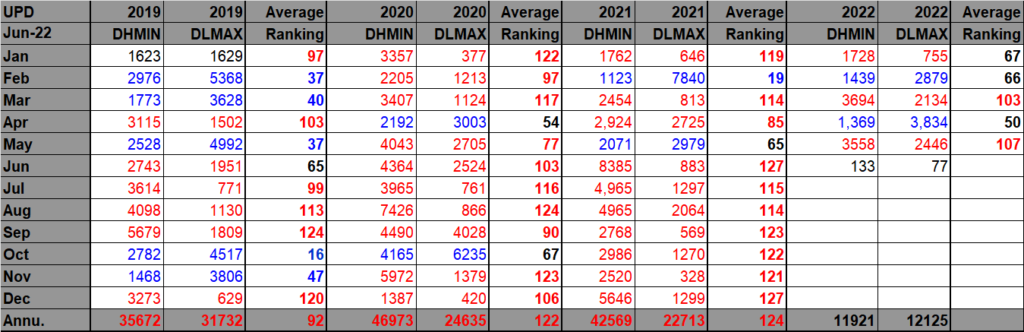
DHMX= Daily High Max Reports. DLMN= Daily Low Min Reports. DHMN= Daily High Min Reports. DLMX=Daily Low Max Reports.
For these data sets all monthly ratios of > 10 to 1 DHMX to DLMN or > 10 to 1 DLMN to DHMX are in bold type. The rankings are for the lower 48 states with the warmest ranking since 1895 of average temperatures being 128 and 1 being the coldest as of 2022. Blue colors represent cold months and red warm. Those months and years with counts close to a 1 to 1 ratio of highs to lows are colored black. Boldly colored months, such as December 2021, have ratios of more than 10 to 1 daily record highs to lows or lows to highs, and are either historically hot or cold, most of which have made news.
May 2022 had approximately a 3 to 2 ratio of record DHMX to DLMN individual record counts, so the color I used for this month was red on the top chart.
May 2022 had approximately a 7 to 5 ratio of record DHMN to DLMX individual record counts, so the color I used for this month was red on the bottom chart.
Due to climate change, we are seeing fewer blue colors on these Record Scoreboards with time, and May 2022 fit this trend.
As stated, the ranking for May 2022 was 107, which was colored red since it was well above average. I color rankings of +20 or -20 from the average ranking of 64 black, indicating that these are near average temperature wise. The top warmest ranking for 2022 would be 128 since rankings began in 1895.
June 2022 has gotten off to a hot start across the Southwest and south-central states, the same area that was anomalously warm in May. It looks like there will be a significant, if not historic heat wave, occurring across the southern and mid part of the country during June. June is likely to be well above average, as well, and could even be among the top ten warmest Junes in history.
Here is much more detailed climatology for May 2022 as complied by NOAA:
Assessing the U.S. Climate in May 2022
Drought conditions improve for some yet remain for much of the West

Courtesy of Getty Images
Key Points:
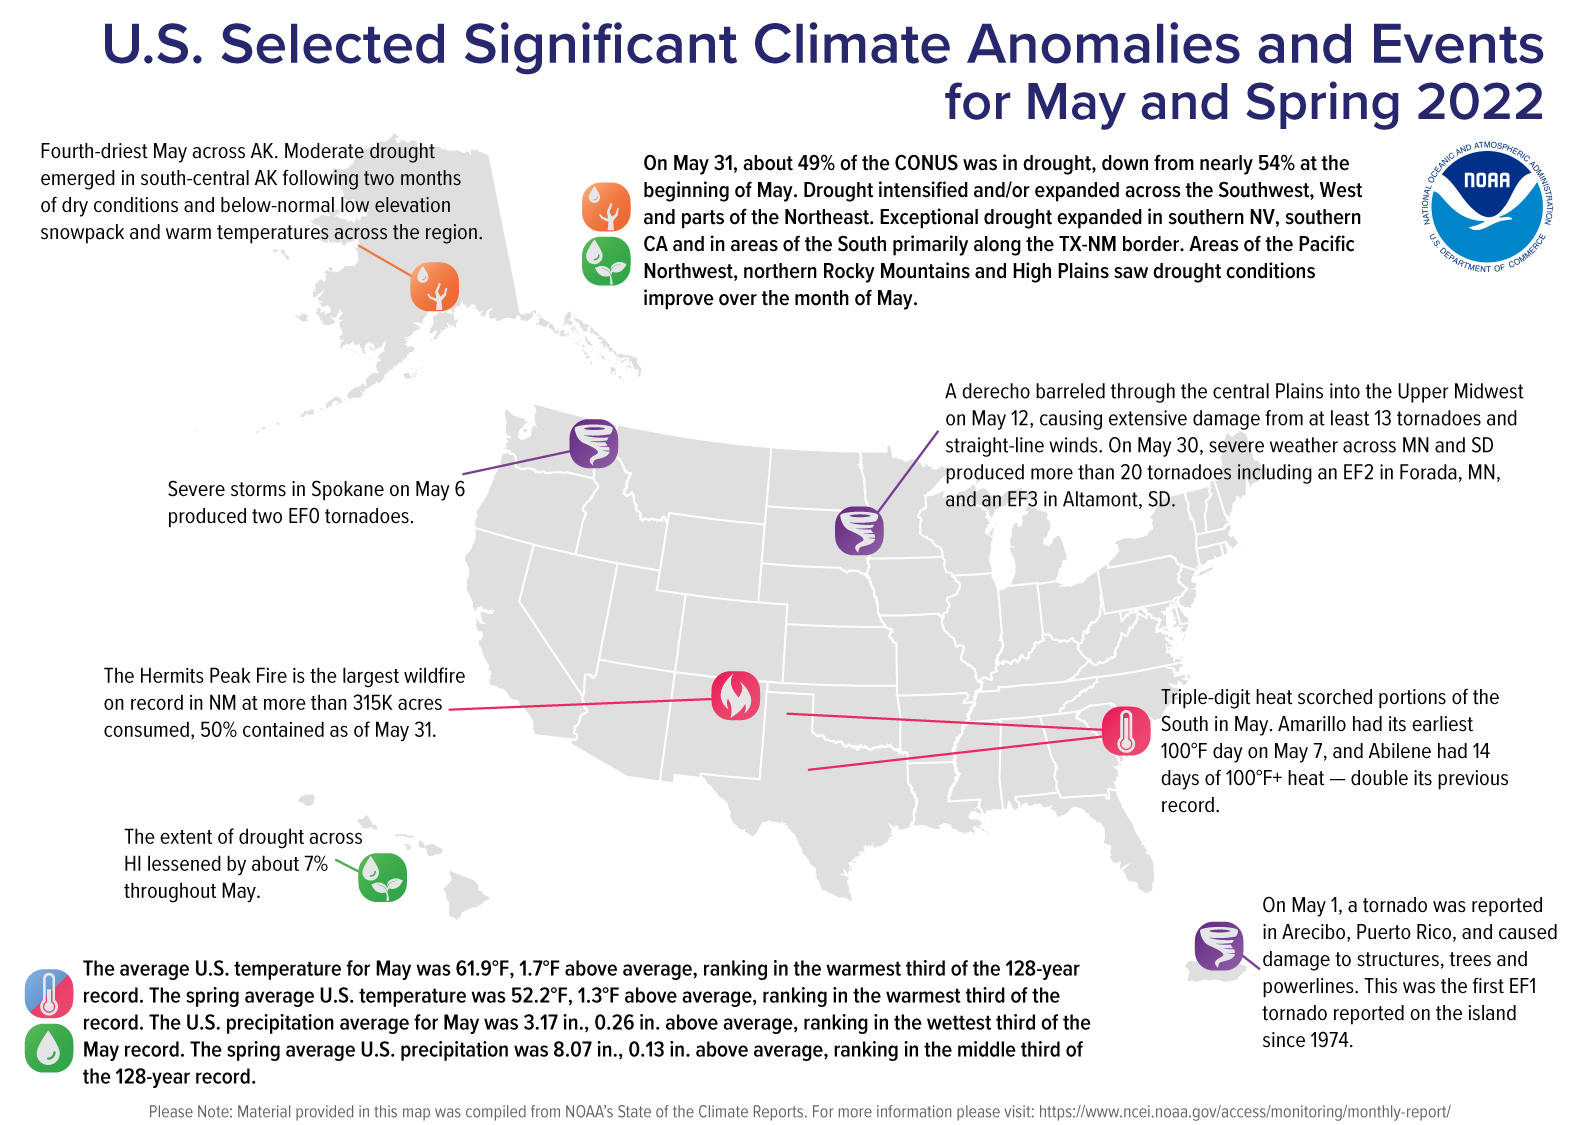
- The average temperature of the contiguous U.S. in May was 61.9°F, which is 1.7°F above average, ranking in the warmest third of the 128-year record. Temperatures across the Northwest and northern Rockies were below average, with much of the Southwest, Deep South and locations east of the Mississippi River above average. Triple-digit heat scorched portions of the South throughout the month, setting a number of temperature records across Texas.
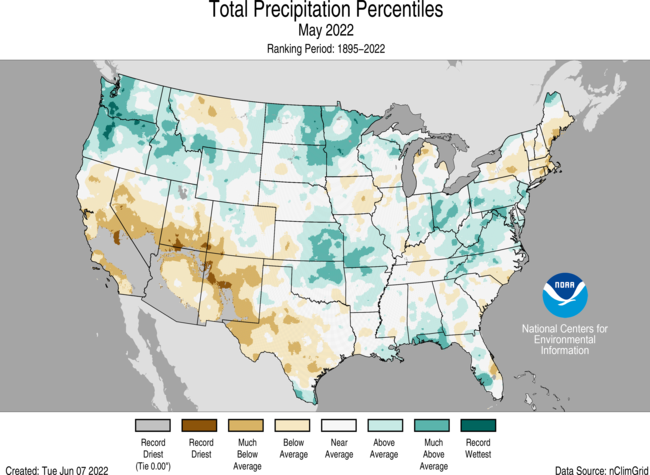
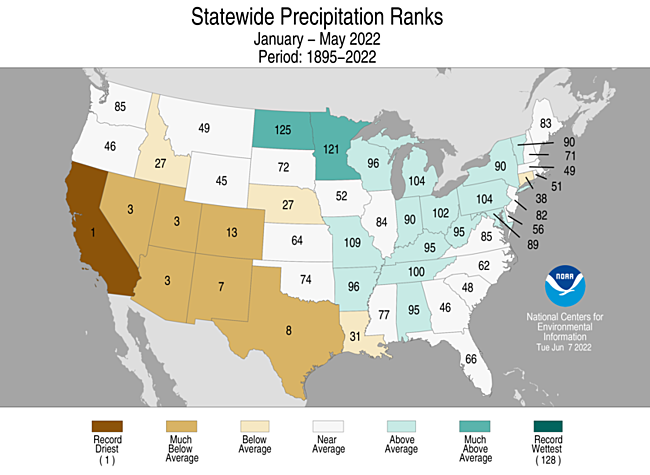
- May precipitation for the contiguous U.S. was 3.17 inches, 0.26 inch above average, ranking in the wettest third of the historical record. Precipitation was above average across portions of the Northwest, northern and central Plains, Upper Mississippi Valley, Ohio Valley, eastern Gulf of Mexico coast and the Appalachians. Precipitation was below average from California to Texas and across portions of the Northeast. California experienced its driest January-May on record.
- As of May 31, the largest fire on record in New Mexico, the Hermits Peak Fire, had consumed more than 315,000 acres and was 50 percent contained. Across all 50 states, 1.9 million acres have burned from January 1 through June 2 — more than two times the average for this time of year.
- Several severe weather events occurred across the U.S. during May, producing 196 preliminary tornado reports. This is 71 percent of the 1991-2010 average of 276 tornadoes for the month of May.
- According to the May 31 U.S. Drought Monitor report, 49.3 percent of the contiguous U.S. was in drought. Severe to extreme drought remains widespread across the western half of the contiguous U.S.
Other Highlights:
Temperature

For May, a persistent trough of low pressure over the Pacific Northwest contributed to Washington state ranking eighth coldest on record while the downstream ridge brought unseasonable warmth to the Deep South, resulting in Texas ranking second warmest.
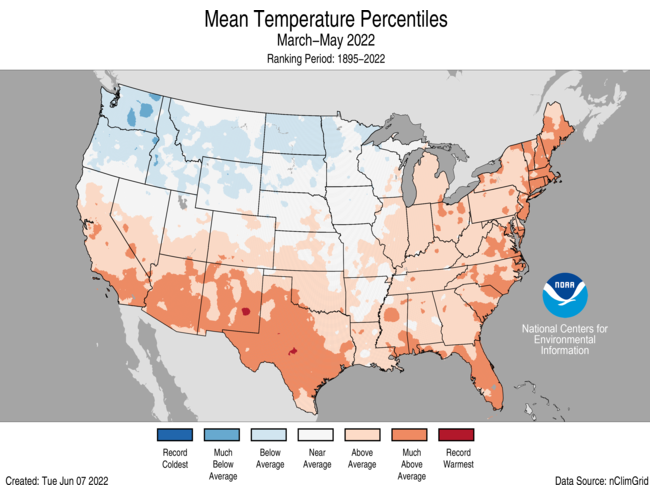
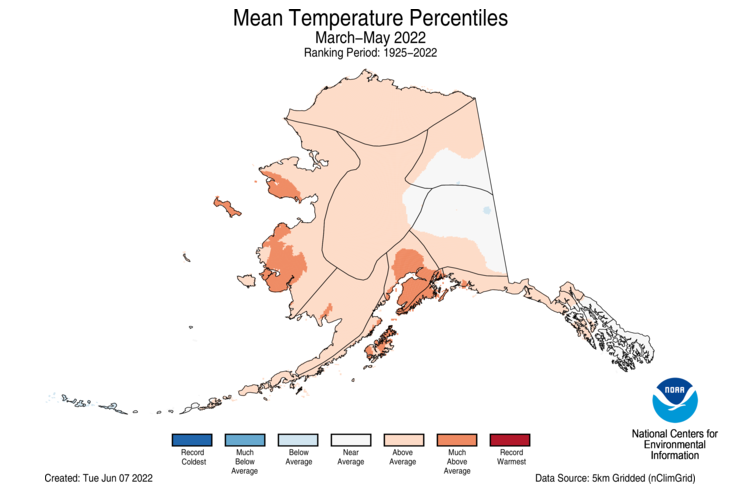
The meteorological spring (March-May) average temperature for the Lower 48 was 52.2°F, 1.3°F above average, ranking in the warmest third of the record. Temperatures were above average from California to the Deep South and, in general, from the Mississippi River to the East Coast. Temperatures were below average from the Pacific Northwest to the Upper Midwest. Rhode Island ranked fourth warmest while nine additional states across the Northeast, Southeast and Southern Tier ranked among their warmest 10 spring seasons on record.
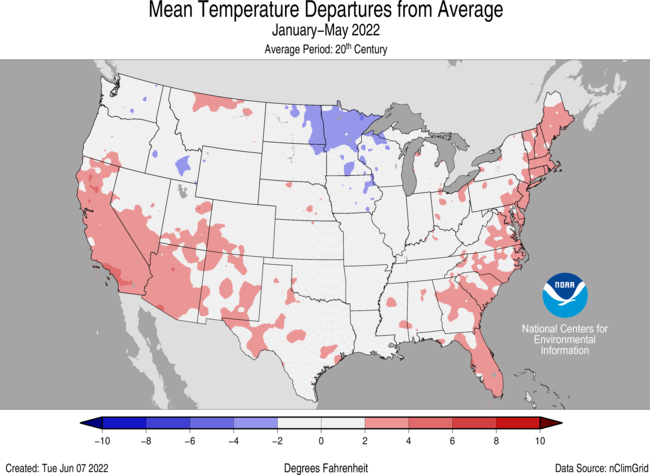
Averaged over the first five months of the year, the contiguous U.S. temperature was 44.3°F, 1.0°F above the 20th-century average, ranking in the warmest third of the January-May record. Temperatures were above average from California to Texas and from the central Gulf Coast to New England. California ranked eighth warmest on record for this period. Temperatures were below average in parts of the Northwest and from the northern Plains to parts of the Midwest.
The Alaska statewide May temperature was 39.9°F, 2.1°F above the long-term average. This ranked among the warmest one-third of the 98-year period of record for the state. Temperatures were above average across much of southern mainland Alaska as well as the northern Panhandle and parts of the North Slope. Temperatures were near average across much of the rest of the state.
The Alaska spring temperature was 27.3°F, 3.3°F above the long-term average, ranking in the warmest third of the record for the state. Temperatures were above average across most of the state with the eastern Interior regions and parts of the Panhandle region near average for the season.
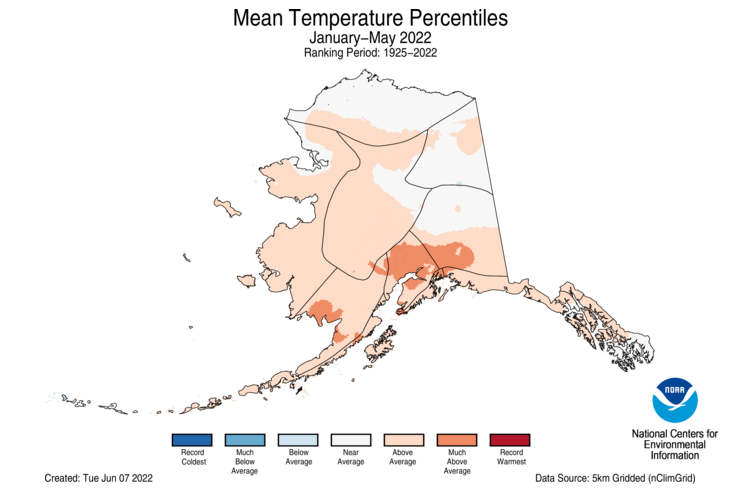
The year-to-date temperature for Alaska was 18.8°F, 3.0°F above the long-term average, ranking in the warmest third of the record for the state. Above-average temperatures were observed across most of the southern half of the state, as well as much of the West Coast.
Precipitation

A ridge of high pressure suppressed precipitation across the Southwest in May and resulted in Arizona ranking fifth driest for the month. Conversely, the Pacific Northwest received above average precipitation, and Washington ranked eighth wettest.
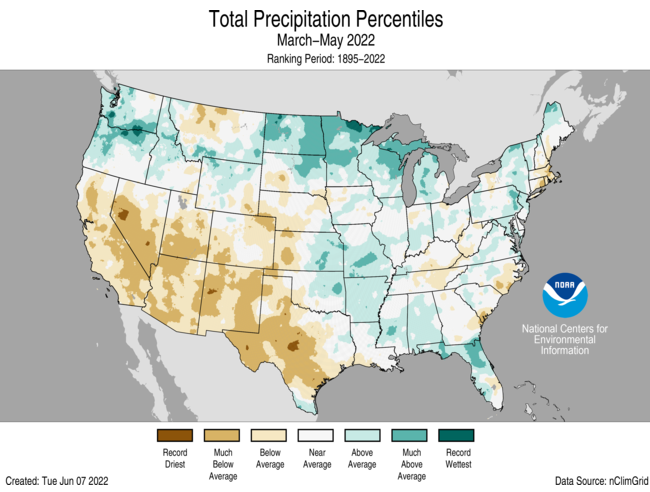
The U.S. spring precipitation total was 8.07 inches, 0.13 inch above average, ranking in the middle third of the March-May record. Precipitation was above average across parts of the Northwest, northern Plains, Great Lakes, central Plains, along portions of the central and eastern Gulf Coast and across parts of the Northeast for the season. Precipitation during March-May was below average from California to the High Plains and western Gulf Coast. North Dakota ranked fourth wettest while New Mexico ranked sixth driest for the spring season.
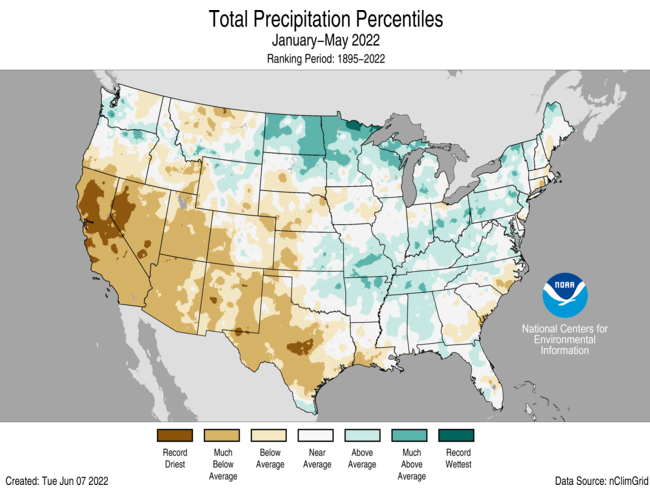
The January-May precipitation total for the contiguous U.S. was 11.48 inches, 0.91 inch below average, ranking in the driest third of the record. Precipitation was above average from the northern Plains to the Great Lakes and from the mid-Mississippi Valley to the Northeast. Precipitation was below average across much of the West and Deep South, as well as portions of the central Plains during the January-May period. California ranked driest on record while Nevada, Utah and Arizona ranked third driest for this five-month period. North Dakota ranked fourth wettest for January-May.
Integrated across the state, precipitation across Alaska ranked fourth driest for May. Precipitation was above average across parts of the North Slope and eastern interior regions, but was generally very dry across much of the state throughout the month.
For the spring season, precipitation ranked 12th driest across Alaska although wetter-than-average conditions were observed across the Southeast Interior division. Precipitation was below average across much of the remainder of the state.
Despite the dry May and Spring season across Alaska, precipitation averaged across the state for the January-May period ranked in the wettest third of the record and was generally above average across much of southeastern Alaska and near or below average for much of the rest of the state. Record precipitation received in early 2022 contributed to the Southeast Interior division ranking wettest on record for the January-May period.
Other Notable Weather
Severe storms formed across the central Plains on May 4, producing several tornadoes including an EF3 near Lockett, TX. A line of severe storms, also known as a derecho, barreled across the central Plains into the Upper Midwest on May 12, causing extensive damage from at least 13 tornadoes and straight-line winds. The Upper Midwest was again impacted by severe weather over Memorial Day weekend, where more than 20 tornadoes were reported, including an EF2 in Forada, MN, and an EF3 in Altamont, SD.
Drought
According to the May 31 U.S. Drought Monitor report, 49.3 percent of the contiguous U.S. was in drought, down about 4.5 percentage points from the beginning of May. Drought intensified and/or expanded across the Southwest, West and parts of the Northeast. Exceptional drought expanded in southern Nevada, southern California, and in areas of the South, primarily along the Texas-New Mexico border. Areas of the Pacific Northwest, northern Rocky Mountains and High Plains saw drought conditions improve over the month of May. Moderate drought was introduced to portions of south-central Alaska, drought expanded across Puerto Rico and the extent of drought across Hawaii lessened during May.
This monthly summary from NOAA’s National Centers for Environmental Information is part of the suite of climate services NOAA provides to government, business, academia and the public to support informed decision-making. For more detailed climate information, check out our comprehensive May 2022 U.S. Climate Report scheduled for release on June 13, 2022.
Here are some “ET’s” recorded from around the planet the last couple of days, their consequences, and some extreme temperature outlooks:
Here is more May 2022 climatology:
Here is more climate and weather news from Wednesday:
(As usual, this will be a fluid post in which more information gets added during the day as it crosses my radar, crediting all who have put it on-line. Items will be archived on this site for posterity. In most instances click on the pictures of each tweet to see each article. The most noteworthy items will be listed first.)
(If you like these posts and my work please contribute via this site’s PayPal widget. Thanks in advance for any support.)
Guy Walton “The Climate Guy”