The main purpose of this ongoing blog will be to track planetary extreme, or record temperatures related to climate change. Any reports I see of ETs will be listed below the main topic of the day. I’ll refer to extreme or record temperatures as ETs (not extraterrestrials).😉
Main Topic: U.S. August Record Scoreboard and Climatological Review
Dear Diary. It’s time once again for our monthly climatological review. Here on this site, we present monthly summaries near the 8th of each month, and each is available if you want to go back through my Extreme Temperature Diary archive under my “Record Scoreboard Climatological Reviews” category (located on the upper left-hand corner of my home page).
https://guyonclimate.com/category/record-scoreboard-climatological-reviews/
I’m repeating this mantra every month:
Dur to carbon pollution, indeed the Summer of 2022 was very toasty across most of the United States. Will Fall 2022 be just as anomalously hot? It’s certainly starting out that way mainly due to historic western Heatwave Falkor.
August 2022 was using 1901-2000 mean data and got ranked by the National Center for Environmental Information for the lower 48 states as 8th warmest or 121st coolest since records began being kept in 1895 (and indeed as previously expected suspected weeks ago, coming in as a top 10 warmest August). Summer 2022 was the third warmest summer. Incidentally, Europe had an even tougher time with heat, having the hottest summer on record there:
https://www.ncdc.noaa.gov/cag/national/rankings
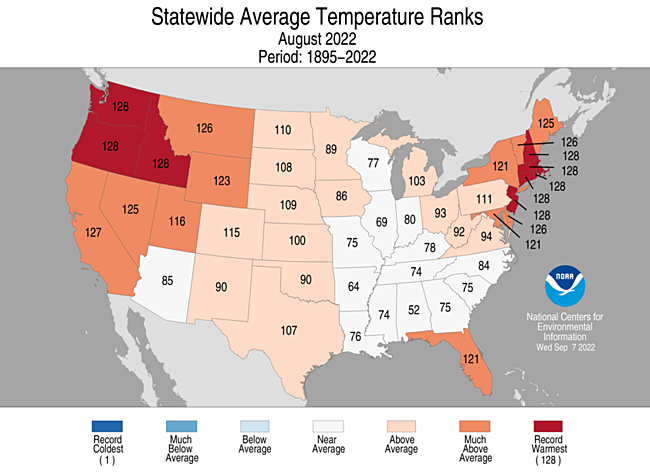
Above average temperatures were experienced everywhere except in the Southeast, portions of the Midwest, and in New Mexico. There were no below average states. Several states had their hottest August on record in the Pacific Northwest and Northeast:
During the summer, as a whole, only Wisconsin saw near average temperatures:

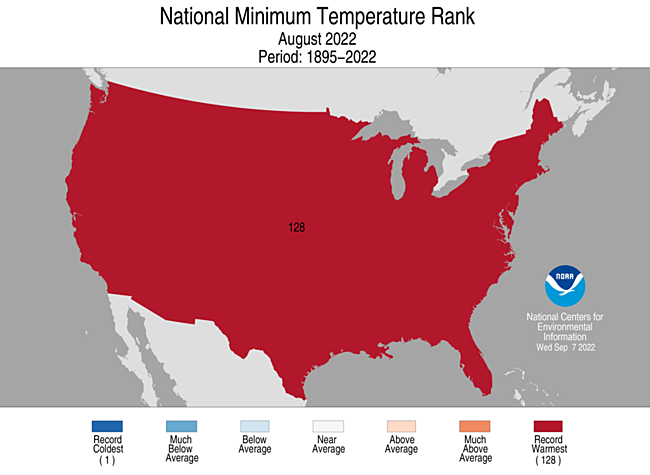
The trend of nights warming faster than days held during the Summer of 2022. Nights averaged warmest on record:
Brief summary for August 2022: Most reports of record heat came from the West concurrent with a historic drought. Sporadic reports of record chill came from every corner of the nation.
Here are my two U.S. Daily Record Scoreboards updated through 9/05/2022 (data compiled from the following NCEI site):
https://www.ncdc.noaa.gov/cdo-web/datatools/records

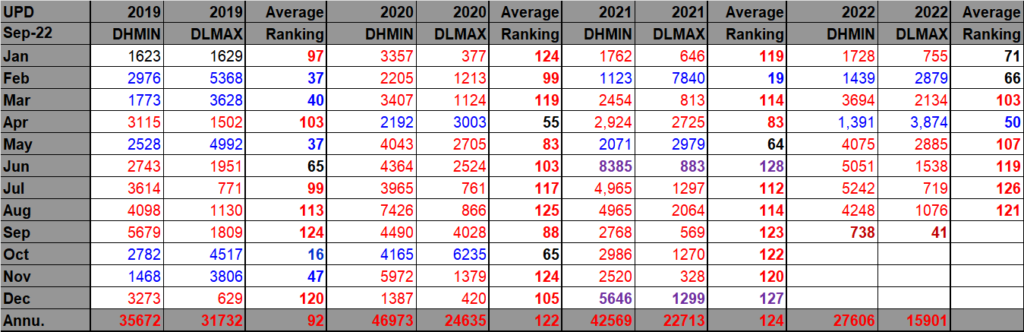
DHMX= Daily High Max Reports. DLMN= Daily Low Min Reports. DHMN= Daily High Min Reports. DLMX=Daily Low Max Reports.
The rankings are for the lower 48 states with the warmest ranking since 1895 of average temperatures being 128 and 1 being the coldest as of 2021. Blue colors represent cold months and red warm. Those months and years with counts close to a 1 to 1 ratio of highs to lows are colored black. Boldly red-, blue-, or purple-colored months, such as January 2020 and June 2021, have ratios of >10 to 1 daily record highs to lows or <1 to 10 daily record highs to lows, and are either historically hot or cold, most of which have made news. New: All-time record hot or cold ranked months are highlighted in purple.
Record numbers statistically matched up well during August of 2022 with that month being the 8th warmest August on record.
August 2022 had approximately a 10 to 1 ratio of record DHMX to DLMN individual record counts, so the color I used for this month was bold red on the top chart.
August 2022 had approximately a 4 to 1 ratio of record DHMN to DLMX individual record counts, so the color I used for this month was red on the bottom chart.
Due to climate change, we are seeing fewer blue colors on these Record Scoreboards with time, and August 2022 added to this trend.
As stated, the ranking for August 2022 was 121, which was colored red since it was well above average. I color rankings of +20 or -20 from the average ranking of 64 black, indicating that these are near average temperature wise. The top warmest ranking for 2022 would be 128 since rankings began in 1895.
September 2022 has gotten off to a very hot start across the West due to historic Heatwave Falkor. Most know who read my blog that I’ve been naming significant heatwaves for fire breathing dragons this year. *We could see three consecutive months (July to September 2022) of a > 10 to 1 ratio of DHMX to DLMN records for the first time since January 1890 in the NCEI database looking at meteorological trends. Time will tell.*
Here is much more detailed climatology for August 2022 as complied by NOAA:
https://www.ncei.noaa.gov/news/national-climate-202208
Assessing the U.S. Climate in August 2022
Third-Warmest Summer on Record for the Lower 48
PUBLISHED
SEPTEMBER 9, 2022
Key Points:

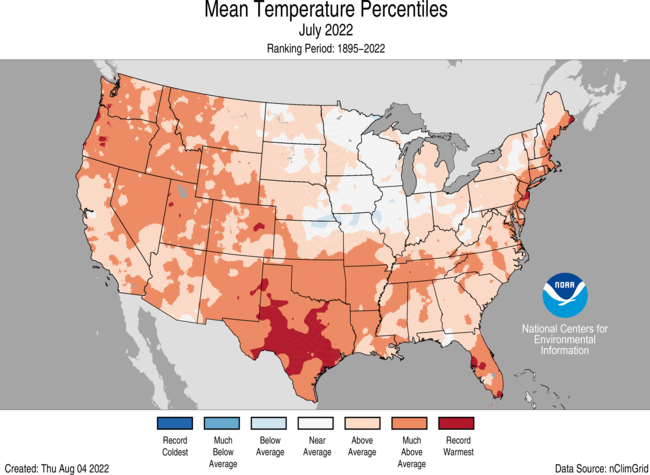
- The average temperature of the contiguous U.S. in July was 76.4°F, which is 2.8°F above average, ranking third warmest in the 128-year record. Generally, temperatures were above average and/or record-warm across nearly all of the Lower 48, with Texas having its warmest July, May-July and April-July on record.
- July precipitation for the contiguous U.S. was 2.74 inches, 0.04 inch below average, ranking in the middle third of the historical record. Precipitation was above average in pockets across the West Coast, Southwest, Northern Rockies and Plains, Great Lakes and from parts of the Midwest to southern Appalachians. Precipitation was below average across portions of the Northwest, southern Plains, Upper Midwest and Northeast.
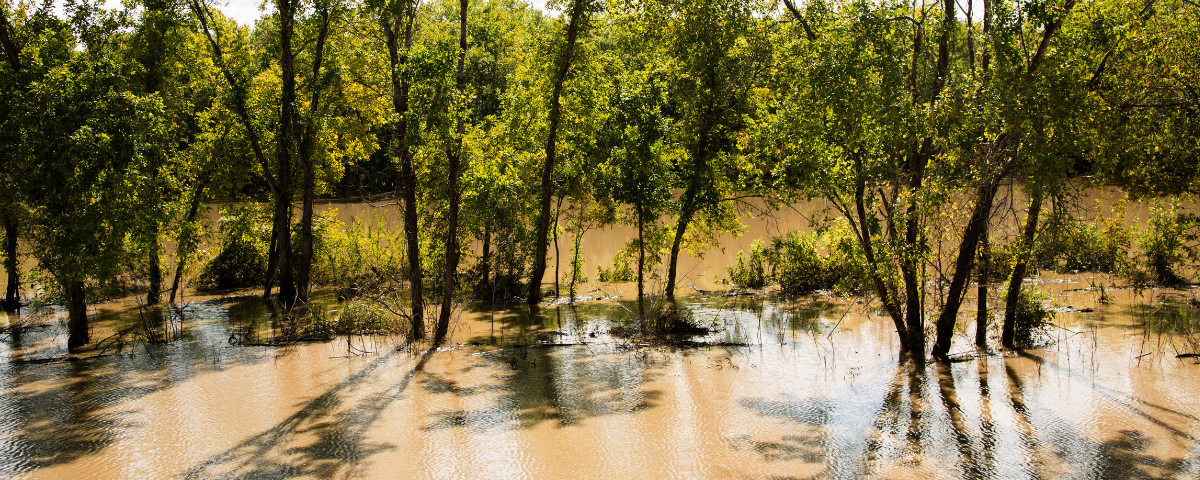
- A stalled frontal system, combined with rich Gulf moisture, resulted in historic flash-flooding events across portions of Missouri and Kentucky on July 26 and 28, respectively.
- Several heat waves, with daytime temperatures over 100°F, occurred across much of the U.S. during July, contributing to record energy demand and heat-related illnesses.
- The wildfire season appears to be waning across Alaska, but is still going strong across the West and southern Plains. Across all 50 states, more than 5.7 million acres burned from January 1 through July 31 — nearly 1.5 times the average for this time of year.
- According to the August 2 U.S. Drought Monitor report, 51.4 percent of the contiguous U.S. was in drought. Severe to exceptional drought was widespread from the Great Basin to the Pacific Coast and across portions of the central and southern Plains.
Other Highlights
Temperature

For the month of August, Washington, Oregon, Idaho, New Jersey, Connecticut, Rhode Island, Massachusetts and New Hampshire ranked warmest on record. In addition to this record warmth, near-record temperatures were widespread in the West and other parts of the Northeast. California had its second warmest August, with five additional states experiencing a top-five warmest August on record.
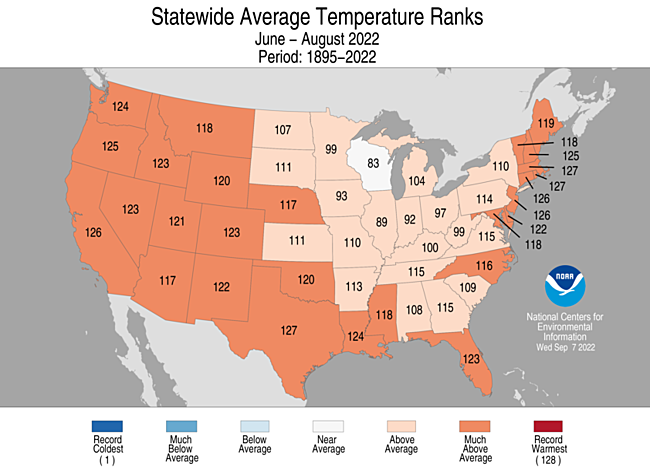
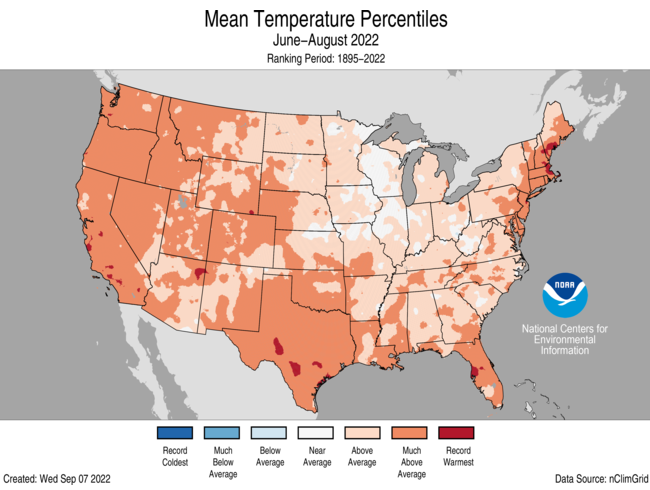
Summer temperatures were above average across most of the contiguous United States. Texas, Massachusetts and Rhode Island ranked second warmest while seventeen additional states across the West, South and Northeast ranked among their warmest 10 summer seasons on record.
For the January-August period, the average contiguous U.S. temperature was 55.4°F, 1.5°F above average, ranking in the warmest third of the record. Temperatures were above average from Oregon to the Gulf Coast and from the Gulf to New England. Florida ranked fourth warmest and California ranked fifth warmest on record for this period. Temperatures were below average across parts of the Upper Midwest.
The Alaska statewide August temperature was 50.1°F, 0.6°F above the long-term average. This ranked among the middle one-third of the 98-year period of record for the state. Temperatures were above average across much of eastern Alaska, Panhandle region, Kodiak Island and portions of the Kenai Peninsula. Temperatures were below average across portions of northwest Alaska.
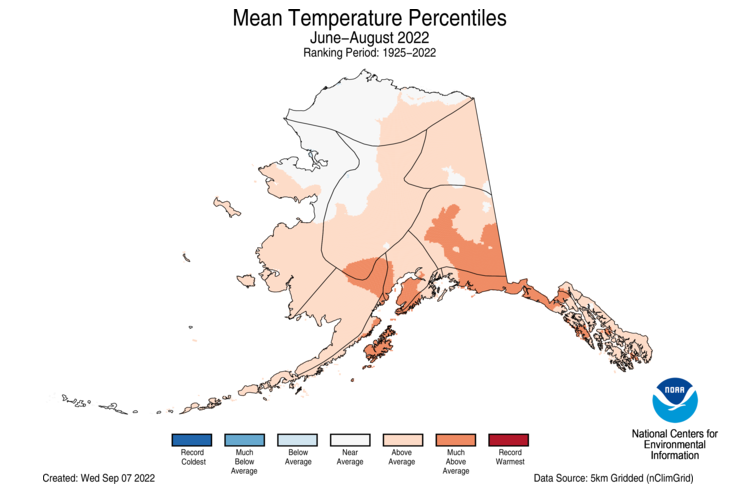
The Alaska summer temperature was 52.1°F, 1.6°F above the long-term average, ranking in the warmest third of the record for the state. Temperatures were above average across most of the state with the Northwest and areas along the Arctic near average for the season.
The Alaska January-August temperature was 31.2°F, 2.5°F above the long-term average, ranking in the warmest third of the record for the state. Above-average temperatures were observed across much of the state with portions of the North Slope, West Coast and eastern interior regions experiencing near-average conditions for this eight-month period.
Precipitation

Record rainfall events during the month of August contributed substantiallyto the record-wet August for Mississippi as well as the third-wettest August for Nevada and Louisiana. Conversely, a lack of precipitation received during the month resulted in Nebraska ranking second driest while Kansas had its seventh-driest August on record.
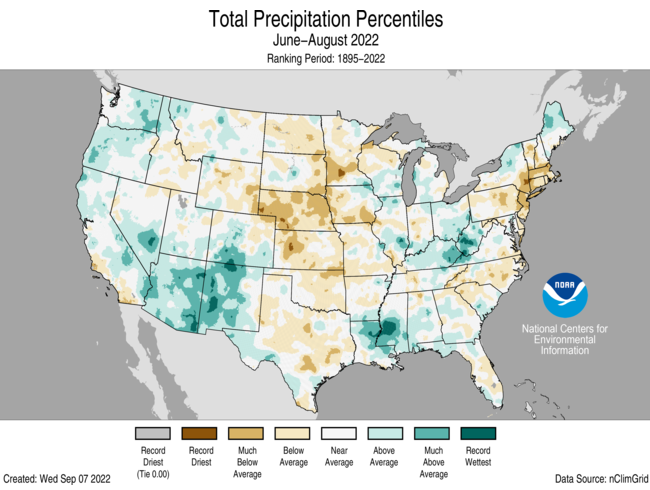
The U.S. summer precipitation total was 8.18 inches, 0.14 inch below average, ranking in the middle third of the June-August record. Precipitation was above average along the West Coast, much of the Southwest, Midwest, lower Mississippi Valley and northern New England for the season. Precipitation during June-August was below average across the Great Plains, southern New England, and other portions of the East Coast. Arizona ranked seventh wettest while Nebraska ranked third driest for the summer season.
The January-August precipitation total for the contiguous U.S. was 19.68 inches, 1.03 inches below average, ranking in the driest third of the historical record. Precipitation was above average across parts of the northern Plains, Midwest, and much of the southern Mississippi, Tennessee and Ohio valleys. Precipitation was below average across much of the West, central and southern Plains and parts of the Northeast during the January-August period. California ranked driest on record while Nebraska ranked fifth driest and Nevada ranked seventh driest for this eight-month period.
Alaska had the 10th-wettest August in the 98-year record. Much of the state was wetter-than-average, with portions of eastern Alaska and lower Panhandle experiencing near-average conditions during the month. Homer recorded its wettest August and Anchorage ranked third-wettest on record.

For the summer season, precipitation ranked in the wettest third of the record for Alaska with wetter-than-average conditions observed in the North Slope, West Coast and southern portions of the state, with parts of the Northeast interior drier than average for the season.
The January-August precipitation ranked 10th-wettest on record for Alaska, with above average precipitation observed across all but the central and northeast Interior and Aleutian regions.
Other Notable Events
Several notable flooding events, considered “1,000-year” rainfall events by the National Weather Service, occurred during the month of August:
- On August 2, parts of southern Illinois were drenched by 8 to 12 inches of rain in a 12-hour period. An area south of Newton, Illinois, recorded 14 inches of rainfall over the same period.
- On August 5, Death Valley National Park received 1.70 inches of rain, an unprecedented amount of rainfall for the area, resulting in substantial flooding and damage, and trapping visitors and staff members. This event broke the previous all-time 24-hour rainfall record of 1.47 inches recorded on April 15, 1988.
- On August 22, parts of Dallas, Texas saw more than 13 inches of rainfall within 12 hours. The governor declared a disaster for 23 Texas counties, including Dallas, after storms caused damage and devastating flash flooding.
On September 1, the Great Salt Lake, the largest saltwater lake in the Americas and eighth largest in the world, recorded its lowest water level since records began in 1847.
August had no storm activity in the North Atlantic basin, with 2022 becoming only the third year, along with 1961 and 1997, since 1950 to have no activity during the month.
Drought
According to the August 30 U.S. Drought Monitor report, about 45.5 percent of the contiguous United States was in drought, down about 5.9 percent from the beginning of August. Drought conditions expanded or intensified across portions of the Northeast, central and northern Plains, Northwest and Hawaii. Drought contracted or was eliminated across portions of the Southwest, southern Plains, central to lower Mississippi Valley, Great Lakes, parts of the Northeast and Puerto Rico. Drought covered 93.95% of the state of Hawaii – the largest extent ever recorded for that state.
Monthly Outlook
According to the August 31 One-Month Outlook from the Climate Prediction Center, much of the West to the Midwest and from the Midwest to the East Coast, as well as southeast Alaska, have the greatest chance of receiving above-normal temperatures in September, whereas the greatest chance for below-normal temperatures is projected to occur across portions of the southern Plains. Portions of the Southwest, Gulf Coast, Southeast and the Panhandle of Alaska are projected to have the greatest chance of above-normal precipitation, while the greatest chance for below-normal precipitation is expected to occur from Northwest to the Great Lakes and into New England. Drought is likely to persist across much of the West, central Plains, and Hawaii with some improvement and/or drought removal likely from the Southwest to the southern Plains, as well as across portions of Puerto Rico. Drought development is likely across small areas of the central and northern Plains, portions of the Mid-Atlantic and Hawaii.
According to the One-Month Outlook issued on September 1 from the National Interagency Fire Center, Hawaii and portions of the Northwest, Oklahoma and the Northeast have above normal significant wildland fire potential during September.
This monthly summary from NOAA’s National Centers for Environmental Information is part of the suite of climate services NOAA provides to government, business, academia and the public to support informed decision-making. For more detailed climate information, check out our comprehensive August 2022 U.S. Climate Report scheduled for release on September 14, 2022.
Here are some “ET’s” recorded from around the planet the last couple of days, their consequences, and some extreme temperature outlooks. Any incoming Friday records from Falkor will be listed first:
Here is some more August and Summer 2022 climatology:
Here is more climate and weather news from Friday:
(As usual, this will be a fluid post in which more information gets added during the day as it crosses my radar, crediting all who have put it on-line. Items will be archived on this site for posterity. In most instances click on the pictures of each tweet to see each article. The most noteworthy items will be listed first.)
(If you like these posts and my work please contribute via the PayPal widget, which has recently been added to this site. Thanks in advance for any support.)
Guy Walton “The Climate Guy”