The main purpose of this ongoing blog will be to track planetary extreme, or record temperatures related to climate change. Any reports I see of ETs will be listed below the main topic of the day. I’ll refer to extreme or record temperatures as ETs (not extraterrestrials).😉
Main Topic: U.S. April Record Scoreboards and Climatological Review
Dear Diary. It’s time once again for our monthly climatological review. Here on this site, we usually present monthly summaries near the 8th of each month, and each is available by clicking the link below:
https://guyonclimate.com/category/record-scoreboard-climatological-reviews/
I’m repeating this mantra every month:
April 2023 using 1901-2000 mean data got ranked by the National Center for Environmental Information for the lower 48 states as 63rd warmest, or 67th coldest since records began being kept in 1895:
https://www.ncdc.noaa.gov/cag/national/rankings
We saw a continuation of the weather pattern from March, such that most of the West was below average, and most of the East and South had above average temperatures.
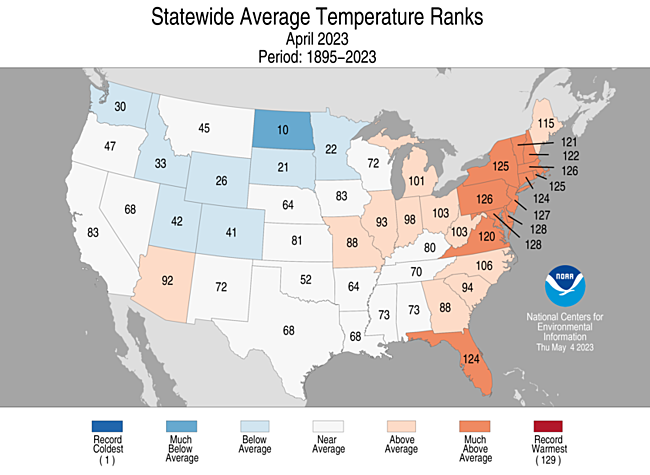
Brief summary for April 2023: Most reports of record warmth came from the East and South throughout the month. Most reports of record chill came from the West and northern Plains during the entire period, which was about as intense than the eastern record warmth.
Here are my two U.S. Daily Record Scoreboards updated through 5/4/2023 (data compiled from the following NCEI site):
https://www.ncdc.noaa.gov/cdo-web/datatools/records
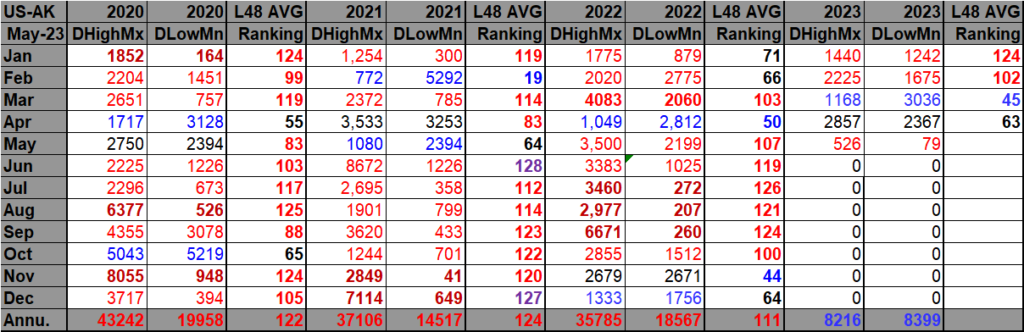
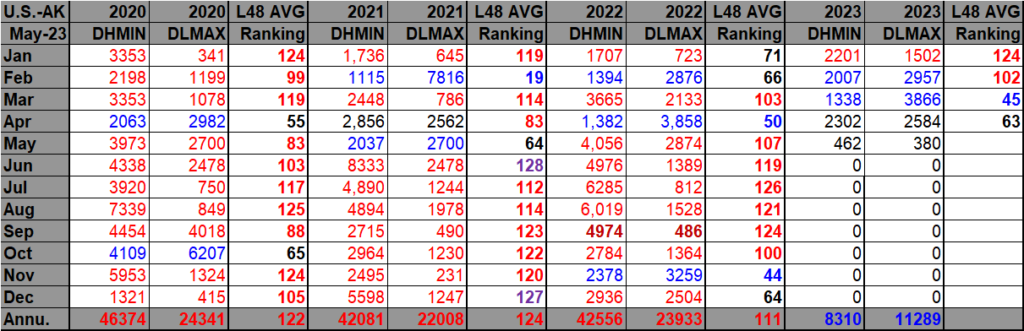
DHMX= Daily High Max Reports. DLMN= Daily Low Min Reports. DHMN= Daily High Min Reports. DLMX=Daily Low Max Reports.
Bold red, blue, or purple colored months, such as January 2020 and June 2021, that have ratios of >10 to 1 daily warm low records or <1 to 10 daily warm to low records are either historically hot or cold, most of which have made news. NCEI rankings are for the lower 48 states with the warmest ranking since 1895 of average temperatures being 128 (for ties) or 129 and 1 being the coldest as of 2023. Blue colors represent cold months and red warm. Those months and years with counts close to a 1 to 1 ratio of highs to lows are colored black. All-time record hottest or coldest months and years are boldly colored in purple. NCDC rankings have been color coded (under tabs in each file) such that values of 54 to 74 are black representing neutral months or years (+ or – 10 from the average ranking of 64).
I have come up with new programmed files such that daily record counts for Alaska are subtracted from NCEI values for the United States as a whole. This will enable us to better compare apples to apples values for the lower 48 states and NCEI average temperature rankings for the lower 48 states since 1895. These new files should be better, but they aren’t perfect since Hawaii and other U.S. tallies from all territories are still included in total counts. However, since the bulk of reporting stations outside of the lower 48 do come from Alaska, this is a good first fix. From what I can tell so far, differences between ratios of total U.S. tallies and those minus Alaska are minor.
Record numbers statistically matched up well during April of 2023 with that month being the 63rd warmest April on record. In light of how warm the planet has become due to carbon pollution, it’s a little surprising how cold it has been to start out 2023 for the United States.
April 2023 had approximately a 29 to 24 ratio of record DHMX to DLMN individual record counts, so the color I used for this month was black on the top chart.
April 2023 had approximately a 23 to 26 ratio of record DHMN to DLMX individual record counts, so the color I used for this month was black on the bottom chart.
Due to climate change, we are seeing fewer blue colors on these Record Scoreboards with time.
As stated, the average temperature lower 48 state ranking for April 2023 was 63, which was colored black since it was near average.
I color rankings of +10 to -10 from the average ranking for the lower 48 states of 64.5 black, indicating that these are near average temperature wise. The top warmest ranking for 2023 would be 129 since rankings began in 1895.
We are seeing that May 2023 has gotten off to a warm start, particularly in the Plains. Unnervingly, a heat dome is starting to set up rather early across portions of the country, which leads me to think that most of the United States will see well above average temperatures during May 2023.
Here is much more detailed climatology for April 2023 as complied by NOAA:
Assessing the U.S. Climate in April 2023
Extreme weather strikes: Seven billion-dollar disasters so far in 2023

Courtesy of Canva.com
PUBLISHED
MAY 8, 2023
Key Points:
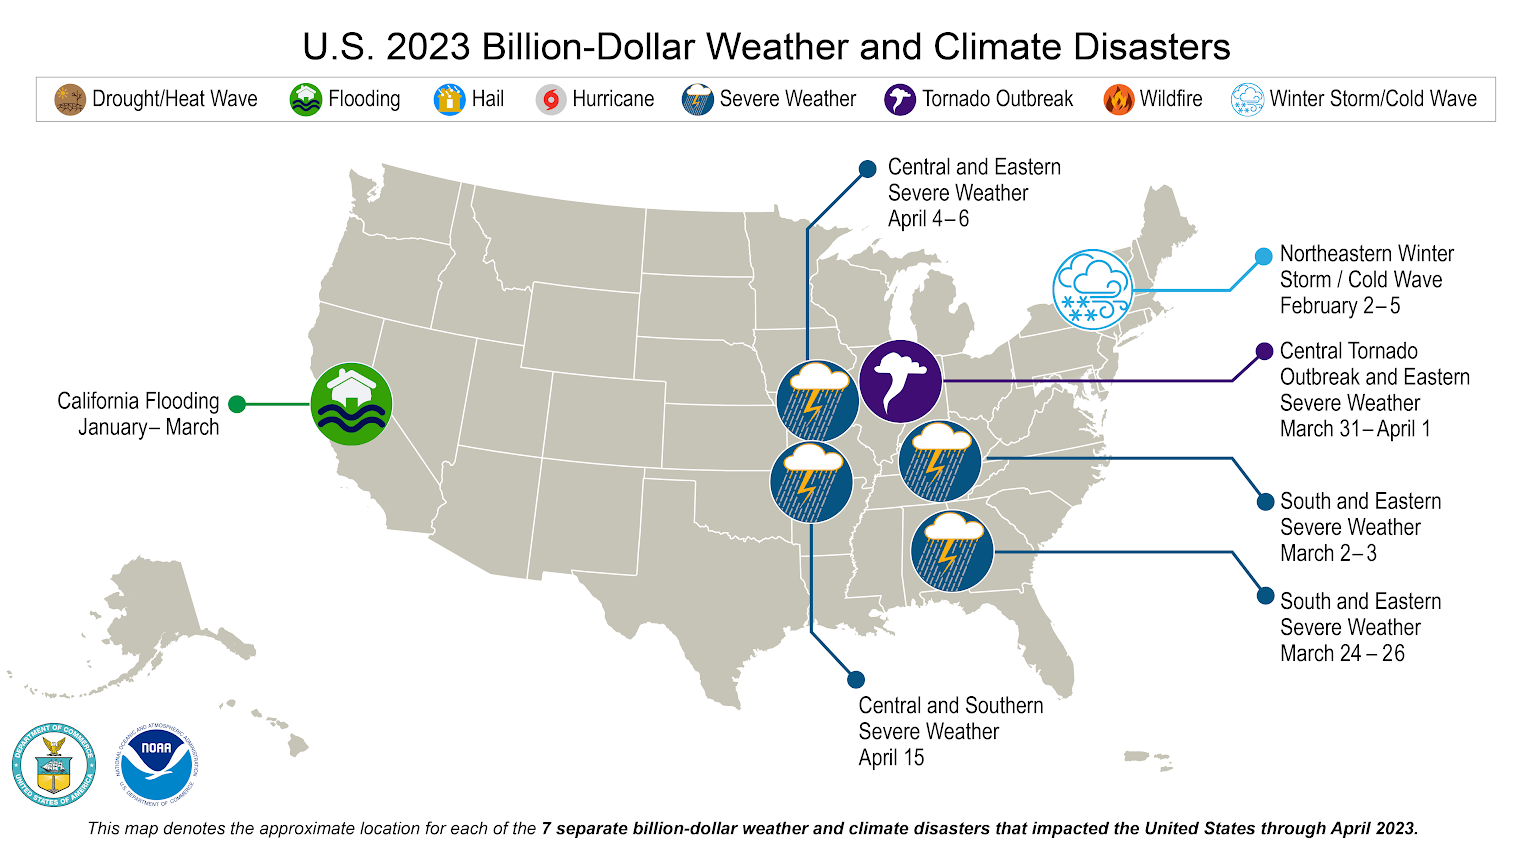
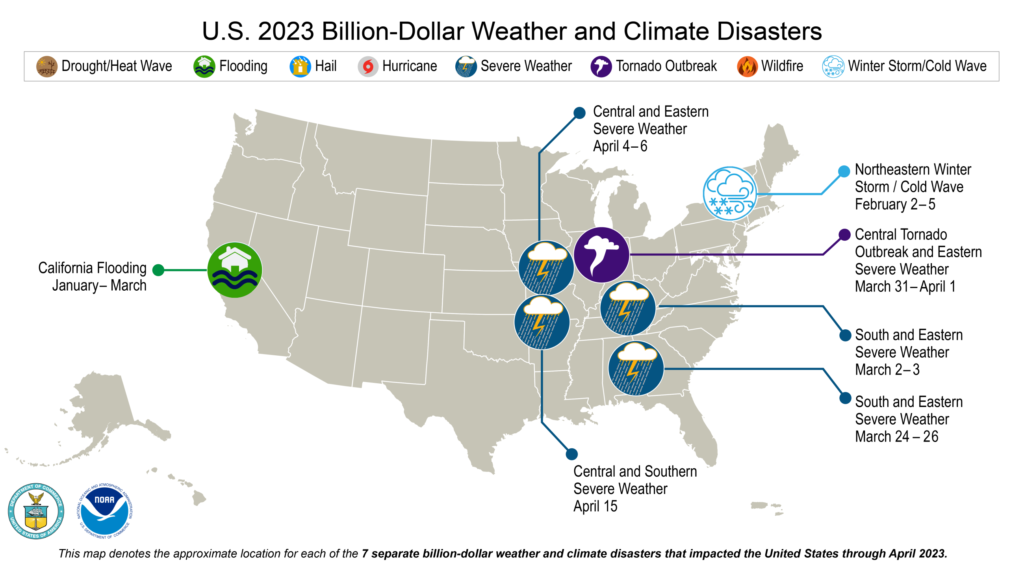
- As of May 8, seven billion-dollar weather and climate disasters were confirmed this year. These disasters consisted of five severe storm events, one winter storm and one flooding event.
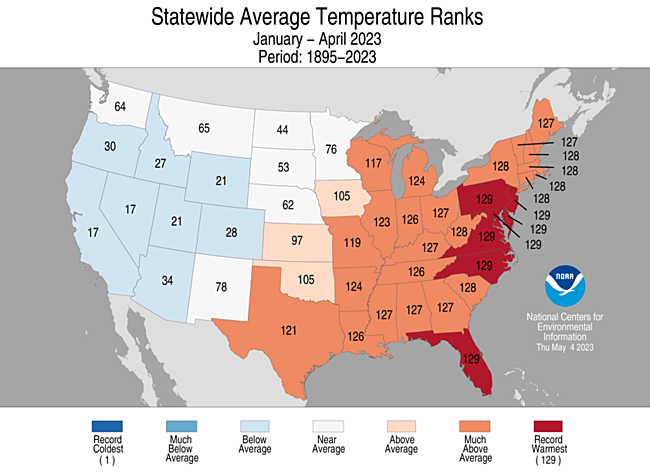
- Much of the eastern U.S. had a warm start to 2023. For the January–April period, seven states were record warmest with 21 additional states experiencing a top-10 warmest event for this period.
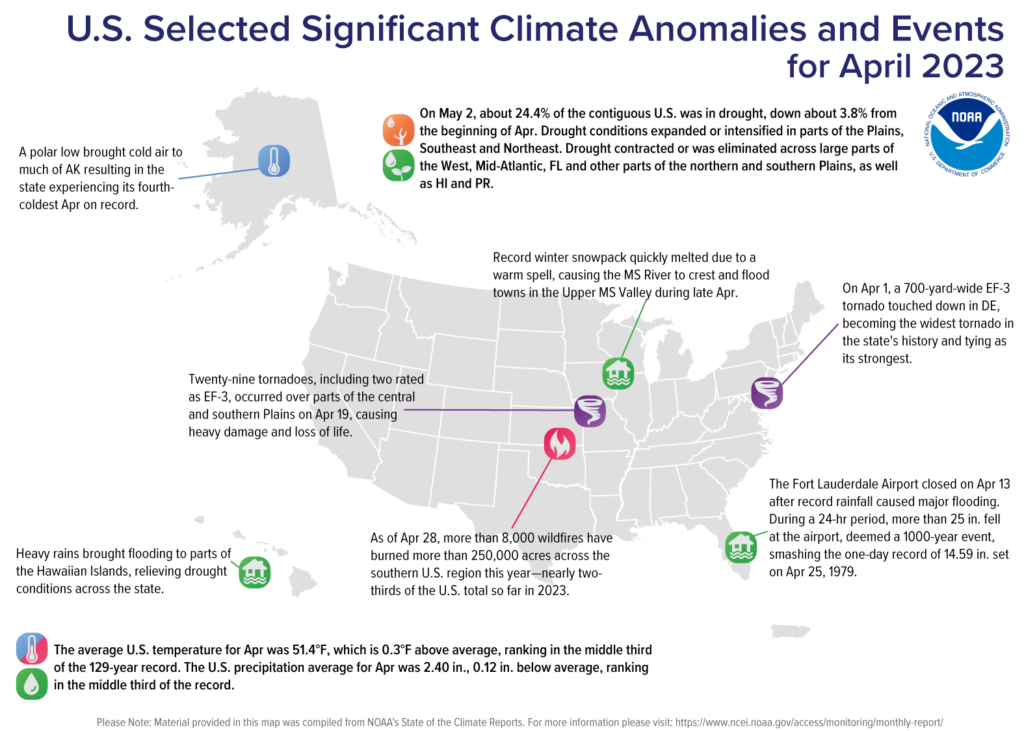
- The average temperature of the contiguous U.S. in April was 51.4°F, which is 0.3°F above average, ranking in the middle third of the 129-year record.
- April precipitation for the contiguous U.S. was 2.40 inches, 0.12 inch below average, ranking in the middle third of the historical record.
Other Highlights:
Temperature
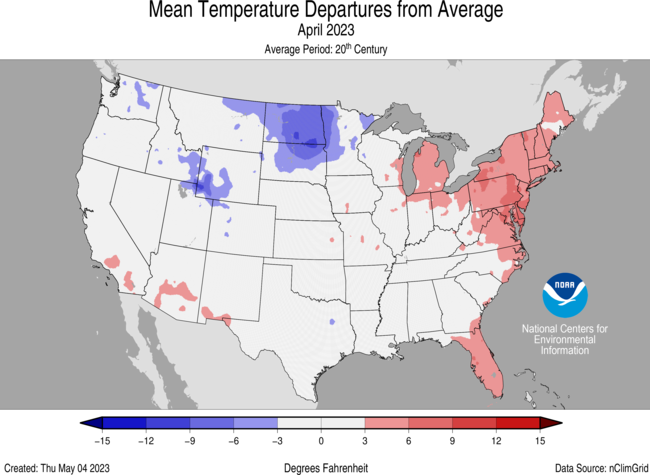
Generally, temperatures were below average from the Northwest to the central Rockies and northern Plains and parts of the southern Plains. Temperatures were above average from the central Plains to the Great Lakes, along the East and Gulf coasts and in parts of the Southwest and southern Plains. Maryland and Delaware ranked second warmest on record for April while New Jersey ranked third, with nine additional states ranking among their top-10 warmest April on record. Conversely, North Dakota ranked 10th coldest on record for the month.
The Alaska statewide April temperature was 16.3°F, 7.0°F below the long-term average. This ranked as the fourth-coldest April in the 99-year period of record for the state. Temperatures were below average across almost the entire state with near-normal temperatures in parts of the Southeast and Aleutians during the month.

For the January–April period, the average contiguous U.S. temperature was 40.9°F, 1.8°F above average, ranking in the warmest third of the record. Temperatures were above average across much of the eastern U.S. with near- to below-average temperatures from the northern Plains to the West Coast. Pennsylvania, New Jersey, Maryland, Delaware, Virginia, North Carolina and Florida each had their warmest January–April period on record. New Hampshire, Massachusetts, Rhode Island, Connecticut, New York, West Virginia and South Carolina each had their second warmest, while 14 additional states ranked among their warmest 10 year-to-date periods on record. Nevada and California both ranked 17th coldest on record for this four-month period.
The Alaska January–April temperature was 11.7°F, 1.4°F above the long-term average, ranking in the middle third of the record for the state. Much of the state was near-normal for the four-month period while temperatures were above-average across much of the North Slope and in parts of the southeast and Aleutians.
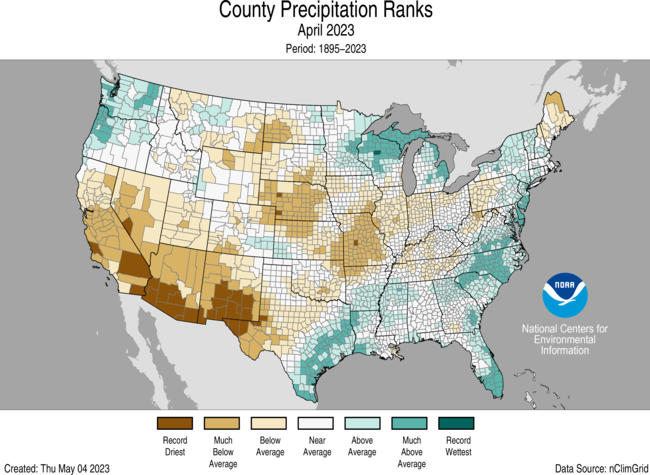
Precipitation
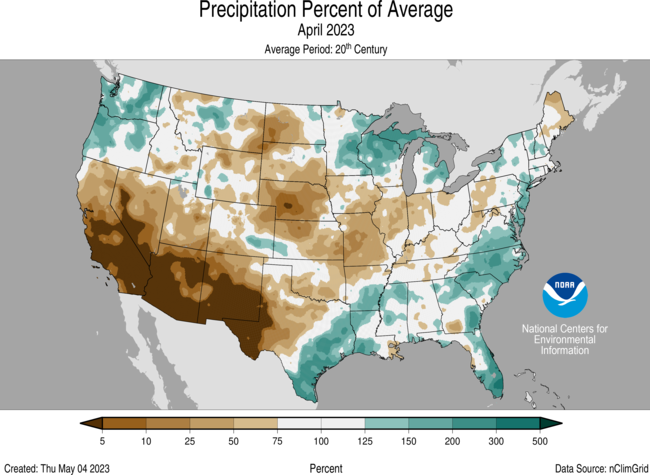
Precipitation was above average across portions of the Northwest, along the Gulf and East coasts and Upper Midwest and below average from California to the Ohio River Valley and in parts of the northern Rockies and Maine. Arizona, Missouri, Nebraska and New Mexico ranked third to sixth driest on record, respectively. Conversely, Delaware ranked seventh wettest, North Carolina ranked eighth wettest and New Jersey had its 10th-wettest April on record.
Across the state of Alaska, the average monthly precipitation was 2.01 inches, ranking in the middle third of the 99-year record. Conditions were wetter than average across much of the North Slope, eastern Interior and in parts of the Panhandle. Much of the central Interior to the West Coast and parts of the Southeast were near average, while parts of the Aleutians and Northwest Gulf experienced below-average precipitation for the month.
The January–April precipitation total for the contiguous U.S. was 10.22 inches, 0.74 inch above average, ranking in the wettest third of the 129-year record. Precipitation was above average across much of the Southwest and Great Lakes, and in parts of the southern Mississippi Valley, Southeast and Northeast. Wisconsin ranked wettest on record while Michigan ranked fourth and Utah ranked seventh wettest on record, respectively. On the dry side, precipitation was below average across parts of the Northwest, central and northern Plains, Mid-Atlantic and Florida during the January–April period. Maryland ranked 13th driest on record for this four-month period.
The January–April precipitation ranked in the wettest third of the 99-year record for Alaska, with above-average precipitation observed across much of the eastern Interior, North Slope and in parts of the Panhandle while the West Coast was much wetter than average. The central Interior and parts of the Southwest and Southeast were near average while south central Alaska and parts of the Aleutians experienced below-average precipitation during this period.
Billion-Dollar Disasters
There have been seven confirmed weather and climate disaster events, each with losses exceeding $1 billion this year. These disasters consisted of five severe storm events, one winter storm and one flooding event. The total cost of these events exceeds $19 billion, and they have resulted in 97 direct and indirect fatalities. The number of disasters so far this year is the second-highest number recorded during the first four months of a year. Only 2017 and 2020 had more, with eight separate disasters recorded in January-April. The first four months of 2023 places the total, direct costs of the confirmed billion-dollar events ($19.0 billion) in second place behind the first four months of 2021 ($36.1 billion mostly driven by the historical Feb. 2021 winter storm and/ cold wave that crippled the Texas energy grid).
The U.S. has sustained 355 separate weather and climate disasters since 1980 where overall damages/costs reached or exceeded $1 billion (including CPI adjustment to 2023). The total cost of these 355 events exceeds $2.540 trillion.
Other Notable Events
In less than a 24-hour period, more than 25 inches of rain fell at the Fort Lauderdale Airport on April 13. The event, deemed a 1000-year event by the National Weather Service, smashed the previous one-day record of 14.59 inches of rain set on April 25, 1979.
Several notable weather systems produced severe thunderstorms and a number of tornadoes that impacted portions of the U.S. in April.
- On April 1, a 700-yard-wide EF-3 tornado touched down in Delaware, becoming the widest tornado in the state’s history and tying as its strongest.
- A tornado outbreak occurred across areas of the southern and central Plains on April 19. A total of 29 tornadoes, including two EF-3 tornadoes, was confirmed by the National Weather Service, causing heavy damage and loss of life.
- On April 30, a state of emergency was declared after a rare EF-3 tornado touched down in Virginia Beach, destroying more than 100 structures.
Portions of the Upper Midwest and parts of the mountainous West received additional snowfall in April, adding to an already record- to near-record snowfall season.
- Duluth, Minnesota had its snowiest season on record with 140.1 inches of snow, besting 1995-96 by nearly 5 inches.
- Alta Ski Area in Utah surpassed 900 inches of snowfall on April 25—the most snowfall ever recorded at this ski resort.
- Jackson Hole Mountain Resort in Wyoming set a new snowfall record with 595 inches this season.
During late April, record winter snowfall across the northern Plains and Upper Midwest quickly melted due to a warm spell, causing the Mississippi River to crest and flood towns in the Upper Mississippi Valley.
According to the National Interagency Fire Center situation report released on April 28, more than 8,000 wildfires have burned more than 250,000 acres across the Southern U.S. this year. This is nearly two-thirds of all fires and acres consumed across the U.S. to date in 2023.
Drought
According to the May 2 U.S. Drought Monitor report, about 24.4% of the contiguous U.S. was in drought, down about 3.8% from the beginning of April. Moderate to exceptional drought was widespread across much of the Great Plains, with moderate to extreme drought in parts of the Northwest and Florida. Moderate to severe drought was present in parts of the northern Rockies and Southwest as well as moderate drought in parts of the Mid-Atlantic, Hawaii and Puerto Rico.
Drought conditions expanded or intensified in parts of the Plains, Southeast and Northeast this month, while drought contracted or was eliminated across large parts of the West, Mid-Atlantic, Florida and in other parts of the northern and southern Plains, as well as Hawaii and Puerto Rico.
Monthly Outlook
According to the April 30 One-Month Outlook from the Climate Prediction Center, areas from the Northwest to central Rockies, New England, Florida Peninsula and northern Alaska favor above-normal monthly mean temperatures in May, with the greatest odds likely to occur along eastern Washington to western Montana and southern Florida. The best chances for below-normal temperatures are forecast from California to southwestern New Mexico, Ohio and Tennessee River valleys and parts of the Southeast as well as across southeast Alaska. California to southern Idaho and states along the Gulf Coast, as well as parts of western Alaska, are favored to see above-normal monthly total precipitation. Below-normal precipitation is most likely to occur from the northern Plains to the Great Lakes. Drought improvement or removal is forecast across portions of the southern Plains, Mid-Atlantic and Florida, while persistence is more likely in portions of the West, the Northern to Central Plains and western Puerto Rico. Drought development is likely across the central parts of the Plains and Mississippi River Valley regions and in northwest Puerto Rico.
According to the One-Month Outlook issued on May 1 from the National Interagency Fire Center, portions of western Texas have above-normal significant wildland fire potential during May, while portions of the Southwest and northern Plains are expected to have below-normal potential for the month.
This monthly summary from NOAA’s National Centers for Environmental Information is part of the suite of climate services NOAA provides to government, business, academia and the public to support informed decision-making. For more detailed climate information, check out our comprehensive April 2023 U.S. Climate Report scheduled for release on May 11, 2023. For additional information on the statistics provided here, visit the Climate at a Glance and National Maps webpages.
Here are some more “ET’s” recorded from around the planet the last couple of days, their consequences, and some extreme temperature outlooks, as well as any extreme precipitation reports:
Here is some more brand-new April 2023 climatology:
Here is more climate and weather news from Monday:
(As usual, this will be a fluid post in which more information gets added during the day as it crosses my radar, crediting all who have put it on-line. Items will be archived on this site for posterity. In most instances click on the pictures of each tweet to see each article. The most noteworthy items will be listed first.)
And from the Weather Department:
More notes on other science and the beauty of Earth:
If you like these posts and my work please contribute via the PayPal widget, which has recently been added to this site. Thanks in advance for any support.)
Guy Walton… “The Climate Guy”