The main purpose of this ongoing blog will be to track planetary extreme, or record temperatures related to climate change. Any reports I see of ETs will be listed below the main topic of the day. I’ll refer to extreme or record temperatures as ETs (not extraterrestrials).😉
Main Topic: U.S. February 2025 Record Scoreboard and Climatological Review
Dear Diary. It’s time for our monthly climatological review. Here on this site, we usually present monthly summaries near the 10th of each month, and each is available by clicking the link below:
https://guyonclimate.com/category/record-scoreboard-climatological-reviews
I’m repeating this mantra every month:
https://twitter.com/climateguyw/status/1782804138176205252
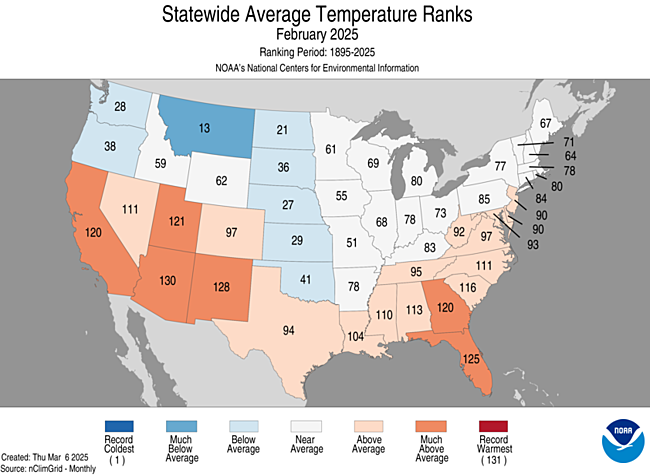
February 2025, using 1901-2000 mean data got ranked by the National Center for Environmental Information for the lower 48 states, was 52nd warmest or 80th coolest or 52nd warmest since records began being kept in 1895 at +1.04°F(0.58°C) above average.
The above data was from:
https://www.ncdc.noaa.gov/cag/national/rankings
During February 2024 well above average warmth occurred mostly in the Southwest and Southeast. We did see below average conditions across the Pacific Northwest and western Plains area. Most reports of record warmth came from the southwestern quarter of the nation throughout the month and Southeast during the first week of the month. Most reports of record chill came from the Midwest and Northwest during a cold outbreak early in the month:
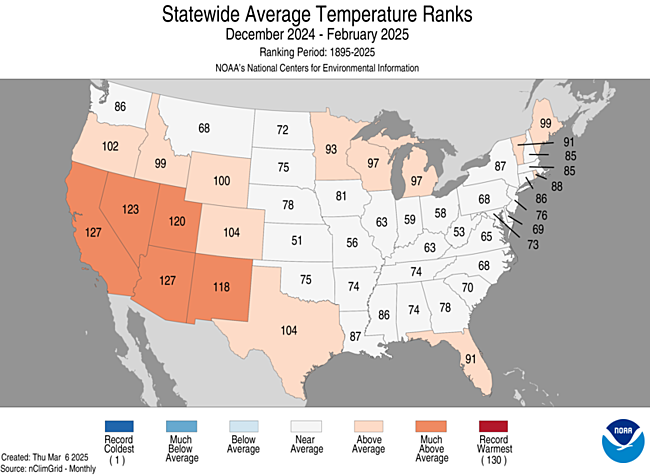
Winter 2024\25 using 1901-2000 mean data got ranked by the National Center for Environmental Information for the lower 48 states as warmest or 104th coolest or 27 warmest since records began being kept in 1895 at +1.86°F(1.03°C) above average.
You can check out record totals for yourself on my NCEI record archives:
NCEI Record Count Archive – Guy On Climate
Here are my two U.S. Daily Record Scoreboards updated through 3/09/2025 (data compiled from the following NCEI site):
https://www.ncdc.noaa.gov/cdo-web/datatools/records
I’m also keeping tabs on record report totals to verify a scientific study I helped to complete in the decade of the 2000s. We’ll eventually see how skewed ratios of record warm to cold reports get by the year 2100, which the study mentions as 50-1 for DHMX vs. DLMN:
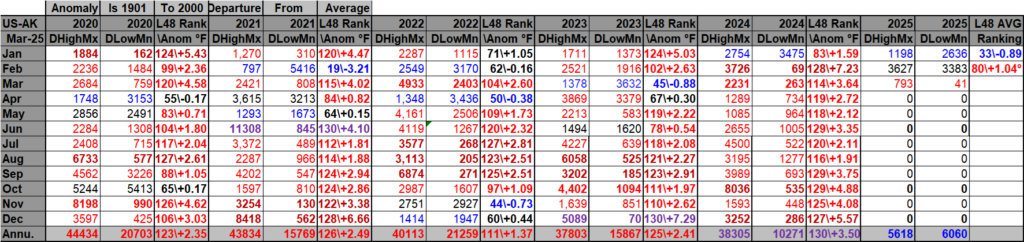
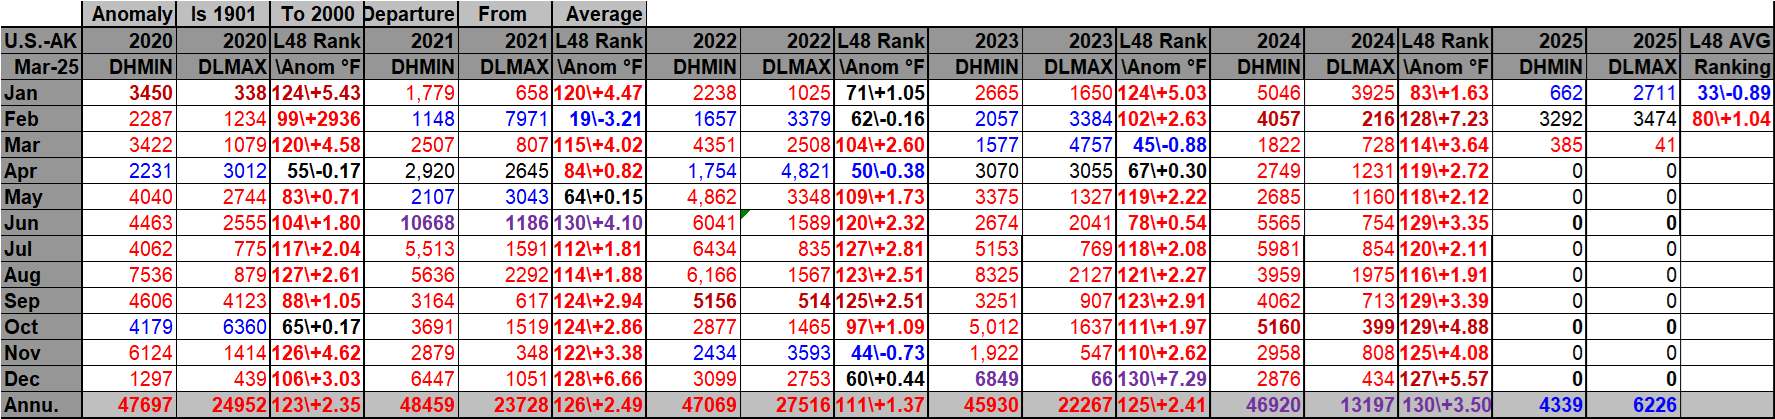
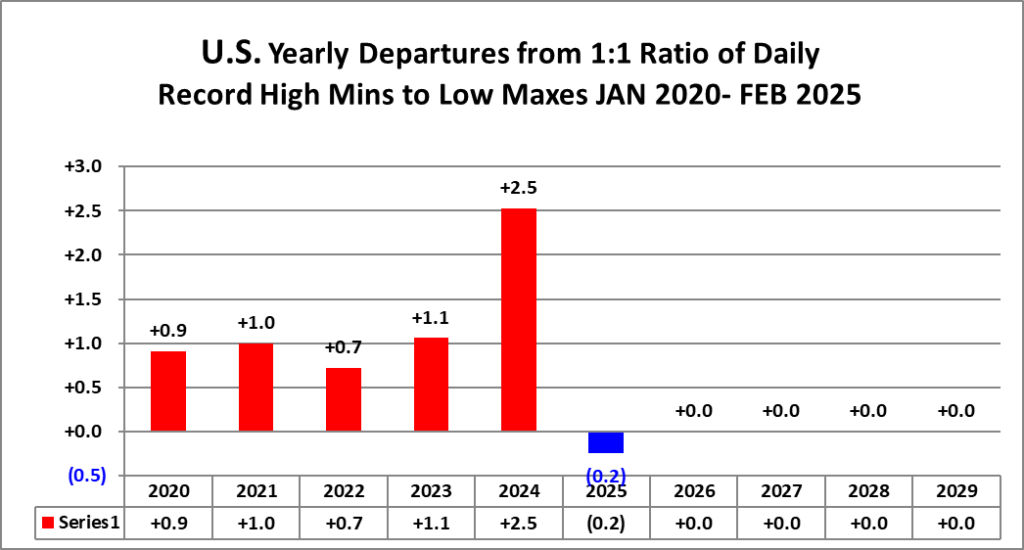
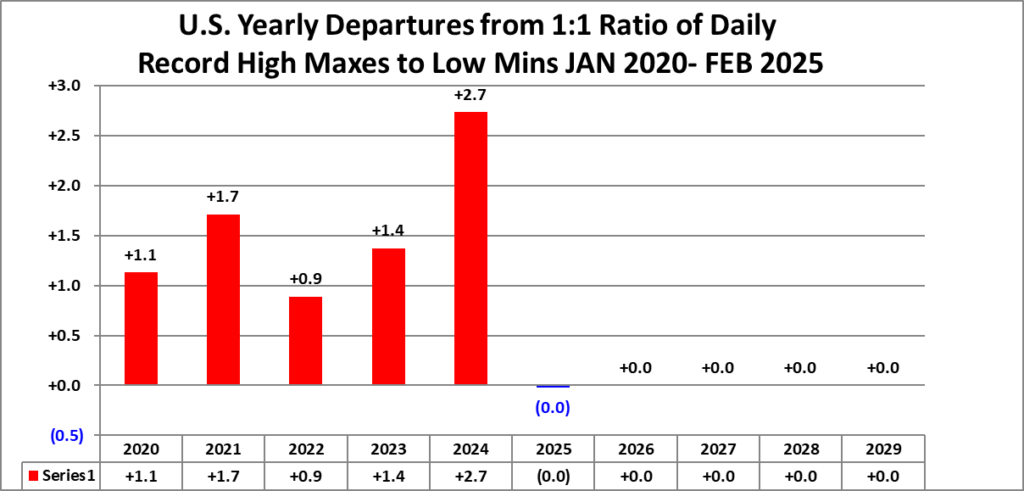
DHMX= Daily High Max Reports. DLMN= Daily Low Min Reports. DHMN= Daily High Min Reports. DLMX=Daily Low Max Reports.
Boldly highlighted red, blue, or purple colored months, such as December 2023 and June 2021, that have ratios of >10 to 1 daily or <1 to 10 of daily warm to low records are either historically hot or cold, most of which have made news. NCEI rankings are for the lower 48 states with the warmest ranking since 1895 of average temperatures being 130 and 1 being the coldest as of 2024. Blue colors represent cold months and red warm. Those months and years with counts close to a 1 to 1 ratio of highs to lows are colored black. All-time record hottest or coldest months and years are boldly colored in purple. NCDC rankings have been color coded (under tabs in each file) such that values of 54 to 74 are black representing neutral months or years (+ or – 10 from the average ranking of 64).
Totals are record reports for the entire United States including all territories minus those from Alaska. I’ve subtracted those from Alaska to get a better representation of what has occurred across the lower 48 states in association with lower 48 state rankings.
February 2025 had approximately a 18 to 17 ratio of record DHMX to DLMN individual record counts, so the color I used for that month was black on the top char since that ratio was very close to 1 to 1.
February 2025 had approximately a 33 to 35 ratio of record DHMN to DLMX individual record counts, so the color I used for that month was black on the bottom chart since that ratio was very close to 1 to 1.
Due to climate change, we are seeing fewer blue colors on these Record Scoreboards with time.
The average temperature lower 48 state ranking for January 2025 was 80, which was colored red since it was warmer than average. We are seeing fewer blue colors on my charts, and February 2025 was another warm red month…but barely.
I color rankings of +10 to -10 from the average ranking for the lower 48 states of 65 black, indicating that these are near average temperature wise. The top warmest ranking for 2025 would be 131 since rankings began in 1895.
Looking at the type and number of record reports, March 2025 has gotten off to a warm start. We should see above average temperatures for most of March looking at model guidance, but it will be nowhere nearly as warm as historic March 2012 conditions.
Interestingly, overall ratios for 2024 were higher than historic yearly ratios for other years from the 2020s as shown here…which is no surprise given how hot the globe was during this record hot year thanks to climate change:
Here is much more detailed climatology for February 2025 as complied by NOAA:
https://www.ncei.noaa.gov/news/national-climate-202502
Assessing the U.S. Climate in February 2025
Winter was warm and dry for the contiguous U.S.; seasonal snowfall was below average across the Northern Plains and Upper Midwest

Courtesy of GettyImages
Key Points:
- Season-to-date snowfall was two or more feet below average across portions of the northern Plains and Upper Midwest, and above average downwind of the Great Lakes, in portions of the West and in parts of the central Plains, Gulf Coast, Southeast and Ohio Valley.
- Alaska had its third-warmest winter, while Hawai’i had its second-warmest and fifth-driest winter on record.
- Temperature and precipitation across the contiguous U.S. in February ranked near average.
Other Highlights:
Temperature

The average temperature of the contiguous U.S. in February was 34.9°F, 1.0°F above average, ranking in the middle third of the 131-year record. Generally, February temperatures were above average across much of the Southwest, Gulf Coast and Southeast and cooler-than-average from the Pacific Northwest to the northern and central Plains. Arizona had its second-warmest February on record.
The Alaska statewide February temperature was 11.8°F, 7.0°F above the long-term average, ranking in the warmest third of the 101-year period of record for the state. The Aleutian region ranked fourth warmest, with much of the state experiencing above-average temperatures. Below-average temperatures were present across the South Panhandle region.
For February, Hawai’i had an average temperature of 64.5°F, 1.4°F above the 1991–2020 average, ranking sixth warmest in the 35-year record.
The meteorological winter (December–February) average temperature for the Lower 48 was 34.1°F, 1.9°F above average, ranking in the warmest third of the record.
The Alaska winter temperature was 13.6°F, 10.0°F above the long-term average, ranking third warmest in the historical record for the state.
Hawai’i had a winter temperature average of 64.9°F, 1.2°F above average, ranking second warmest in the historical record.
Precipitation

February precipitation for the contiguous U.S. was 2.13 inches, which is average for the month. Wetter-than-average conditions were present across much of the Northwest and from the central Mississippi Valley to the East Coast and into parts of the Northeast. Dry conditions were present from parts of the Southwest and Deep South to the Great Lakes and northern Plains, as well as in portions of the Southeast.
Alaska’s average monthly precipitation ranked ninth driest for February, with portions of southwestern and southcentral Alaska having been much drier than average.
Precipitation across Hawai’i in February averaged 1.22 inches, 3.88 inches below average, ranking third driest on record.
The U.S. winter precipitation total was 5.87 inches, 0.92 inch below average, ranking in the driest third of the December–February record.
For the winter season, precipitation ranked in the wettest third of the historical record for Alaska.
Winter precipitation across Hawai’i was 8.52 inches, 8.03 inches below average, ranking fifth driest on record.
Drought
According to the March 4 U.S. Drought Monitor report, about 44.4% of the contiguous U.S. was in drought, up about 2% from the beginning of February. Drought conditions expanded or intensified across the Pacific Northwest, portions of the Southwest, Midwest, southern Plains and Hawai’i. Drought contracted or was reduced in intensity across parts of the Tennessee Valley, Mid-Atlantic, Northern Rockies and parts of the West Coast.
Monthly Outlook
Above-average temperatures are favored to impact the Deep South and Southeast while precipitation is likely to be above average across portions of the Northwest and Great Lakes. Drought is likely to persist or expand across parts of the central and northern Plains, Southwest and Deep South. Visit the Climate Prediction Center’s Official 30-Day Forecasts and U.S. Monthly Drought Outlook website for more details.
Significant wildland fire potential for March is above normal across portions of the Southwest, Deep South and Southeast. For additional information on wildland fire potential, visit the National Interagency Fire Center’s One-Month Wildland Fire Outlook.
For more detailed climate information, check out our comprehensive February 2025 U.S. Climate Report scheduled for release on March 13, 2025. For additional information on the statistics provided here, visit the Climate at a Glance and National Maps webpages.
Related Links
February 2025 U.S.Climate Report (Available March 13, 2025)
National Temperature and Precipitation Maps
Climatological Rankings Explained
State of the Climate Summaries
Much more here:
Here are more “ETs” recorded from around the planet the last couple of days, their consequences, and some extreme temperature outlooks, as well as any extreme precipitation reports:
Here is more new February 2025 and Winter 2024/25 climatology (summer for Southern Hemisphere):
Here is More Climate News from Tuesday:
(As usual, this will be a fluid post in which more information gets added during the day as it crosses my radar, crediting all who have put it on-line. Items will be archived on this site for posterity. In most instances click on the pictures of each tweet to see each article. The most noteworthy items will be listed first.)