The main purpose of this ongoing blog will be to track planetary extreme, or record temperatures related to climate change. Any reports I see of ETs will be listed below the main topic of the day. I’ll refer to extreme or record temperatures as ETs (not extraterrestrials).😜
Main Topic: More Signs and Images of a Weakening Atlantic Ocean Circulation (AMOC)
Dear Diary. Yours truly and many other climate scientists and oceanographers have been monitoring an area south of Greenland to see if a cold anomaly would remain intact and perhaps grow. The cold anomaly is caused by meltwater coming off Greenland due to climate change. In turn, this meltwater is influencing a critical ocean circulation dubbed the AMOC or Atlantic Meridional Overturning Circulation, which keeps Europe warm. Most people don’t know the fact that Europe is at a high latitude, so without the AMOC it would have a climate much like that of Alaska. Ironically, global warming could lead to cooling across much of Europe.
Recently there have been more signs of Atlantic cooling south of Greenland. Here is a new report from Stephan Rahmstorf posted of Gavin Schmidt’s Real Climate site:
High-resolution ‘fingerprint’ images reveal a weakening Atlantic Ocean circulation (AMOC)
12 Oct 2025
The #AMOC is the reason for Europe’s mild climate. Evidence that it is slowing has been piling up over the years – it now is likely at its weakest in at least a millennium, and it may even be approaching a tipping point. Here I will show you the latest high-resolution images – and also discuss whether there is serious evidence speaking against an ongoing AMOC weakening.
Our regular readers are well aware of the Atlantic Meridional Overturning Circulation, or AMOC in short, a large-scale overturning motion of water along the whole Atlantic which transports a quadrillion Watts (that is 1015 W) of heat to the northern Atlantic, partly via the Gulf Stream. (If you are new to the topic, check out this article.)
Instabilities of the AMOC have produced some of the most dramatic climate changes in recent Earth history, well-known to paleo-climatologists (see e.g. my by now ancient review in Nature 2002), and concerns that we are destabilizing it by causing global warming has been rising sharply in expert circles in recent years (see last year’s open letter by 44 experts).
One reason is what we are observing in the northern Atlantic. And another reason is the latest model simulations by the Dutch research group in Utrecht. A recent paper by van Westen et al. (2025) has shown that the much-feared tipping point where the AMOC breaks down (first demonstrated in a simple box model in 1961) is also found in a high-resolution (eddy resolving) ocean model – destroying any hope that it might be an artifact of too coarse and simple models. This tipping point has been consistently demonstrated across the entire model spectrum by now, and the cause is well-understood (a destabilizing salt transport feedback).
Also, that model simulation and paper provide us with the AMOC ‘fingerprint’ in sea surface temperature (SST) in unprecedented detail. So let’s have a look (Fig. 1)!
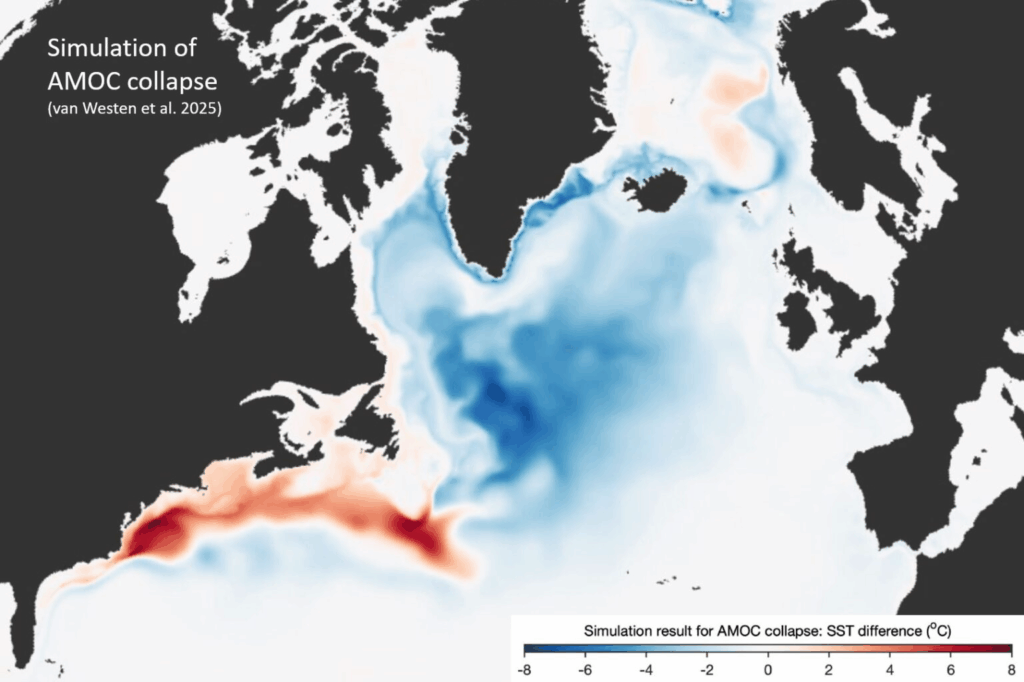
Figure 1. Sea surface temperature change pattern caused by the AMOC shutting down in a high-resolution ocean model. This is a pure AMOC effect without any greenhouse-gas climate change. We see the famous blue ‘cold blob’ due to less heat being brought to the northern Atlantic, and also in red the northward Gulf Stream shift, an ocean dynamics effect of weakening AMOC (Zhang 2008). Source: van Westen et al. 2025., mapped by Ruijian Gou.
And now compare that fingerprint pattern to the trend in satellite sea surface temperature measurements (Fig. 2). What do you see?
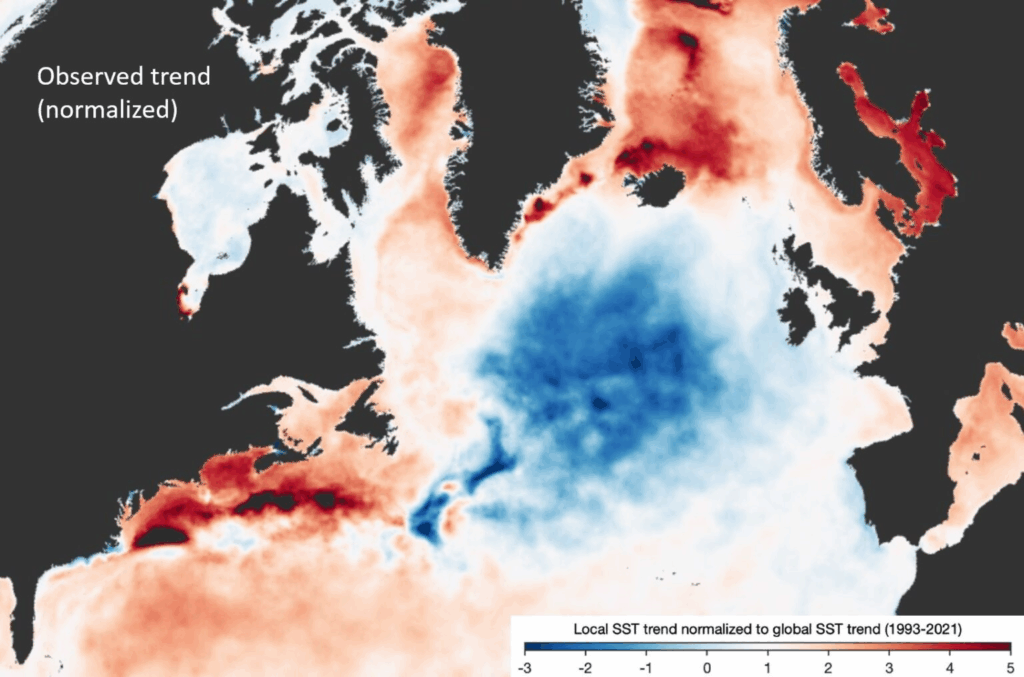
Figure 2. Normalised trend in satellite-derived sea surface temperature 1993-2021 (linear trend over that period). Normalised means it is divided by the global mean sea surface temperature trend in order to take out the global warming signal. So blue regions (values less than 1) have warmed less than the global mean or cooled, red have warmed more than average. Source: Copernicus satellite data, mapped by Ruijian Gou.
The cold blob and the Gulf Stream shift signal are both clearly seen in the satellite trend. Note we are only comparing the pattern, not its amplitude, and the colors correspond to different units: In the observational data we are talking about a moderate AMOC change, in the model a near-complete shutdown. That explains also the differences: in the satellite map the Labrador Sea hasn’t cooled, presumably as deep convection there still continues. And the Nordic Seas have warmed – we have a paper in preparation which shows this is due to increased flow of warm water toward the Nordic Seas and likely a result of AMOC weakening; these two overturning motions are dynamically anticorrelated, but only temporarily so until Nordic Sea convection shuts down.
Taken together, these two images provide once again clear evidence that an AMOC weakening is underway – as was first argued fifteen years ago by Dima and Lohmann (2010). The same fingerprint is also found in a coupled climate model simulation for CO2 doubling by the Geophysical Fluid Dynamics Lab in Princeton, as shown in Fig. 1 in this blog post from 2018. And the fingerprint pattern of cold blob and Gulf Stream shift can also be seen for a different time interval in the following global image of sea surface temperature change (Fig. 3).
This weakening is of particular concern because the AMOC has a tipping point, and our recent study has shown that in many of the standard future global warming simulations performed for the current IPCC report the AMOC passes that tipping point and shuts down in the following decades. The Guardian rightly titled that this danger “is no longer low-likelihood”, as we had discussed it for decades.
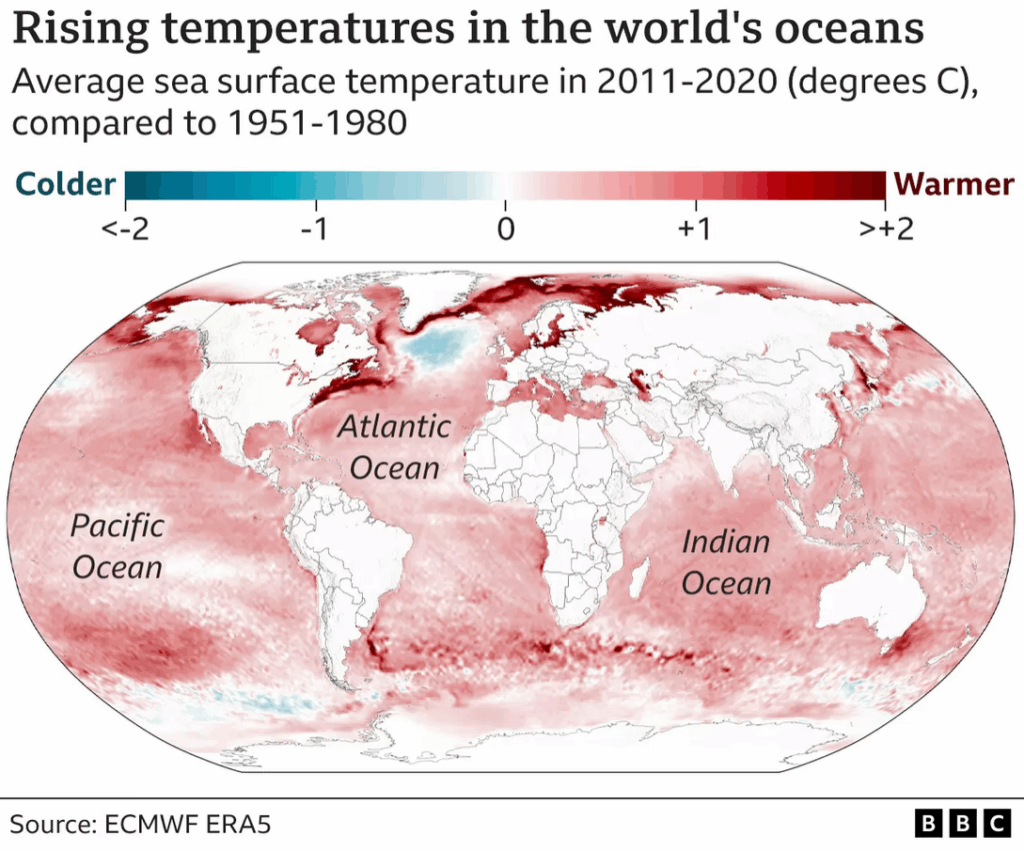
Figure 3. Global map of changes of sea surface temperature. Source: ERA5/BBC
What about counter-arguments?
I sometimes read counter-arguments against an ongoing AMOC slowing, but many just don’t hold water. Let’s have a look at some of them.
For example, the increase in Nordic Sea exchange is sometimes taken as contradicting an AMOC weakening – but that is a non-sequitur as there is no reason why these two circulations should be in sync, but good physical reasons and empirical evidence suggest that in fact they anti-correlate.
Not seldom different time periods are mixed up – for example when the Worthington et al 2021 reconstruction is quoted as questioning an AMOC weakening. Let’s compare that to the reconstruction by Caesar et al. 2018 where we estimated a 15 % weakening since the late 19th Century (Fig. 4) – I would say these two reconstructions strongly agree during the time interval 1981–2016 covered by Worthington.
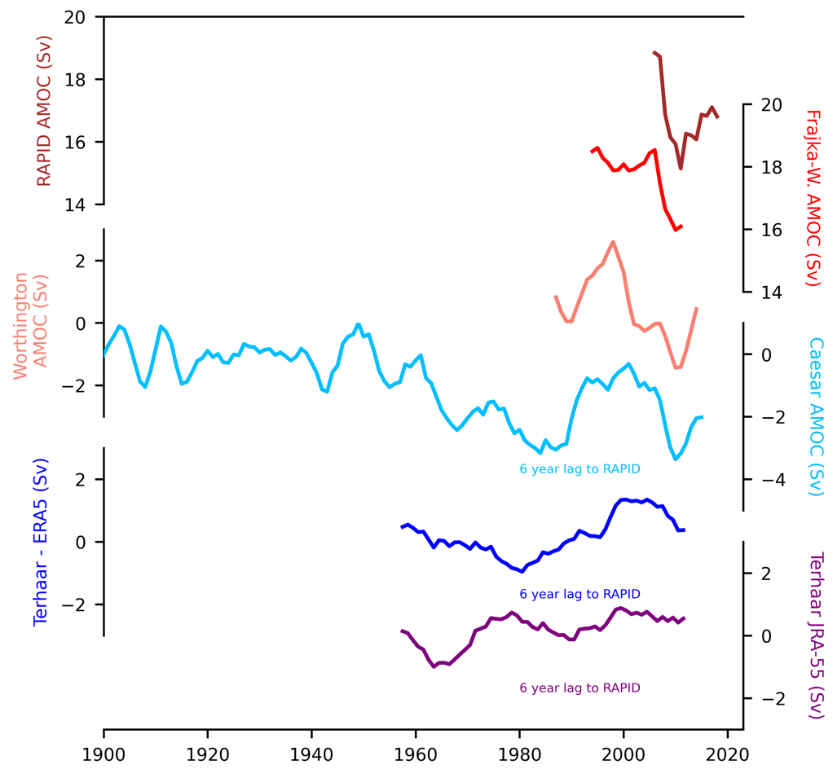
Figure 4 Several AMOC reconstructions, with the RAPID measurements on top. The reconstruction by Frajka-Williams et al. 2015 used surface height data from satellite, and the Worthington et al 2021 reconstruction uses a water mass regression based on RAPID data. Graph: Levke Caesar.
One recent prominent paper by Terhaar et al. (2025) that has questioned AMOC weakening covers a longer interval (1958 to 2022). But for the period since 1958 Caesar et al. 2018 also did not find a statistically significant AMOC weakening – so strictly no contradiction there – and what’s more, the calculated input data used (surface heat fluxes) are far more uncertain than the directly measured sea surface temperatures, as we can see in the large differences between their two reconstructions (dark blue and purple) using two different surface flux data sets. And they both disagree with the likely more reliable reconstruction method by Worthington. (More on the Terhaar study here.)
Then there is Latif et al. 2022. They don’t claim to contradict the Caesar reconstruction, they explicitly write they don’t. What they argue is that natural variability is larger than an anthropogenic effect. That is not the same as saying there is no AMOC slowing. In the Caesar reconstruction multidecadal variability is also larger than the slowing trend. I always show Latif et al 2022 in my talks in support of the observed SST fingerprint pattern indicating an AMOC slowing, since their paper shows a clear correlation of the SST fingerprint with the AMOC (as shown in Fig. 2 here in this post).
Sometimes also a paper by Rossby et al. 2022 is cited as questioning an AMOC slowdown. Let’s just quote their abstract: “There is evidence for a 2.0 Sv Gulf Stream slow-down between 1930 and 2020. Whether and to what extent this reflects a slowdown of the AMOC or wind-driven circulation cannot be established with certainty. Our estimate of a 0.4 Sv AMOC decrease is reported with low confidence.” They thus report a slowdown, just with low confidence.
There is also a reconstruction since 1900 by Fraser and Cunningham 2021. They write that “from the 1930s onwards we see qualitative agreement with Caesar et al. (2018), with mostly a high AMOC until the 1950s, followed by a weakening throughout the 1960s and then a lesser peak around 2000”. There is disagreement between 1900 and 1930, where however their method is very uncertain, so they conclude that although their “results do not resolve AMOC weakening over the last century, they should not be interpreted as evidence to the contrary.” Which some people do nevertheless.
As another example, a paper by He et al. 2022 argues based on a model simulation that the SST fingerprint pattern could also be caused by surface fluxes rather than an AMOC weakening. However, the observed fluxes suggest the opposite. And their model simulation starts in 1920 with a prescribed constant ocean heat transport that doesn’t match the initial state of the atmosphere – a model setup which invariably leads to an initial adjustment process of the model (in other words, climate drift) which will likely look like the ocean heat transport fingerprint, as I discuss in this talk.
And finally there was a paper which many media reported as showing a much more resilient AMOC even though it just redefined the word AMOC collapse, and the Volkov study about a stable Florida Current which climate skeptics confused with the AMOC (see postscript here).
So while there is quite a number of studies with different methods using temperature or salinity data or paleoclimate proxy data from ocean sediments that support a weakening AMOC since the 19th Century (as I have previously discussed e.g. here, here and here), I do not really see a credible counter-argument. If you know one that I have missed, please let me know in the comments!
And as a final reminder: if there is a risk that the AMOC is weakening and heading towards a tipping point, we need to act on that (just like with other major risks). This is not an issue where we can afford to wait until we are certain, or pretend it’s just an academic discussion without major consequences.
If you want more information on this…
My overview article in Oceanography Magazine (open access, many pictures)
My Alfred Wegener Medal lecture at the European Geosciences Union meeting 2024
Here are more “ETs” recorded from around the planet the last couple of days, their consequences, and some extreme temperature outlooks, as well as any extreme precipitation reports:
Here is More Climate News from Tuesday:
(As usual, this will be a fluid post in which more information gets added during the day as it crosses my radar, crediting all who have put it on-line. Items will be archived on this site for posterity. In most instances click on the pictures of each tweet to see each article. The most noteworthy items will be listed first.)