The main purpose of this ongoing blog will be to track planetary extreme, or record temperatures related to climate change. Any reports I see of ETs will be listed below the main topic of the day. I’ll refer to extreme or record temperatures as ETs (not extraterrestrials).😜
Main Topic: U.S. November and Fall 2025 Record Scoreboard and Climatological Review
Dear Diary. It’s time for our monthly climatological review. Here on this site, we usually present monthly summaries near the 8th of each month, and each is available by clicking the link below:
https://guyonclimate.com/category/record-scoreboard-climatological-reviews
I’m repeating this mantra every month:
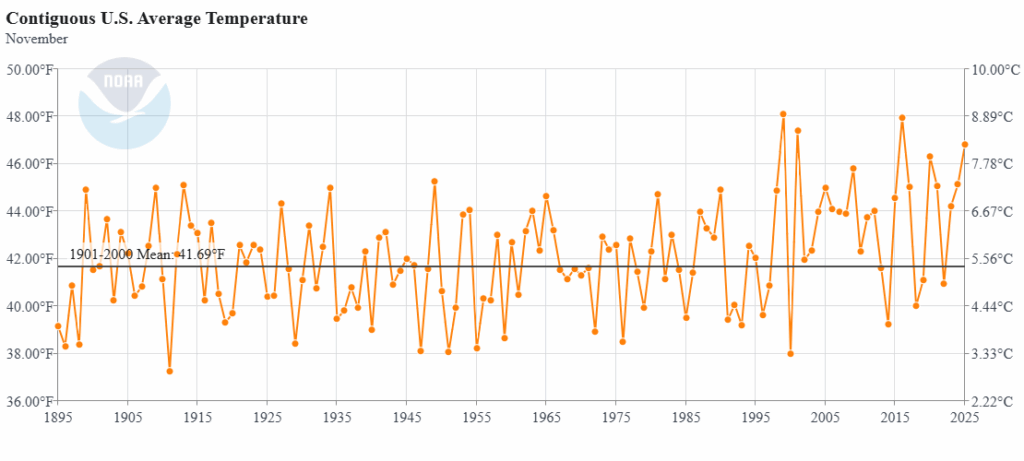
November 2025 got ranked by the National Center for Environmental Information for the lower 48 states as 4th warmest or 128th coolest since records began being kept in 1895 at +5.12°F above the 1901-2000 average.
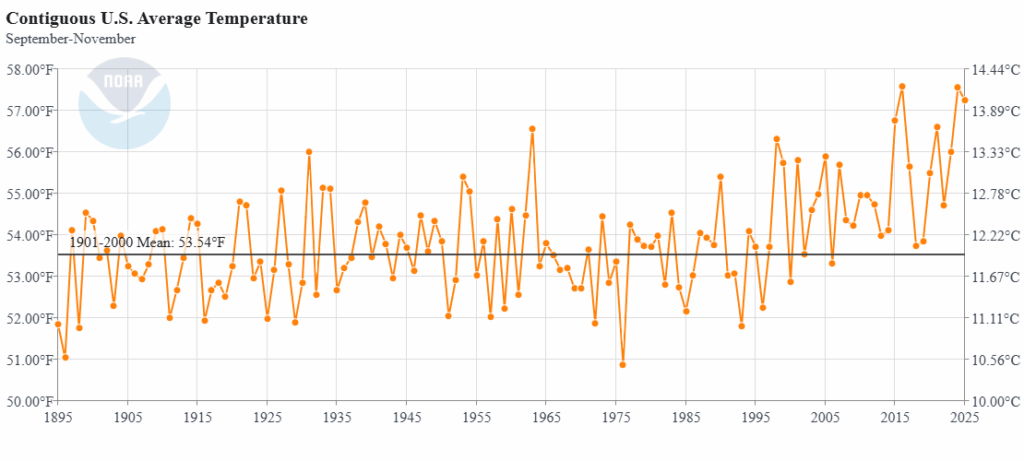
Fall 2025 got ranked by the National Center for Environmental Information for the lower 48 states as 3rd warmest or 129th coolest since records began being kept in 1895 at +3.7°F above the 1901-2000 average.
The above data was from:
https://www.ncdc.noaa.gov/cag/national/rankings
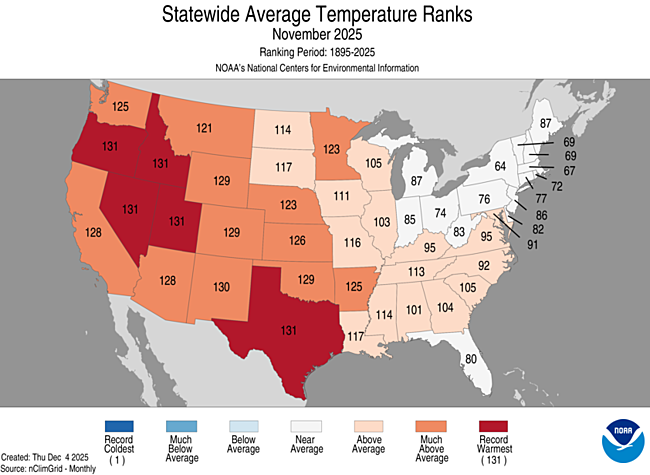
During November the warmest conditions were in the western and central portions of the nation. Many western states and Texas had their record warmest November and fall. Reports of record chill were quite sparse nationwide. Most reports of record warmth occurred in the western part of the nation.
You can check out record totals for yourself on my NCEI record archives:
NCEI Record Count Archive – Guy On Climate
Here are my two U.S. Daily Record Scoreboards updated through 12/08/2025 (data compiled from the following NCEI site):
https://www.ncdc.noaa.gov/cdo-web/datatools/records
I’m also keeping tabs on record report totals to verify a scientific study I helped to complete in the decade of the 2000s. We’ll eventually see how skewed ratios of record warm to cold reports get by the year 2100, which the study mentions as 50-1 for DHMX vs. DLMN:
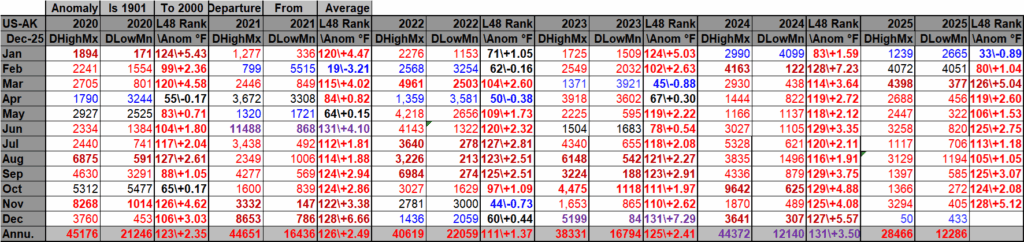
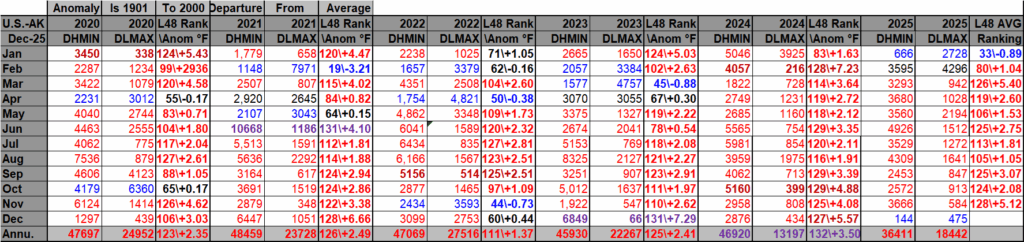
DHMX= Daily High Max Reports. DLMN= Daily Low Min Reports. DHMN= Daily High Min Reports. DLMX=Daily Low Max Reports.
Boldly highlighted red, blue, or purple colored months, such as December 2023 and June 2021, that have ratios of >10 to 1 daily or <1 to 10 of daily warm to low records are either historically hot or cold, most of which have made news. NCEI rankings are for the lower 48 states with the warmest ranking since 1895 of average temperatures being 131 and 1 being the coldest as of 2025. Blue colors represent cold months and red warm. Those months and years with counts close to a 1 to 1 ratio of highs to lows are colored black. All-time record hottest or coldest months and years are boldly colored in purple. NCDC rankings have been color coded (under tabs in each file) such that values of 55 to 75 are black representing neutral months or years (+ or – 10 from the average ranking of 64).
Totals are record reports for the entire United States including all territories minus those from Alaska. I’ve subtracted those from Alaska to get a better representation of what has occurred across the lower 48 states in association with lower 48 state rankings.
November 2025 had approximately a 14 to 3 ratio of record DHMX to DLMN individual record counts, so the color I used for that month was dark red on the top chart.
November 2025 had approximately a 37 to 6 ratio of record DHMN to DLMX individual record counts, so the color I used for that month was red on the bottom chart.
Due to climate change, we are seeing fewer blue colors on these Record Scoreboards with time.
The average temperature lower 48 state ranking for November 2025 was 128, which was colored red since it was warmer than average. We are seeing fewer blue colors on my charts, and November 2025 was yet another red or warm month.
I color rankings of +10 to -10 from the average ranking for the lower 48 states of 65 black, indicating that these are near average temperature wise. The top warmest ranking for 2025 would be 131 since rankings began in 1895.
Looking at the type and number of record reports, December 2025 has gotten off to a cold start, but meteorological models are consistently forecasting a warming trend for the rest of the month except across the northeastern third of the nation. Will 2025 get book ended by two colder than average winter months? Stay tuned.
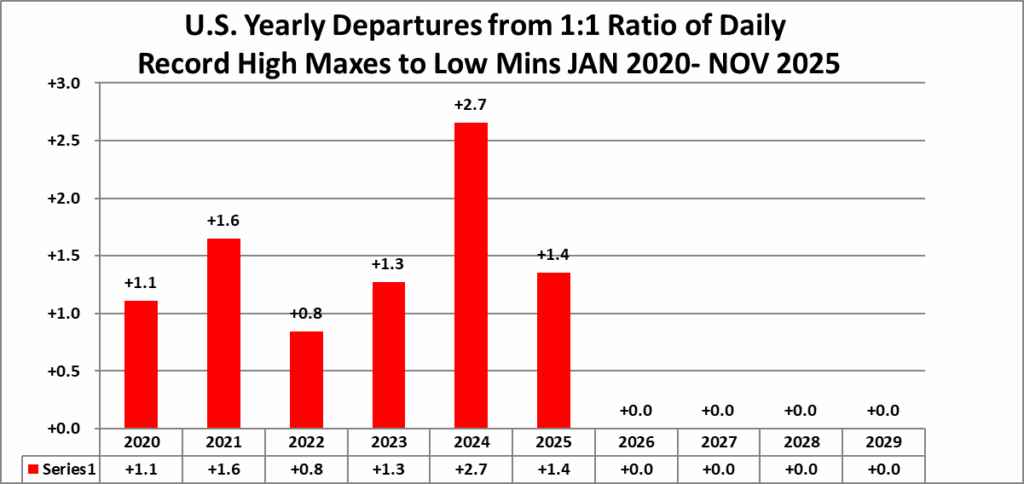
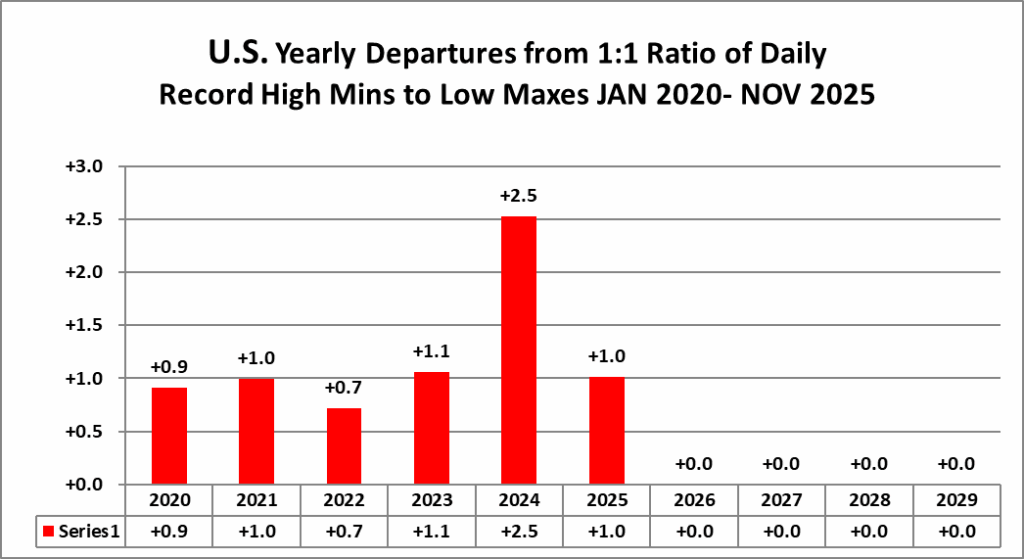
Interestingly, here is what we see as far as overall yearly ratios go for the 2020s so far. Warmth is key here:
Here is much more detailed climatology for November and Fall 2025 as complied by NOAA:
Assessing the U.S. Temperature and Precipitation Analysis in November 2025
November and fall rank among warmest on record and it was exceptionally dry across much of the East
Courtesy of Canva.com
Published December 8, 2025
Key Points:
- November was unusually warm nationwide, ranking as the fourth warmest on record, with five states setting November temperature records.
- Meteorological fall ranked third warmest on record, with seven states setting fall temperature records.
- Dry conditions dominated the eastern U.S., with the Southeast seeing its driest fall since 1978.

Other Highlights:
Temperature
The average temperature of the contiguous U.S. (CONUS) in November was 46.8°F, 5.1°F above the 20th-century average, ranking as the fourth-warmest November in the 131-year record. Much-above-average warmth covered most of the western and central U.S., while much of the eastern third remained near average. Five states—Idaho, Nevada, Oregon, Texas and Utah—set new statewide records for November temperature, with Utah (44.4°F) surpassing its 2017 record by more than 1°F. New Mexico had its second-warmest November and Colorado, Oklahoma and Wyoming each recorded their third warmest. At the county level, 100 Texas counties set new records for their warmest average November temperatures, with 30 counties recording average daily highs more than 10°F above the 20th-century average.

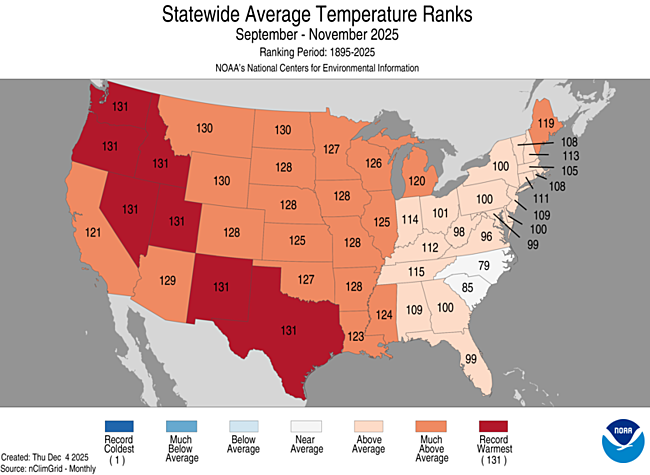
For meteorological fall (September–November), the CONUS average temperature was 57.2°F, 3.7°F above average, ranking as the third-warmest fall in the 131-year record. Apart from the Carolinas, all CONUS states had fall temperatures more than 1°F above the 20th-century average, and seven states—Idaho, Nevada, New Mexico, Oregon, Texas, Utah and Washington—set new statewide fall temperature records. Nationwide, 275 counties—nearly 15 million people—experienced their warmest fall temperatures on record.
Alaska’s statewide November temperature was 17.3°F, 5.6°F above the 1925–2000 average, ranking in the warmest third of the 101-year period of record for the state. The state was especially warm across parts of the Interior and the North Slope, which had its fifth-warmest November on record—more than 11°F above the long-term average. For the fall season, Alaska’s average temperature was 30.2°F, 4.3°F above average and the tenth warmest on record.
For November, Hawai’i had an average temperature of 66.9°F, 0.4°F above the 1991–2020 average, ranking in the warmest third of the 35-year record. Fall temperatures also ranked in the warmest third of the historical record.
Precipitation
November precipitation for the CONUS was 1.70 inches, 0.53 inch below average, ranking in the driest third of the 131-year record. Precipitation was below average across much of the U.S. east of the Mississippi River, with the Southeast region experiencing its sixth-driest November on record. The Southeast region averaged just 1 inch of rainfall for the month—less than 35% of the 20th-century average. South Carolina had its second-driest November, marking its lowest November rainfall since 1931, while Florida received less than 15% of its average rainfall for its third-driest November. In contrast, precipitation in the West was mixed; portions of California and the Southwest recorded above-average rainfall, while parts of the northern Great Basin, Northwest and Rockies received below-average precipitation.

The fall season (September–November) was also dry for the CONUS, with a total of 5.97 inches of precipitation, 0.91 inch below average, ranking in the driest third of the record. While much of the Northwest and Rockies received near-average precipitation, wetter-than-average conditions prevailed in the Southwest and Plains, with several counties in southern California and southeastern Arizona recording their wettest fall on record. Further east, below- to much-below-average precipitation was seen across the middle and upper Mississippi Valley and Great Lakes, as well as a region stretching from the southern Plains across much of the South, Southeast, Mid-Atlantic and Northeast. The Southeast region recorded its driest fall since 1978 (sixth driest on record), with Georgia receiving less than half of its seasonal average for its fourth-driest fall. However, in contrast to the widespread dry trend in the east, parts of the Ohio Valley received above-average rainfall.
Alaska’s average monthly precipitation in November was 2.99 inches, 0.40 inch below average, ranking in the middle third of the 101-year record. The September–November total was 12.91 inches, 0.59 inch above average and in the middle third of the record.
Precipitation across Hawai’i in November averaged 5.28 inches, 1.19 inches below average, ranking in the middle third of the 1991–2025 record. Fall precipitation was 11.70 inches (4.30 inches below average), ranking in the driest third of the record.
Drought
According to the December 2 U.S. Drought Monitor report, about 41.4% of the contiguous U.S. was in drought, down about 2.3% from the beginning of November. Drought contracted or was reduced in intensity across much of the western U.S., particularly the Southwest, Great Basin and parts of the Rockies and Northwest, as well as in portions of the middle Mississippi and Ohio Valleys and the Northeast. In contrast, drought developed or intensified significantly across the Southeast and in parts of the southern Plains and upper Mississippi Valley.
Monthly Outlook
Above-average temperatures are likely across much of the southern tier, from the central Rockies through the southern Plains and Southeast, while below-average temperatures are favored in the northern Plains, upper Midwest, Great Lakes and Northeast. Above-average precipitation is expected in parts of the northern Rockies and northern Plains, and along the Gulf Coast through the Carolinas and into the Northeast, while below-average precipitation is favored across the central Plains and Florida Peninsula. Visit the Climate Prediction Center’s Official 30-Day Forecasts for more details.
Drought improvement or removal is expected in parts of the Northwest and northern Rockies, the western and central Gulf Coast, much of Alabama and Georgia, the Great Lakes, the Mid-Atlantic, the Northeast and Hawai’i. In contrast, drought is likely to persist or worsen across the central and southern Rockies, portions of the Plains, the middle and upper Mississippi Valley and the Florida Peninsula, with expansion likely in western Texas and eastern New Mexico. Visit the U.S. Monthly Drought Outlook website for more details.
Significant wildland fire potential in December is above normal across portions of western Texas and western Oklahoma, as well as southern Georgia and north-central Florida. For additional information on wildland fire potential, visit the National Interagency Fire Center’s One-Month Wildland Fire Outlook.
For more detailed climate information, check out our comprehensive November 2025 U.S. Climate Report scheduled for release on December 11, 2025. For additional information on the statistics provided here, visit the Climate at a Glance and National Maps webpages.
Here are some “ETs” recorded from around the planet the last couple of days, their consequences, and some extreme temperature outlooks, as well as any extreme precipitation reports:
Here is More Climate News from Monday:
(As usual, this will be a fluid post in which more information gets added during the day as it crosses my radar, crediting all who have put it on-line. Items will be archived on this site for posterity. In most instances click on the pictures of each tweet to see each article. The most noteworthy items will be listed first.)