The main purpose of this ongoing blog will be to track planetary extreme, or record temperatures related to climate change. Any reports I see of ETs will be listed below the main topic of the day. I’ll refer to extreme or record temperatures as ETs (not extraterrestrials).😜
Main Topic: U.S. December and 2025 Record Scoreboard and Climatological Review
Dear Diary. It’s past time for our monthly climatological review. Here on this site, we usually present monthly summaries near the 8th of each month, and each is available by clicking the link below:
https://guyonclimate.com/category/record-scoreboard-climatological-reviews
NCEI has had some computer troubles, thus the delay.
I’m repeating this mantra every month:
December 2025 got ranked by the National Center for Environmental Information for the lower 48 states as 5th warmest or 127th coolest since records began being kept in 1895 at +5.12°F above the 1901-2000 average.
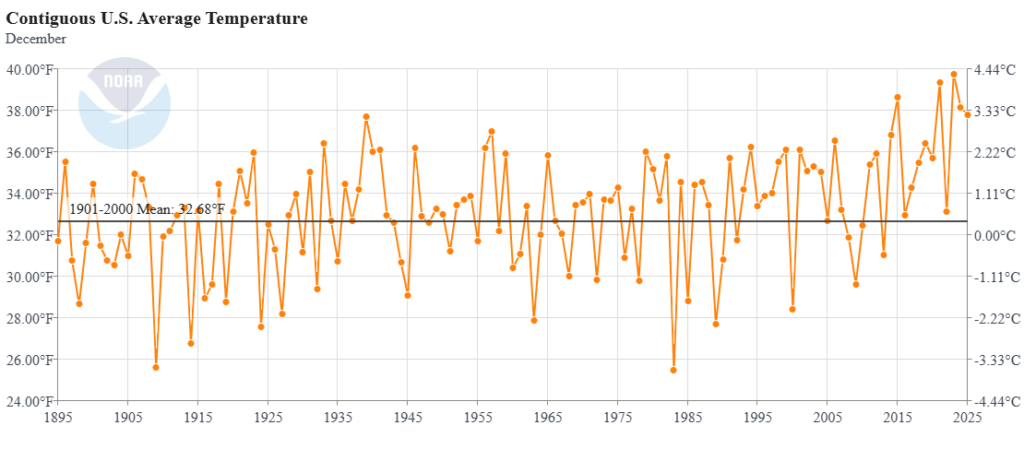
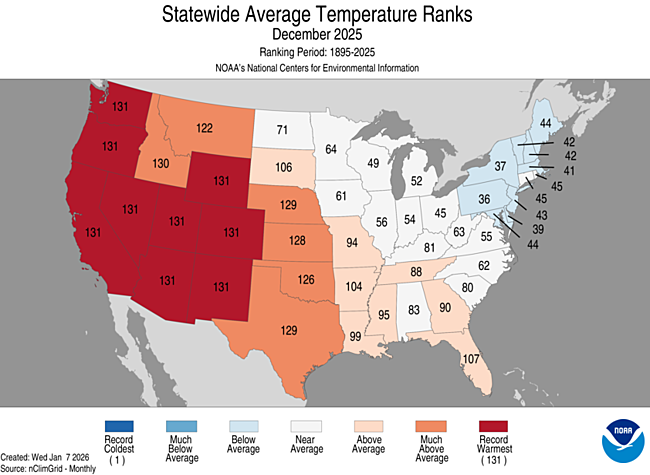
Practically all of the western states saw their record warmest December. The Northeast did have colder than average conditions, which is the only reason why December 2025 wasn’t the warmest on record for the lower 48 states.
The year 2025 got ranked by the National Center for Environmental Information for the lower 48 states as 4th warmest or 128th coolest since records began being kept in 1895 at +2.63°F above the 1901-2000 average.
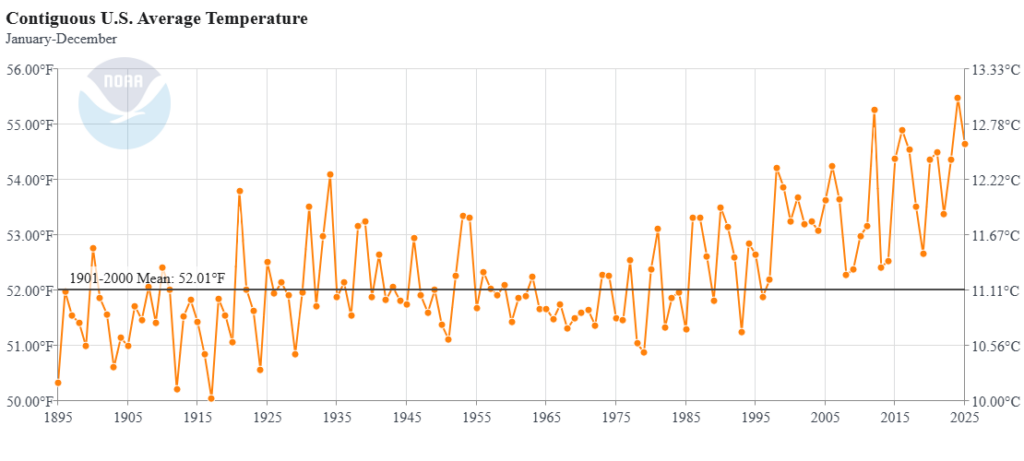
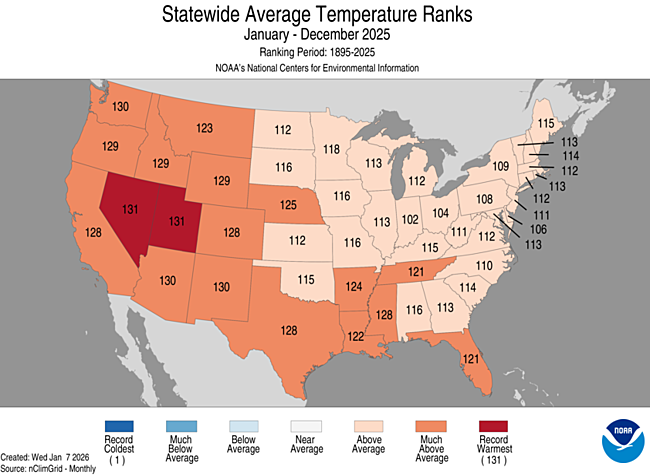
Nevada and Utah had their warmest year on record. Not one state had near average conditions- a big sign of climate change.
The above data was from:
https://www.ncdc.noaa.gov/cag/national/rankings
You can check out record totals for yourself on my NCEI record archives:
NCEI Record Count Archive – Guy On Climate
Here are my two U.S. Daily Record Scoreboards updated through 12/31/2025 (data compiled from the following NCEI site):
https://www.ncdc.noaa.gov/cdo-web/datatools/records
I’m also keeping tabs on record report totals to verify a scientific study I helped to complete in the decade of the 2000s. We’ll eventually see how skewed ratios of record warm to cold reports get by the year 2100, which the study mentions as 50-1 for DHMX vs. DLMN:
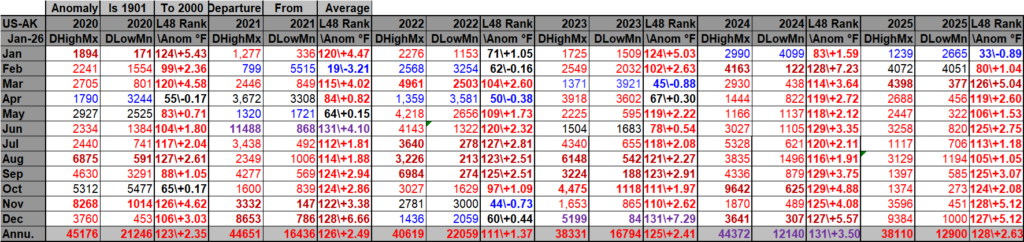
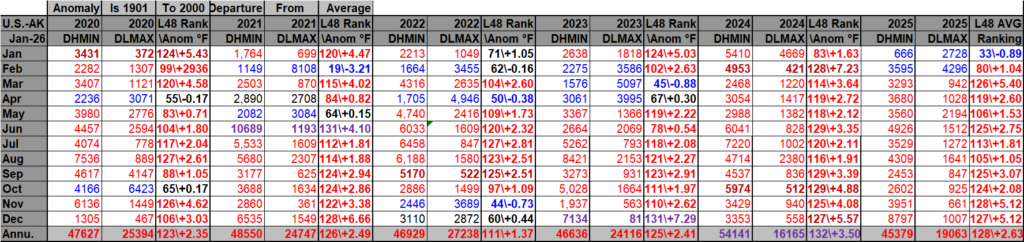
DHMX= Daily High Max Reports. DLMN= Daily Low Min Reports. DHMN= Daily High Min Reports. DLMX=Daily Low Max Reports.
Boldly highlighted red, blue, or purple colored months, such as December 2023 and June 2021, that have ratios of >10 to 1 daily or <1 to 10 of daily warm to low records are either historically hot or cold, most of which have made news. NCEI rankings are for the lower 48 states with the warmest ranking since 1895 of average temperatures being 131 and 1 being the coldest as of 2025. Blue colors represent cold months and red warm. Those months and years with counts close to a 1 to 1 ratio of highs to lows are colored black. All-time record hottest or coldest months and years are boldly colored in purple. NCDC rankings have been color coded (under tabs in each file) such that values of 55 to 75 are black representing neutral months or years (+ or – 10 from the average ranking of 64).
Totals are record reports for the entire United States including all territories minus those from Alaska. I’ve subtracted those from Alaska to get a better representation of what has occurred across the lower 48 states in association with lower 48 state rankings.
December 2025 had approximately a 9.4 to 1 ratio of record DHMX to DLMN individual record counts, so the color I used for that month was red on the top chart.
December 2025 had approximately a 8.8 to 1 ratio of record DHMN to DLMX individual record counts, so the color I used for that month was red on the bottom chart.
Due to climate change, we are seeing fewer blue colors on these Record Scoreboards with time.
The average temperature lower 48 state ranking for December 2025 was 127, which was colored red since it was warmer than average. We are seeing fewer blue colors on my charts, and December 2025 was yet another red or warm month.
I color rankings of +10 to -10 from the average ranking for the lower 48 states of 65 black, indicating that these are near average temperature wise. The top warmest ranking for 2025 would be 131 since rankings began in 1895.
January 2026 has gotten off to a very warm start, but we don’t have any reports of records in the NCEI system because of their computer outage problems I wasn’t able to add data for this month. I am confident that January 2026 will get pegged as a top 10 warmest January looking at reports and weather models going through the end of this month.
Interestingly, here is what we see as far as overall yearly ratios go for the 2020s so far. Warmth is key here:
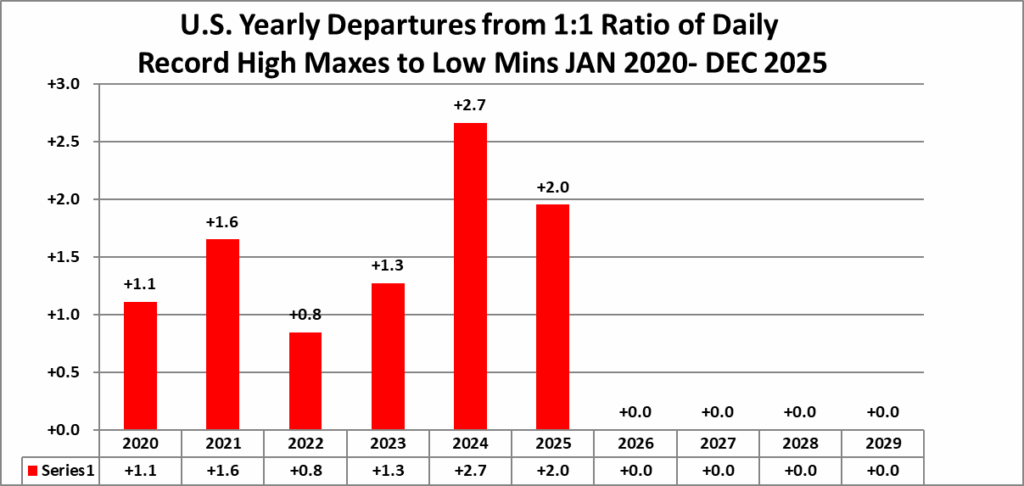
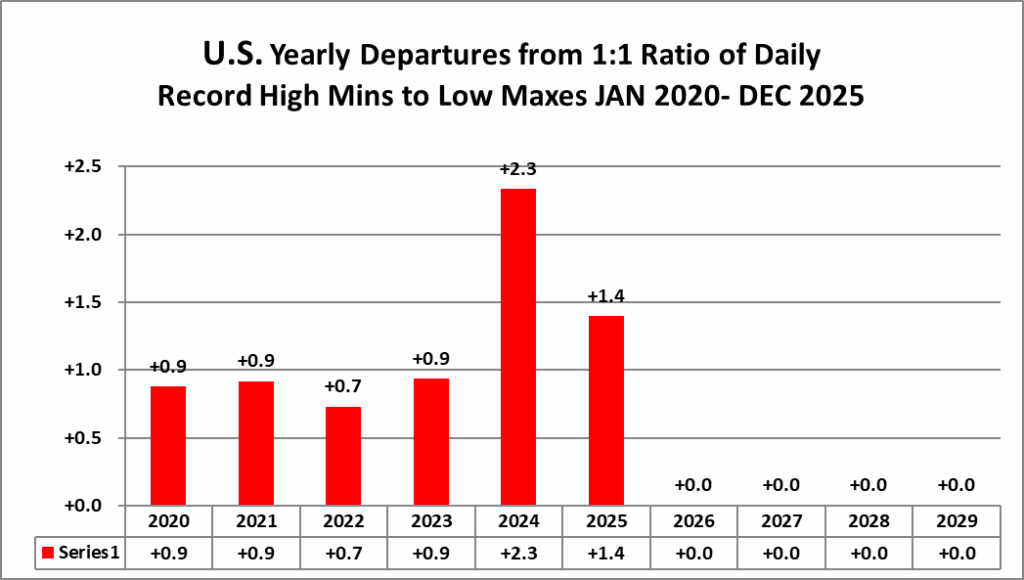
We now have 6 out of 10 full years’ worth of data for the 2020s. Interestingly, 2024 stands out as the warmest year, which was also the year with a strong El Niño.
Here is much more detailed climatology for December and the year 2025 as complied by NOAA:
Assessing the U.S. Temperature and Precipitation Analysis in 2025
2025 was the fourth-warmest year on record for the U.S.

Courtesy of Canva.com
Published January 13, 2026
Annual Key Points:
- For the first time since 2015, no hurricanes made landfall in the U.S. or its territories during 2025.
- The tornado in Enderlin, North Dakota, was the first verified EF-5 since 2013.
- The Eaton and Palisades Fires were the second- and third-most destructive California wildfires on record, respectively.
- The Texas Hill Country experienced a 1-in-100- to 1-in-1,000-year flood event that killed at least 135 people after nearly two feet of rain fell in just a few days.
- Utah and Nevada set new annual temperature records, with Utah eclipsing its previous record that had stood since 1934.

Other Highlights:
Temperature
Annual temperatures across the contiguous U.S. (CONUS) averaged 54.6°F in 2025, which was 2.6°F above the 20th-century average and ranked as the fourth-warmest year in the 131-year record. Temperatures were above average nationwide, with the most pronounced warmth across the western third of the country. Averaged across the entire region from the West Coast through the Rocky Mountains, this area recorded its warmest annual temperature on record.
")
Based on average annual temperatures across NOAA climate regions, the Southwest saw its warmest year on record; the West and Northwest both ranked third warmest, and the South tied for its fourth-warmest year. Statewide, Utah and Nevada recorded their warmest years on record at 4.3°F and 3.7°F above their 20th-century averages, respectively. In total, a dozen states experienced one of their four warmest years. At the county level, 62 counties across 10 states—more than eight million people—recorded their warmest year on record.
Annual temperatures in Alaska averaged 29.5°F, 3.5°F above the 1925–2000 average, ranking as the ninth warmest in the 101-year record. Much-above-average temperatures persisted through most of the year, producing the third-warmest January–November statewide, though a notably cold December lowered the annual ranking.
Hawaiʻi recorded an average annual temperature of 67.0°F, 0.7°F above the 1991–2020 average, placing the year within the warmest third of the 35-year record.
Precipitation
The CONUS received an average of 29.19 inches of precipitation in 2025, 0.73 inch below the 20th-century average, placing the year in the driest third of the 131-year record. The annual average does not fully reflect some of the pronounced regional wet and dry patterns seen throughout the year: the western U.S. experienced drier-than-average conditions in the first half of the year, followed by wetter-than-average conditions late in the year, while central and eastern regions generally saw above-average precipitation in spring and early summer, then below-average totals in the fall.
")
Much of the Southwest and Southeast ended the year below average, with deficits exceeding one foot in parts of the Southeast, while the central and northern Plains, along with the western Ohio Valley, were wetter than average. Kentucky had its 10th-wettest year on record, with over a third of its counties receiving more than a foot above their average annual rainfall.
Alaska received 39.72 inches of precipitation in 2025, 3.02 inches above average, placing the year within the wettest third of the 101-year record. Hawaiʻi recorded a total of 41.96 inches, 19.77 inches below average for the state, or about 68 percent of normal (1991–2020), marking its third-driest year in the 35-year record.
Tropical Cyclones
Despite the lack of U.S. landfalls in 2025, the North Atlantic hurricane season was active, producing 13 named storms, including five hurricanes and four major hurricanes; this amount was near the long-term average. The season was particularly notable for three Category 5 hurricanes—Erin, Humberto and Melissa—the second-most to form in a single year. While Erin and Humberto remained offshore, Hurricane Melissa made landfall on Jamaica at peak intensity with maximum sustained winds of 185 mph—tying with the 1935 Labor Day Hurricane as the strongest landfall on record in the Atlantic Basin and ranking as the strongest tropical cyclone worldwide in 2025. Although no direct landfalls occurred, remnants of tropical systems—including Super Typhoon Halong (Alaska) and Hurricane Priscilla (Southwest)—brought flooding impacts to the U.S. late in the year.
Floods
2025 was characterized by widespread and significant flooding, driven by a combination of atmospheric rivers, slow-moving convective systems and tropical moisture. Significant flood events were observed in every season and region; July alone recorded 1,434 flash flood warnings from the National Weather Service—the second-highest July total in 40 years. Several historic precipitation events overwhelmed infrastructure, producing 1-in-1,000-year rainfall recurrence intervals in parts of Kentucky, Tennessee, North Carolina and Texas. These events resulted in significant loss of life; catastrophic flooding in the Texas Hill Country in July resulted in at least 135 fatalities, while recurring storms in the Ohio Valley and severe weather across the South contributed to dozens of additional fatalities throughout the year.
The year featured stark regional extremes, beginning and ending with strong atmospheric rivers that impacted the West Coast; notable events in February, November and December caused widespread damage and fatalities in California and the Pacific Northwest. In the interior, stalled spring fronts produced historic rainfall across the Lower Ohio Valley, while summer saw a shift to the Northeast, where record-breaking rainfall rates inundated the New York City metro area. Unique hydrological extremes also marked the year, including a record-breaking glacial outburst flood in Alaska, tsunami-induced flooding in Hawaiʻi and deadly flash floods over wildfire burn scars in New Mexico.
Tornadoes
The preliminary U.S. tornado count for 2025 was 1,559, ranking as the fifth-highest on record and 127 percent of the 30-year (1991–2020) average. The year was marked by several notable extremes, including 300 preliminary tornado reports in March—a new March record—more than three times average. In addition to the Enderlin EF-5 tornado, five EF-4 tornadoes occurred in Arkansas, Louisiana, Illinois and Kentucky. At the state level, North Dakota shattered its previous annual tornado record of 61 (set in 2010), with 72 tornado reports in 2025.
Wildfires
The number of wildfires in 2025 was approximately 105 percent of the 20-year (2001–20) average, with more than 72,000 wildfires reported. The total number of acres burned from these wildfires—5.0 million acres—was 72 percent of the 20-year average of nearly seven million acres.
Southern California experienced some of the year’s most destructive fires. Fueled by Santa Ana winds gusting up to 90 miles per hour and dry conditions, the Eaton Fire burned 14,000 acres, while the Palisades Fire burned more than 23,000 acres and was the most destructive wildfire on record for Los Angeles. Together, these fires damaged or destroyed over 18,000 structures during January and were responsible for 31 fatalities. Later in the year, the Gifford Fire became the largest wildfire for California in 2025, burning over 131,000 acres across San Luis Obispo and Santa Barbara counties in August.
In Arizona, the Dragon Bravo Fire burned more than 145,000 acres between July and September, making it the largest wildfire of the year in the U.S. and the 10th-largest in Arizona history.
Alaska had a below-average 2025 wildfire season, with approximately one million acres burned—about two-thirds of the state’s 20-year (2001–20) average.
Drought
The drought footprint across the CONUS experienced marked fluctuations during 2025, following a distinct pattern of spring expansion, early summer contraction and autumn resurgence. The year began with 38.1 percent of the lower 48 states in moderate to exceptional drought (D1–D4). Coverage expanded steadily through March, reaching a spring peak of 44.7 percent on March 25. Widespread precipitation then drove a substantial decline, with drought coverage falling to its annual minimum of 29.6 percent by June 3. However, this improvement was short-lived. Drought conditions intensified during late summer and autumn, with coverage increasing rapidly to a yearly maximum of 46.1 percent on October 21 and again on November 18. By the final week of the year (December 30), drought coverage had eased slightly but remained elevated at 42.8 percent, leaving a larger portion of the country in drought than at the start of 2025.
Snowfall
The 2024–25 snow season featured above-average snowfall across parts of the mountainous West, central Plains, Gulf Coast, Southeast and Ohio Valley, while below-average snowfall occurred across much of the Great Basin, southern Rockies, northern Plains, Upper Midwest and portions of the Northeast.
The 2025–26 snowfall season to date (October 1–December 31, 2025) saw above-average snowfall across much of the Midwest and Great Lakes region, with lake-effect areas receiving more than a foot above average for this period. In contrast, much of the Mountain West and High Plains received lower-than-average snowfall, particularly the Cascades, Wasatch and Uinta and the northern and southern Rockies, with the exception of the Sierra Nevada and parts of the northern Cascades, Bitterroots and middle Rockies.
Climate Extremes Index
The U.S. Climate Extremes Index (USCEI) for 2025 was 58 percent above average, ranking 12th-highest in the 116-year record. Warm extremes in both maximum and minimum temperatures were above average across the CONUS, as was the extent of exceptionally dry conditions (very low Palmer Drought Severity Index); each of these indicators ranked among the top 10 on record. Several regions had an annual CEI that was much above average, with the Southwest recording its third highest on record.
Warm temperature extremes were widespread in 2025. Extremes in overnight minimums affected more than 85 percent of the West, Northwest and Southwest regions and over half of the CONUS as a whole, while extremes in daytime maximums covered more than three-quarters of those same western regions. The Southwest also recorded its fourth-largest extent of extremely dry conditions on record, with all regions ranking in the driest third historically.
Check out the comprehensive 2025 Annual U.S. Climate Report. For additional information on the statistics provided here, visit the Climate at a Glance and National Maps webpages.
More:
Here are some “ETs” recorded from around the planet the last couple of days, their consequences, and some extreme temperature outlooks, as well as any extreme precipitation reports:
Here is More Climate News from Tuesday:
(As usual, this will be a fluid post in which more information gets added during the day as it crosses my radar, crediting all who have put it on-line. Items will be archived on this site for posterity. In most instances click on the pictures of each tweet to see each article. The most noteworthy items will be listed first.)