The main purpose of this ongoing blog will be to track global extreme or record temperatures related to climate change. Any reports I see of ETs will be listed below the main topic of the day. I’ll refer to extreme or record temperatures as ETs (not extraterrestrials).😜
Main Topic: A New Way to Keep Tabs on El Niño and La Niña in Response to a Warming World
Dear Diary. Scientists are constantly trying to improve the way that we look at and judge what is happening with our world. This would include scales such as the metric system. In the world of meteorology, I have been attempting to apply the Saffir-Simpson scale used for hurricanes to heat waves and cold outbreaks in order to better inform the public about the dangers from these systems.
My friend Bob Henson has informed all that a new scale will be used by NOAA to better describe ENSO events that are increasingly being affected by surrounding warming oceans. This effort should better describe the interaction between El Niño and La Niña events and how they are affecting weather during any given year. Here are many more details:
A new and better way to keep tabs on El Niño and La Niña » Yale Climate Connections
A new and better way to keep tabs on El Niño and La Niña
Developed in response to a warming world, NOAA’s revised scale more precisely identifies which episodes are likely to have the biggest impacts.

by Bob Henson
February 5, 2026
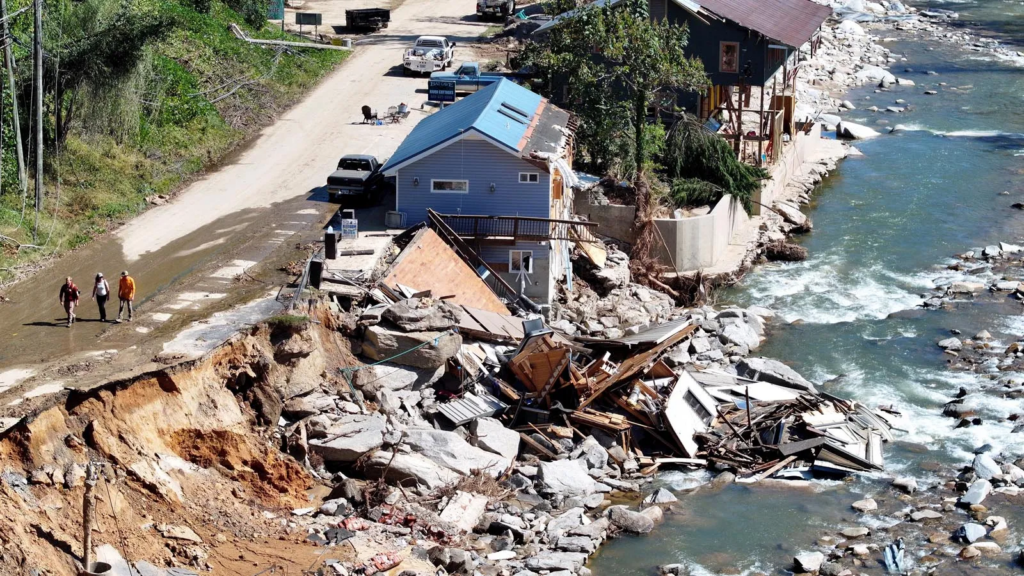
An aerial view of people walking past destroyed and damaged buildings in the aftermath of Hurricane Helene flooding on October 8, 2024, in Bat Cave, North Carolina, located about 18 miles southeast of Asheville. Although the monitoring index in use at that time did not show a La Niña event in progress, a newly revamped index shows that a weak La Niña episode was actually occurring when Helene formed. (Photo by Mario Tama/Getty Images)
Global warming has made it tougher and tougher to nail down El Niño and La Niña, the regional warmings and coolings of the eastern tropical Pacific Ocean that can torque weather for months over large parts of the world. Starting this February, forecasters at NOAA are using a new and improved index that avoids the problems caused by using a stationary “ruler” to measure El Niño and La Niña in a climate that’s no longer stationary.
Meteorologists in both operations and research are hailing the new index as a key step in improving crucial seasonal forecasts used by everyone from farmers to emergency managers.
When the surface waters of the eastern Pacific Ocean warm up (El Niño) or cool down (La Niña), typically for one to three years, the reverberations influence everything from African rainfall to Atlantic hurricane formation to drought in the U.S. Southwest. Although each episode varies, the large-scale impacts are somewhat predictable. So by the time an El Niño or La Niña event is kicking in – typically by Northern Hemisphere autumn, sometimes a bit sooner – it’s possible to make useful forecasts of what to expect the following northern winter.
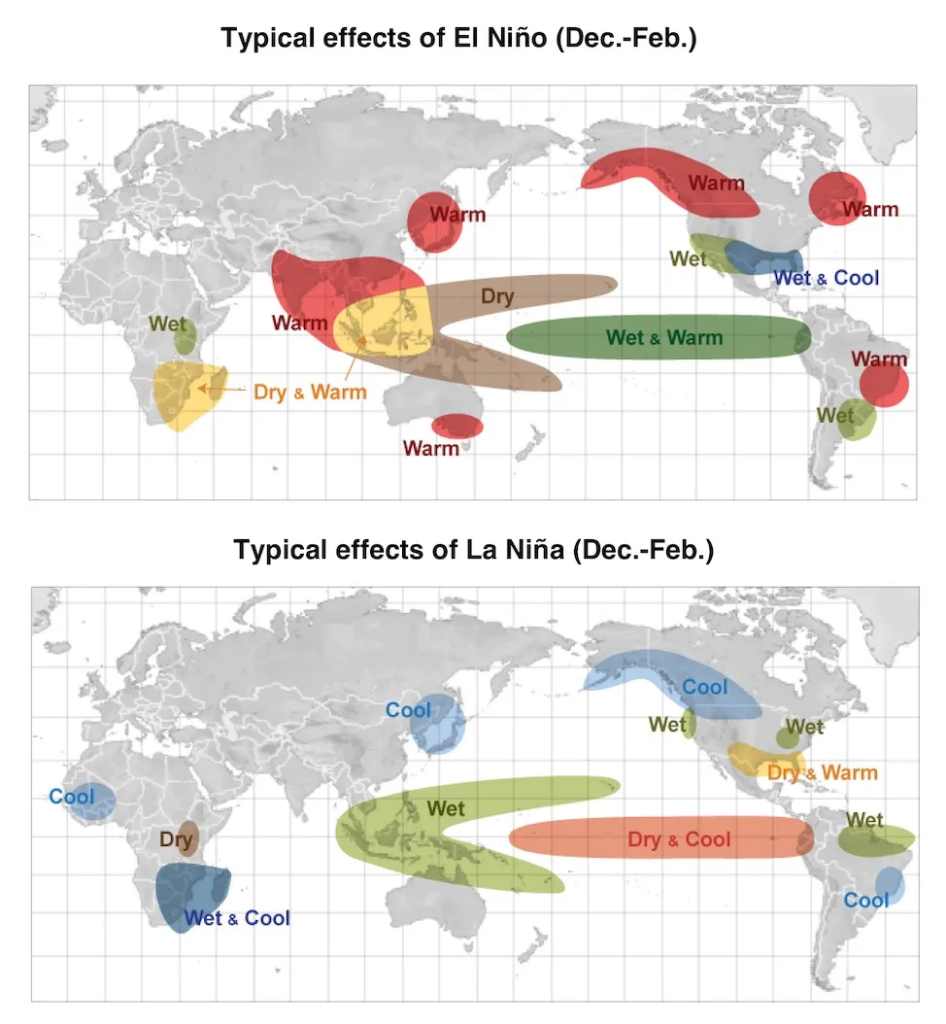
Figure 1. Typical weather patterns (teleconnections) favored during northern winter by El Niño (top) and La Niña (bottom). (Image credit: NOAA/NWS)
But the guidance furnished by El Niño and La Niña has had some noteworthy misses in recent years. And researchers have found one reason why – which has led to the creation and adoption of the Relative Oceanic Niño Index, or RONI, in place of the Traditional Oceanic Niño Index, or TONI.
Michelle L’Heureux, lead forecaster for NOAA’s regular updates on El Niño and La Niña, said in an email that she’s looking forward to working with RONI. She sees the index, as described in a 2024 paper on which she’s lead author, as a clearer indicator of the El Niño–Southern Oscillation system (ENSO), which refers to El Niño, La Niña, and the ocean-atmosphere coupling that drives them.
“Our traditional indicator, which is based on sea surface temperatures, is increasingly misaligned with changes in the atmosphere that are intrinsic with the coupled ENSO phenomenon,” L’Heureux said in an email. “The RONI seems to better target this coupling.”
The weather services of Australia and New Zealand have already adopted RONI, and India is among other nations mulling the switch, according to L’Heureux. (For continuity, NOAA will maintain statistics for both TONI and RONI.)
“The Relative Oceanic Niño Index will provide a more accurate assessment of El Niño and La Niña events as the global oceans continue to warm,” said Clara Deser, senior scientist at the NSF National Center for Atmospheric Research, in an email. “This background warming, undoubtedly a reflection of human-caused climate change, obscures the true magnitude of these events, hindering operational prediction and associated climate impact risk.”
Why RONI works better than TONI in a warming world
El Niño and La Niña conditions involve both the tropical Pacific and the overlying atmosphere. As waters warm and cool across vast parts of the region (including areas bigger than the United States), the atmosphere rises and sinks in response. In turn, those updrafts and downdrafts can reinforce an El Niño or La Niña event, or hasten its end.
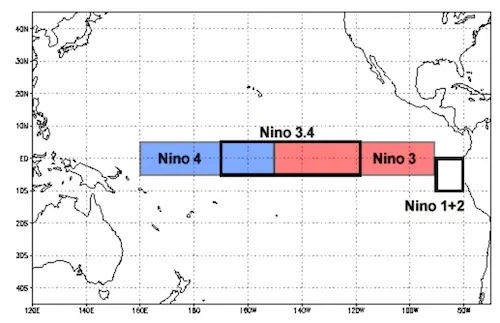
Figure 3. Niño regions of the tropical Pacific Ocean. (Image credit: NOAA/NCEI)
At the heart of RONI and TONI is the sea surface temperature across a stretch of the central and eastern tropical Pacific known as the Niño 3.4 region (see Fig. 3). If surface waters in this region rise to at least 0.5 degrees Celsius above average, and if the atmosphere is behaving in sync, then El Niño conditions are deemed to be present. To qualify as a full-fledged “episode,” the Niño 3.4 temperature must run at least 0.5°C above average for at least five overlapping three-month periods. Likewise, if Niño 3.4 gets at least 0.5°C below average, and the atmosphere is behaving accordingly, then La Niña conditions are in place.
The challenge with this traditional mode of assessment is what to consider “average.” At least 30 years is needed to weed out natural variations from climatology. The traditional method is to compare current Niño 3.4 readings against the average of the most recent 30 years (currently the period 1991–2020). Even though this comparison point is nudged forward every five years, it inherently reflects a cooler world than the one we live in now.
In contrast, RONI is calculated by starting with TONI and then subtracting the current sea surface temperatures averaged across the entire global tropics between 20 degrees north and south. (A scaling factor is applied to ensure the correct amount of variability.) In this way, RONI better identifies El Niño and La Niña events within the overall climate. Moreover, given that the atmospheric reverberations of El Niño and La Niña are influenced by ocean temperatures elsewhere, RONI captures more of that potential interplay.
“One of the nice attributes of RONI is that it is relatively insensitive to the choice of climatology,” said L’Heureux.
La Niña surges to the fore even more dramatically
One immediate consequence of the shift from TONI to RONI is an added boost in the predominance of La Niña over El Niño over the last 10 to 20 years. For reasons still being analyzed, but perhaps related to human-caused climate change, the eastern tropical Pacific has cooled significantly over the last several decades, in contrast to most of the world’s oceans and in spite of what climate models have long predicted.
READ: Why winter rains keep skipping the Southwest
Even with the traditional index, it’s clear that La Niña has been more prevalent than El Niño for some time. With the switch to RONI, the skew is now even more dramatic.
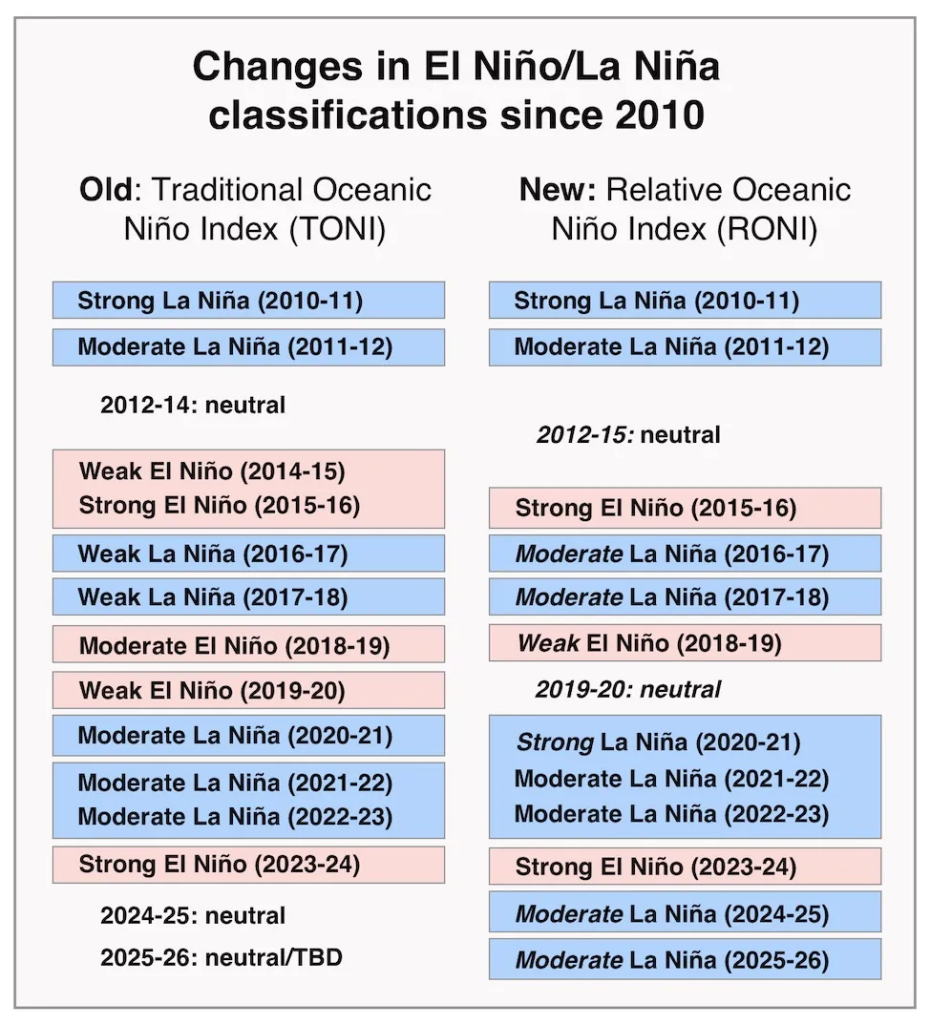
Figure 4. Classification of the timing and strength of El Niño and La Niña events since 2010 under (left) the Traditional Oceanic Niño Index, or TONI, and (right) the new Relative Oceanic Niño Index, or RONI. Italics are used to highlight where RONI classifications differ from those in TONI. Multi-year color blocks denote El Niño or La Niña events that are continuous for two or more years. Strength rankings are based on the single highest three-month departure in each northern-winter-centered year, and using the thresholds of plus or minus 0.5°C for “weak”, 1.0°C for “moderate”, and 1.5°C for “strong.” (Graphic by Bob Henson based on TONI and RONI data from NOAA/NWS/CPC)
As shown in Fig. 4, two La Niña episodes (2016-17 and 2017-18) have been upgraded from weak to moderate. Two moderate La Niña events with a brief break in between (2020-21 and 2021-23) are now a continuous three-year event (2020-23) peaking in the strong range. And two years of El Niño conditions (2014-15 and 2019-20) have been “demoted” to neutral.
Under the traditional index, the marginally cool conditions that have predominated since 2024 weren’t making the grade for qualifying as a La Niña episode. Under RONI, these are bumped up to two moderate events, 2024-25 and 2025-26, with the latter still underway. A bookkeeping note: keep in mind that just as a Category 5 hurricane may hit that peak for only a brief part of its life, the peak strengths of El Niño and La Niña shown in Fig. 4 may apply to as little as one three-month period. Update: Fig. 4 has been enhanced to show the strengths for each northern-winter-centered year, even for multi-year episodes.
If RONI had already been in use since 2010, it might have given forecasters an early heads-up on the events above. In their 2021 paper that laid out the case for RONI, Defining El Niño indices in a warming climate, a group led by Geert Jan van Oldenborgh (Royal Netherlands Meteorological Institute) noted that the 2016-17 La Niña event had more intense effects than expected in several areas, contributing to devastating autumn-rain shortfalls in the Horn of Africa and excessive rains in Indonesia.
“With increased attention and lead time, greater and earlier action could have been taken to prevent some of the humanitarian impacts of the La Niña teleconnections,” they wrote.

Figure 5. People and livestock gather at a nearly dried-up riverbed on February 24, 2017, in Dhudo, Somalia. The nation was on the brink of famine in early 2017, with over half of the country’s population facing acute food insecurity, according to the United Nations. (Photo by Andrew Renneisen/Getty Images)
On the other hand, the impacts in the midlatitude Northern Hemisphere of the 2023-24 El Niño event – which was downgraded from “strong” to “moderate” in the switch to RONI – ended up weaker than anticipated overall. In a paper published in January, Clara Deser and colleagues use model experiments to show that the atmospheric effects of global oceanic warming may have largely cancelled out the expected impacts of the 2023-24 El Niño.
The hurricane connection
RONI may also help explain why the Atlantic hurricane seasons of 2016, 2017, 2020, 2021, 2022, 2024, and 2025 caused so much trouble, and why some of these years outperformed seasonal forecasts that incorporate how La Niña and El Niño are expected to behave. In each of these years, La Niña conditions – which tend to heighten the risk of Atlantic hurricanes, especially in the Gulf of Mexico – show up more strongly in RONI than in TONI.
“I’m a huge fan of the RONI,” said Phil Klotzbach (Colorado State University) in an email. A group led by CSU’s Levi Silvers recently used RONI to show where tropical cyclones are most likely to rapidly intensify during El Niño and La Niña. They found the intensification patterns were better correlated with RONI than with TONI.
The strong El Niño event underway in 2023 would have normally led Klotzbach’s group to predict a relatively quiet Atlantic season. However, the Atlantic and Indian Oceans were also extremely warm, and climate models were predicting low wind shear in the Atlantic. Based largely on those model signals, said Klotzbach, “we went with an above-average seasonal forecast, and it verified pretty well… While sea surface temperatures (SSTs) in the tropical Pacific matter, what matters more is how those SSTs are relative to the rest of the globe.”
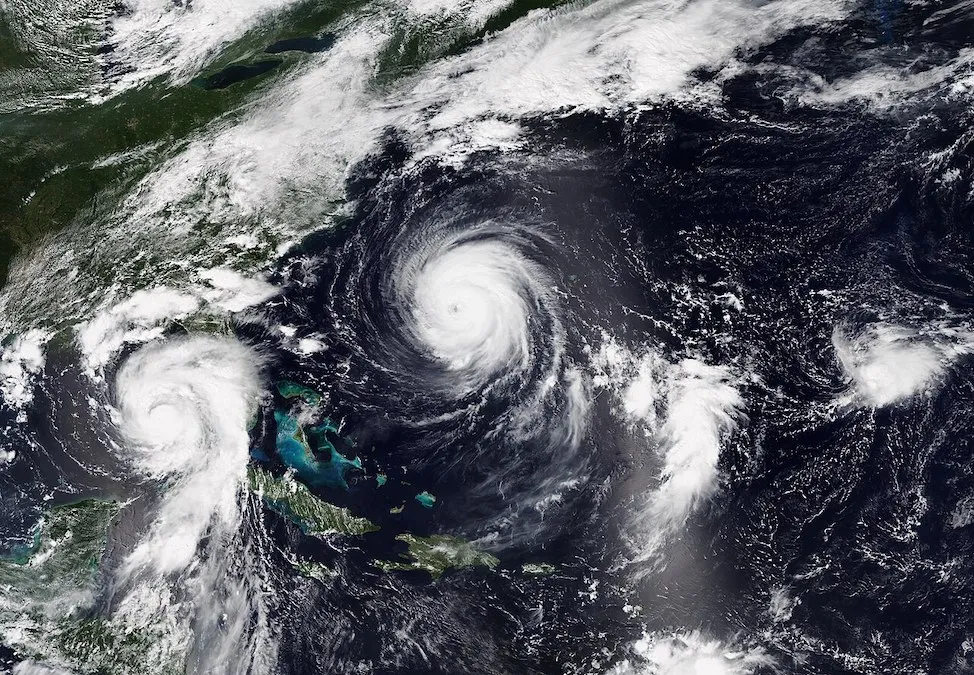
Figure 6. Hurricane Idalia (left), Hurricane Franklin (middle), and Tropical Depression Eleven (right) on August 29, 2023, during one of the busiest stretches of what became the fourth busiest Atlantic hurricane season on record. This was despite the presence of a strong El Niño event, as ranked using the old TONI rating system. Under the new RONI system, the event was only at moderate levels during hurricane season, though it still peaked as a marginally strong event by the end of 2023. (Image credit: NOAA, via Wikimedia Commons)
In fact, tropical cyclone researchers were among the first to point out the importance of using relative sea surface temperatures, according to Michael Tippett (Columbia University). In a paper published in November, Tippett and colleagues scrutinized how well the various indices relate to Atlantic tropical cyclone activity.
“We found that modern ENSO indices (especially RONI) had modest but statistically detectable advantages over the traditional index,” Tippett said in an email. The benefit of RONI was especially noteworthy in predicting the number of named storms, he added.
Tippett also noted: “Interestingly, the difference between the traditional and modern ENSO indices is increasing significantly.”
Keeping up with a warming climate
Jeremy Klavans, a postdoctoral scientist at the University of Colorado Boulder, is among those who’ve been examining the multi-decade persistence of La Niña and what might be shaping it. He points to the usefulness of weeding out climate change through such techniques as switching from TONI to RONI, as well as the need to ensure nothing important gets omitted when considering regionally oriented modes such as ENSO and the Pacific Decadal Oscillation in a warming world.
“These regional modes are primarily useful if they capture a regional, not global, signal and if they explain meaningful impacts. As such, most of these modes attempt to exclude the global warming signal,” said Klavans in an email. “As the world warms, this task has become harder.”
As Klavans sees it, “RONI is a well-reasoned attempt to account for the warming signal in a challenging operational environment. Further, it appears to be useful, as it is associated with a reasonably stable set of climate impacts.
“However, I think there is an open question about regional modes like RONI and the Pacific Decadal Oscillation: how societally relevant will they be going forward? Will ENSO or other indices be as useful for predicting regional climate as they used to be? As we continue to refine the definitions of our climate indices, it’s vital that we continue to update our understanding of how new indices affect regional climate.”
Jeff Masters contributed to this post
Bob Henson’s “A new and better way to keep tabs on El Niño and La Niña” was first published on Yale Climate Connections, a program of the Yale School of the Environment, available at: http://yaleclimateconnections.org. This work is licensed under a Creative Commons Attribution-Noncommercial-No Derivative Works 2.5 license (CC BY-NC-ND 2.5).
Here are some “ETs” recorded from around the U.S. the last couple of days, their consequences, and some extreme temperature outlooks, as well as any extreme precipitation reports:
Here is More Climate News from Thursday:
(As usual, this will be a fluid post in which more information gets added during the day as it crosses my radar, crediting all who have put it on-line. Items will be archived on this site for posterity. In most instances click on the pictures of each tweet to see each article. The most noteworthy items will be listed first.)