The main purpose of this ongoing blog will be to track planetary extreme, or record temperatures related to climate change. Any reports I see of ETs will be listed below the main topic of the day. I’ll refer to extreme or record temperatures as ETs (not extraterrestrials).😜
Main Topic: New Heavier Rainfall Data via Climate Central
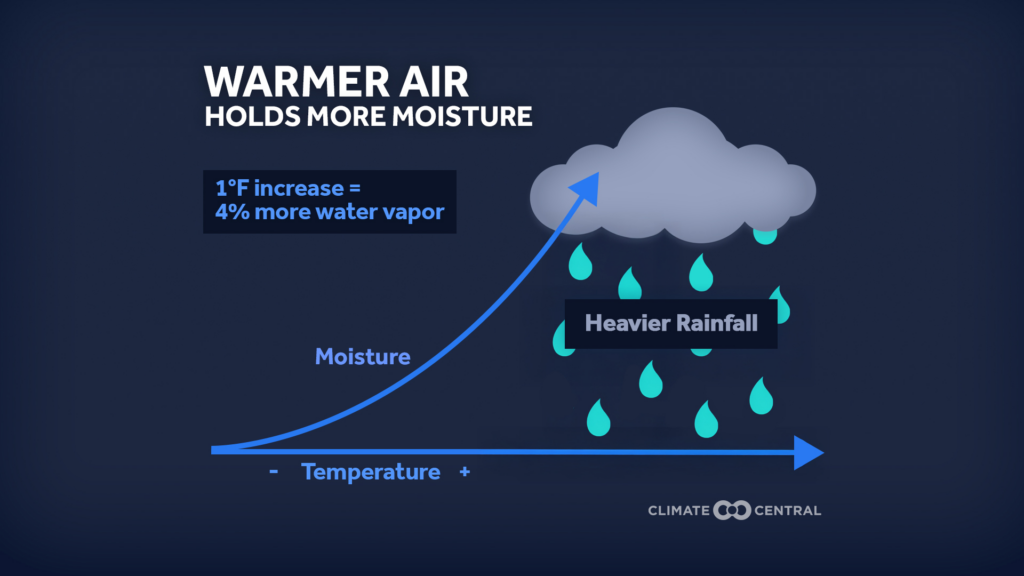
Dear Diary. Unless you have been living underneath a rock (or were an adamant climate change denier), you know by now that a warning atmosphere holds more moisture. That added moisture in turn gets released in the form of heavier precipitation. That’s simple physics. Today Climate Central has produced more U.S. statistics cementing that fact.
The trend of heavier precipitation can cause all kinds of problems such as worse flooding, but at least it aids agricultural interests and does end prolonged droughts. However, there is also the trend of more and longer droughts ending in a big sometimes flooding splash, which is not good.
Here are Climate Central’s findings:
Heavier Rainfall in 129 U.S. Cities | Climate Central
Climate Matters
April 29, 2026
Heavier Rainfall in 129 U.S. Cities


KEY FACTS
- Climate change is supercharging the water cycle, bringing heavier rainfall extremes and related flood risks across the U.S.
- Some 129 U.S. cities (90% of 144 analyzed) have experienced an increase in hourly rainfall intensity since 1970.
- Across these 129 locations, hourly rainfall rates are now 15% higher on average than in 1970.
- Hourly rainfall intensity has increased in every U.S. region, with the largest average increases among cities in the Upper Midwest.
- People and ecosystems in both wet and dry locations are facing the risks that come with heavier rainfall in our warming climate.
This Climate Matters analysis is based on open-access data from the National Oceanic and Atmospheric Administration (NOAA). See Methodology for details.
Download data
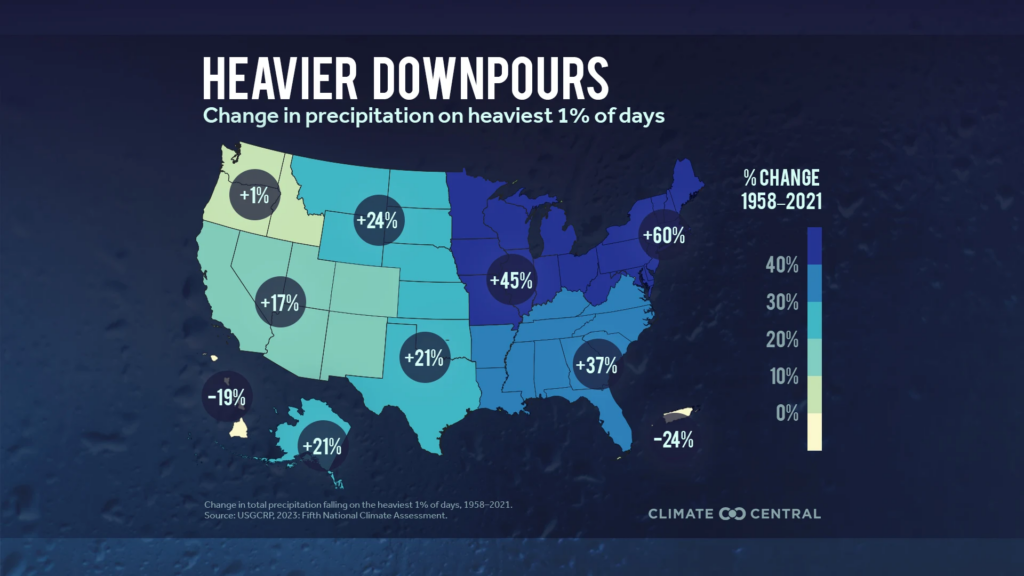
Heavier downpours, higher flood risk
Climate change is bringing heavier rainfall extremes and increased, inequitable flood risk to many parts of the U.S.
For every 1°F of warming, the air can hold 4% more moisture — increasing the chances of heavier downpours that contribute to flash flooding hazards.
We’ve already seen these changes occur. As the climate has warmed over the last six decades, the heaviest rainfall events have become more intense across the continental U.S. and especially in the Northeast, Midwest, and Southeast.
Heavier downpours bring more rain, faster — causing flash flooding and landslides that can displace families, drown crops, damage infrastructure, and expose people to hazardous debris, contaminants, and water-borne disease.
- Learn more: Climate Change and Inland Flooding
The rapid onset of flash floods limits time to get people out of harm’s way. Due to decades of systemic racism and discrimination, people of color tend to be disproportionately exposed to flooding, as do people living in mobile homes. These heightened vulnerabilities tend to be higher in rural areas and in the southern U.S.
Children are among the most vulnerable to the physical, mental, and emotional health impacts experienced during and after a flood.
- Learn more: Climate Change and Children’s Health: Flooding
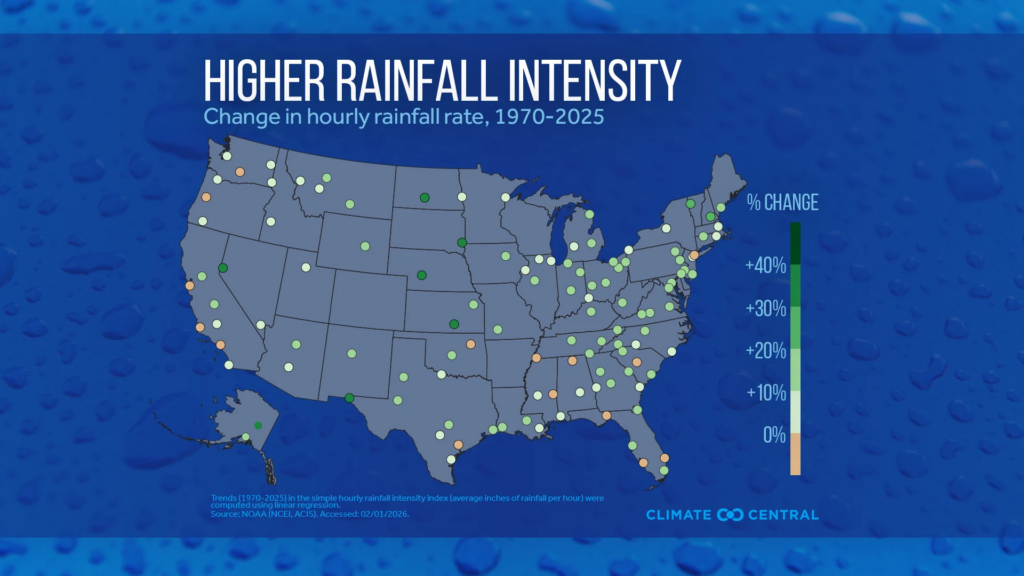
Higher rainfall intensity in 129 U.S. cities
To understand how rainfall intensity has changed locally, Climate Central calculated long-term trends (1970-2025) in hourly rainfall rates in 144 major U.S. cities.
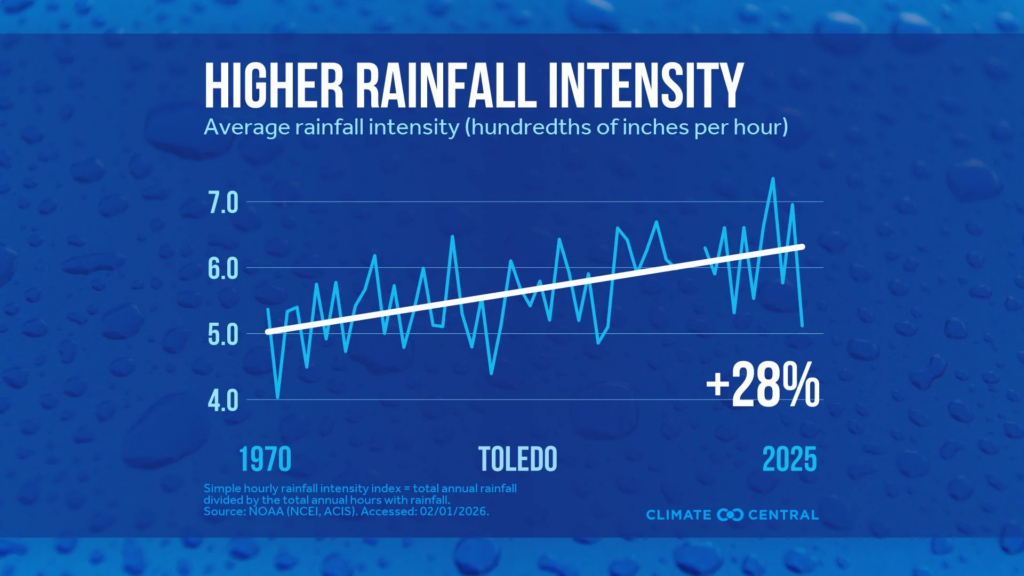
This analysis is based on the simple hourly rainfall intensity index, or the total annual rainfall divided by the total hours of rainfall each year.See Methodology for details.
An increase in the simple hourly rainfall intensity index indicates an increase in hourly rainfall rates — in other words, more rain falling per hour. NOAA’s rain rate videos show what various hourly rainfall rates look like.
- Nearly all (90%, or 129) of the 144 cities analyzed have experienced an increase in hourly rainfall intensity since 1970.
- On average, these 129 cities have experienced a +15% increase in hourly rainfall intensity since 1970.
- Most (63%, or 91) of the 144 cities analyzed experienced an increase in hourly rainfall intensity of +10% or more.
Rainfall intensity increasing — even in dry places
The trend toward heavier rainfall rates since 1970 is widespread. Grouping cities by U.S. climate region, the largest average increases in hourly rainfall intensity were observed in the:
- Upper Midwest (+18% on average);
- Northern Rockies and Plains (+16% on average);
- Ohio Valley (+15% on average).
The locations experiencing the largest increase in hourly rainfall rates span a wide range in mean annual precipitation.
| Location | Change in simple hourly rainfall intensity index, 1970-2025 |
|---|---|
| Wichita, KS | +38% |
| Reno, NV | +37% |
| Fairbanks, AK | +37% |
| El Paso, TX | +37% |
| Sioux Falls, SD | +31% |
| Bismarck, ND | +30% |
| North Platte, NE | +30% |
Both wet and dry locations face rising risks from heavier rainfall. And places with high total annual rainfall don’t necessarily experience the largest increases in rainfall intensity.
Warmer future, heavier precipitation extremes
With continued warming, precipitation extremes are likely to increase globally — even in regions with decreasing average precipitation, according to the latest reports from the Intergovernmental Panel on Climate Change.
With 2°C (3.6°F) of global warming, most of the U.S. is projected to see increases in precipitation extremes. The planet has already warmed about 1.2°C (2.1°F).
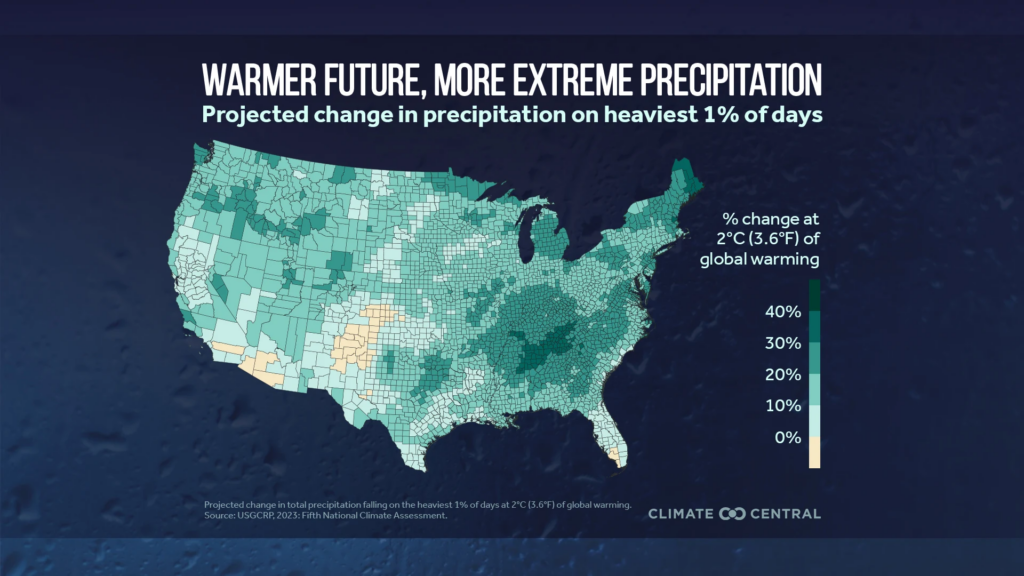
- With 2°C (3.6°F) of global warming, the majority (85%) of 3,111 total U.S. counties are likely to experience a 10% or higher increase in the total amount of precipitation falling on the heaviest 1% of days.
- Counties likely to experience at least a 30% increase in extreme precipitation are concentrated in: Tennessee, Alabama, Georgia, Mississippi, Maine, North Carolina, and Kentucky.
- Alaska and Hawaii are likely to experience some of the highest levels of extreme precipitation intensification (43% and 30%, respectively) at 2°C (3.6°F) of global warming.
A recent study suggests that with unchecked future levels of heat-trapping pollution, U.S. flash floods could also intensify, especially in the Southwest — underscoring that risks posed by extreme rainfall affect both wet and dry regions.
These rising rainfall intensity risks are unlikely to be equally shared. A recent study suggests that the burdens of an estimated 26% increase in overall U.S. flood risk by 2050 could disproportionately impact Black communities along the Atlantic and Gulf coasts.
Only by rapidly accelerating efforts to reduce heat-trapping pollution can we ensure that global warming levels remain below 2°C.
LOCAL STORY ANGLES
Check local flood risk.
Local factors including topography, infrastructure, watershed health, and precipitation trends influence an area’s flood risk.
The Federal Emergency Management Agency’s Flood Map Service Center is the official public source for flood hazard information, searchable by address.
Within NOAA, the National Weather Service’s Interactive Flood Information Map is a hub for information about flood safety and flood hazards in each state. The National Water Prediction Service provides an interactive U.S. map of current flood observations and forecasts. NOAA’s Experimental Flood Hazard Outlook, issued twice daily, summarizes current flood conditions based on the latest river level observations with an assessment of flood risk.
From the U.S. Geological Survey, USGS Flood Information provides maps and resources for current and historical floods across the U.S.
Other sources of local flood risk include First Street’s flood model, which provides free general flood risk information for every property in the U.S., searchable by address. Paid plans offer access to detailed property-level information. First Street’s 12th National Risk Assessment, published in February 2025, provides a national overview of trends in real estate value due to climate-related risks.
What can you do to protect against flooding and extreme precipitation?
Individual homeowners can insure their homes, maintain rainwater systems, reduce impervious surfaces on their property, elevate utilities and equipment, and take on low-cost indoor projects recommended by FEMA. Communities can invest in flood management systems, green infrastructure, and watershed restoration.
CONTACT EXPERTS
To request an interview with a Climate Central expert about this analysis, please contact Abbie Veitch, aveitch@climatecentral.org.
FIND EXPERTS
Submit a request to SciLine from the American Association for the Advancement of Science or to the Climate Data Concierge from Columbia University. These free services rapidly connect journalists to relevant scientific experts.
Browse maps of climate experts and services at regional NOAA, USDA, and Department of the Interior offices.
Explore databases such as 500 Women Scientists, BIPOC Climate and Energy Justice PhDs, and Diverse Sources to find and amplify diverse expert voices.
Reach out to your State Climate Office or the nearest Land-Grant University to connect with scientists, educators, and extension staff in your local area.
METHODOLOGY
The simple hourly rainfall intensity index was calculated for 144 U.S. weather stations with sufficient data quality over the period of analysis (1970-2025) using hourly rainfall data obtained from two different NOAA sources: the National Centers for Environmental Information (NCEI) Hourly Precipitation Data and the Applied Climate Information System (ACIS), which is developed, maintained, and operated by NOAA’s Regional Climate Centers. NCEI data was used for 1970-2011. ACIS data was used for 2012-2025.
Long-term trends (represented as a percent change in the simple hourly rainfall intensity index) are based on the percent change calculated between the endpoints (1970 and 2025) of the linear regression trend line.
Summary statistics were reported for 144 of 154 stations due to data completeness issues for 10 stations: Colorado Springs, CO; Dallas, TX; Hazard, KY; Kansas City, MO, Lincoln, NE; Orlando, FL; Paducah, KY; Rapid City, SD, Shreveport, LA; and Stockton, CA.
The simple hourly rainfall intensity index is defined as the total annual rainfall divided by the total hours of rainfall each year (inches per hour). This means that the simple hourly rainfall intensity index can show increasing hourly rainfall intensity even if the total amount of annual rainfall is decreasing.
The simple hourly rainfall intensity index is a modification of the simple precipitation intensity index (modified to evaluate per hour rather than per day), one of the Climdex climate extremes indices.
For the detailed methodology, please refer to Climate Central’s 2022 report, Wetter Rainfall Hours in a Warming Climate.
Climate Matters © 2026 by Climate Central is licensed under CC BY 4.0
This license grants permission to use, distribute, and reproduce all text, graphics, and multimedia content published on this page in any medium, provided that Climate Central is credited per the CC BY 4.0 license.
Permission to use data and other materials published on this page is granted for non-commercial uses, commercial news purposes, and educational purposes as governed by Climate Central’s Terms of Use.
Here are some “ETs” recorded from around the U.S. the last couple of days, their consequences, and some extreme temperature outlooks, as well as any extreme precipitation reports:
Here is More Climate News from Wednesday:
(As usual, this will be a fluid post in which more information gets added during the day as it crosses my radar, crediting all who have put it on-line. Items will be archived on this site for posterity. In most instances click on the pictures of each tweet to see each article. The most noteworthy items will be listed first.)